A supermarket runs in a fast, highly competitive, and customer-driven environment. Every day teams track sales, operations, inventory, margins, customer experience, supply chain performance, and many other metrics. Because of this fast pace, supermarket leaders need an easy and effective way to monitor performance at every level. A Supermarkets KPI Dashboard in Power BI helps teams see insights clearly, compare results quickly, and make decisions confidently.
This guide explains everything about the Supermarkets KPI Dashboard in Power BI. You will explore its structure, features, data requirements, benefits, and best practices. You will also understand how this dashboard supports operational excellence, financial performance, and long-term growth.
Click to Purchases Supermarkets KPI Dashboard in Power BI
What Is a Supermarkets KPI Dashboard in Power BI?
A Supermarkets KPI Dashboard in Power BI is a ready-to-use analytics solution that tracks the most important performance indicators across supermarket operations. It shows sales results, customer trends, inventory updates, operational activities, and financial performance in one place. Because it runs in Power BI, users can interact with slicers, charts, KPIs, and tables easily.
The dashboard captures data through an Excel input file. Teams update the actual and target numbers in Excel, and the Power BI model refreshes automatically. This method keeps the dashboard simple to use, flexible for any supermarket size, and scalable for daily, weekly, and monthly reporting.
The dashboard contains three important pages:
-
Summary Page
-
KPI Trend Page
-
KPI Definition Page
Each page gives a unique perspective that helps decision-makers evaluate the business from different angles.
Click to Purchases Supermarkets KPI Dashboard in Power BI
Why Do Supermarkets Need a KPI Dashboard?
Supermarkets manage thousands of products, hundreds of transactions, and many operational processes every day. Therefore, teams need real-time clarity, fast analysis, and reliable data.
A KPI dashboard brings all important metrics into a single view.
It does the following:
-
Increases visibility
-
Reduces manual reporting time
-
Highlights risks before they grow
-
Supports data-driven decision-making
-
Improves accountability across departments
With a Supermarkets KPI Dashboard in Power BI, leaders track MTD, YTD, PY, and target comparisons in seconds. As a result, they improve performance, reduce costs, and increase customer satisfaction.
Click to Purchases Supermarkets KPI Dashboard in Power BI
Key Features of the Supermarkets KPI Dashboard in Power BI
Your already written content explains the structure well. Below is an enhanced, optimized, and detailed version of all features with smooth transitions for readability.
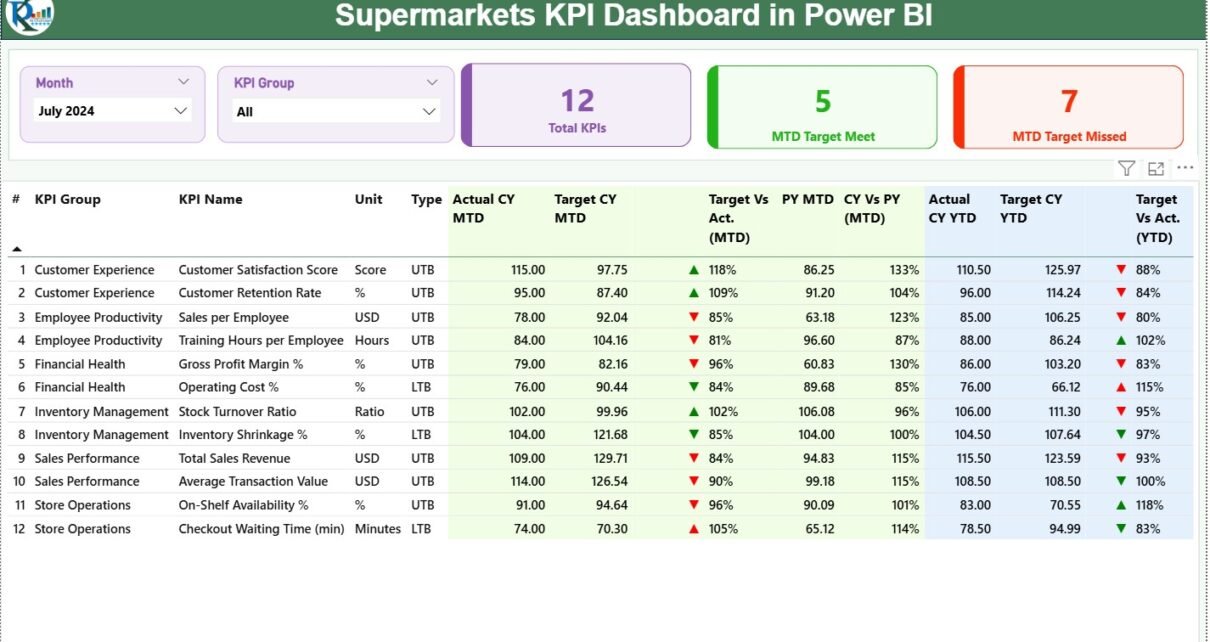
1. Summary Page of the Supermarkets KPI Dashboard in Power BI
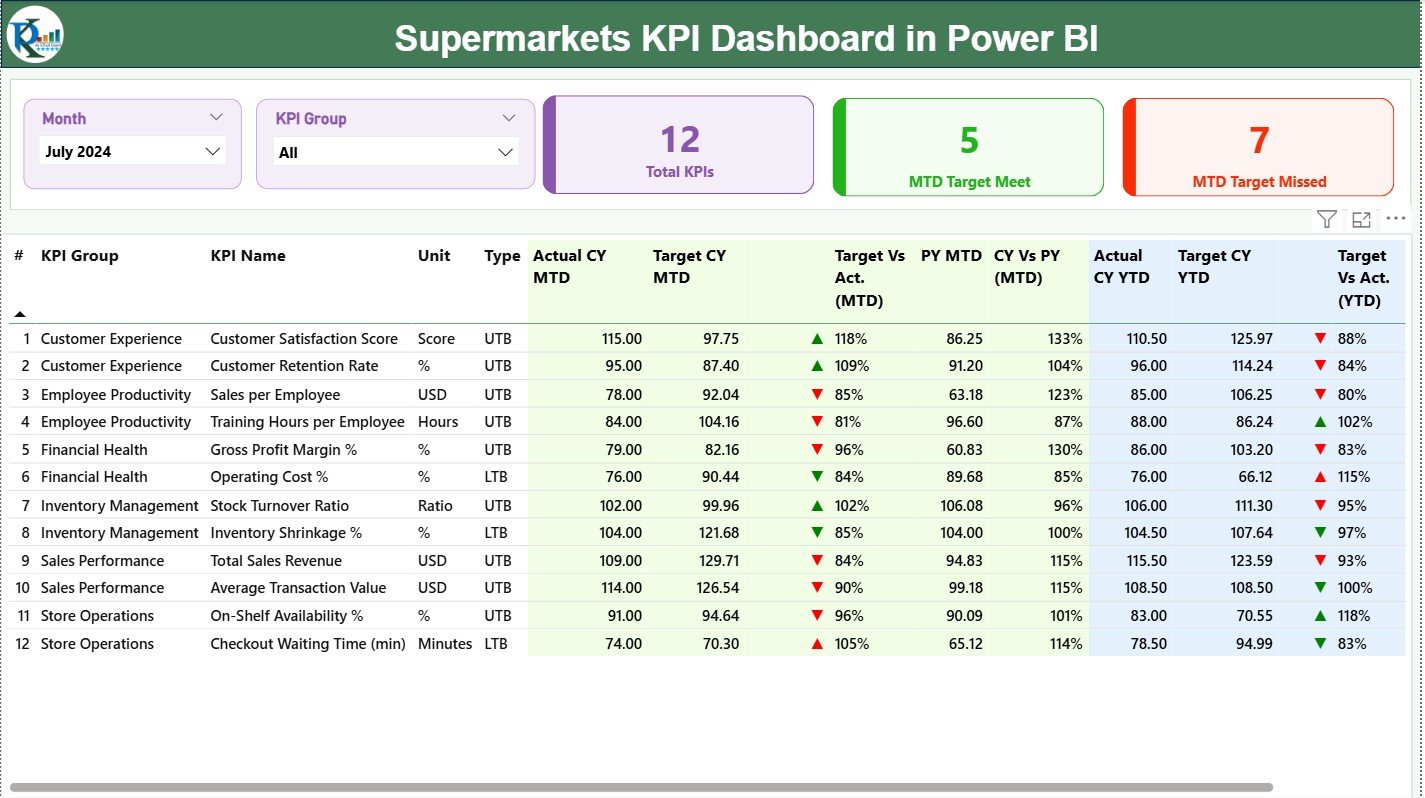
The Summary Page is the main page of the dashboard. Users start their analysis here because it shows all key supermarket metrics in one place. Since this page includes slicers, cards, and a detailed table, it becomes the central control panel for business insights.
Slicers on the Top
The page includes two slicers:
-
Month Slicer
-
KPI Group Slicer
Because these slicers filter the entire page, teams explore performance trends quickly. Users select a month or KPI group and see instant results.
KPI Cards
Three cards appear at the top to display:
-
Total KPIs Count
-
MTD Target Met Count
-
MTD Target Missed Count
These cards help users understand the overall status immediately. Since the cards use red and green indicators, users notice problem areas directly.
Detailed KPI Table
Below the cards, a complete KPI table helps users study every metric. The table includes the following fields:
-
KPI Number: Sequence number of the KPI
-
KPI Group: Category of the KPIs
-
KPI Name: KPI title
-
Unit: Unit of measurement
-
Type: LTB (Lower the Better) or UTB (Upper the Better)
-
Actual CY MTD: Current Year MTD actual numbers
-
Target CY MTD: Current Year MTD targets
-
MTD Icon: ▲ or ▼ indicating if the KPI meets or misses the target
-
Target vs Actual (MTD): Comparison % using Actual ÷ Target
-
PY MTD: Previous Year MTD values
-
CY vs PY (MTD): Comparison % between CY and PY MTD
-
Actual CY YTD: Current Year YTD actual numbers
-
Target CY YTD: Current Year YTD target numbers
-
YTD Icon: ▲ or ▼ indicating YTD performance
-
Target vs Actual (YTD): Comparison % for YTD
-
PY YTD: Previous Year YTD values
-
CY vs PY (YTD): Comparison % between CY and PY YTD
Because the table uses icons, colors, percentages, and values together, users understand performance without reading long explanations.
2. KPI Trend Page 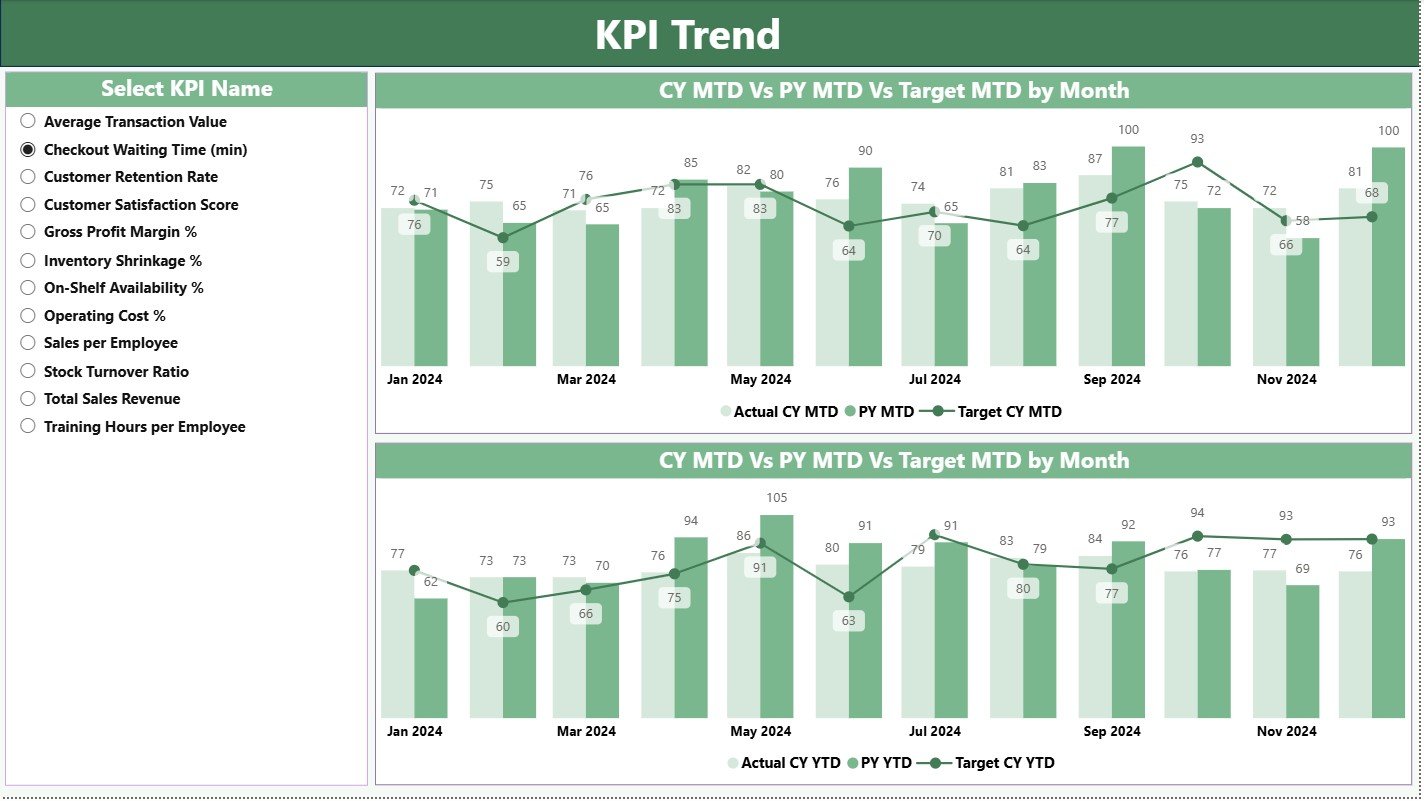
KPI Trend Page
The KPI Trend Page focuses on visualization. It helps users track performance movement over time. Teams select a KPI from the slicer and explore monthly trends, yearly progress, and target achievement.
This page contains two combo charts:
-
MTD Trend Chart
-
YTD Trend Chart
These charts display:
-
Current Year Actual
-
Previous Year Actual
-
Target Line
As a result, users compare numbers visually. They identify growth, decline, or stability in seconds. This page becomes especially helpful for detailed analysis, performance review meetings, and monthly presentations.
Click to Purchases Supermarkets KPI Dashboard in Power BI
3. KPI Definition Page
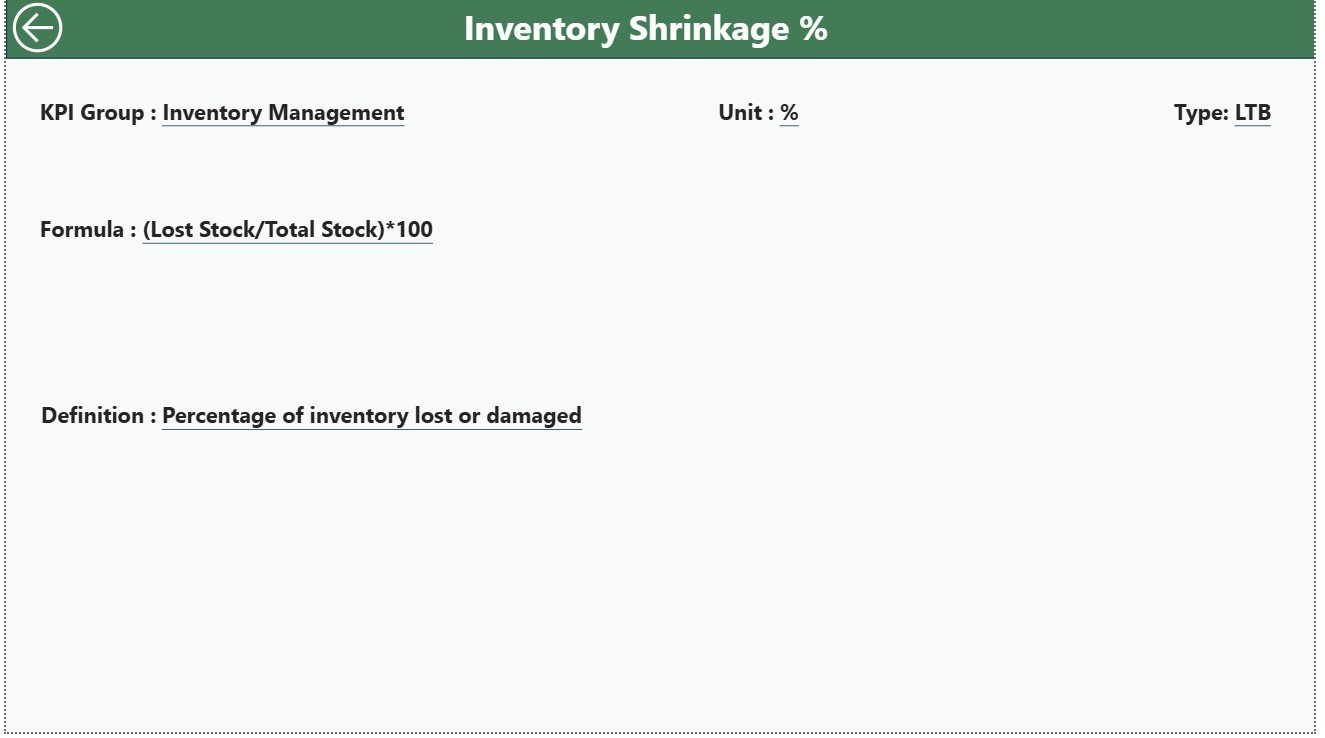
The KPI Definition Page is a drill-through page. It remains hidden from the main view, but users can reach it from the Summary Page by drilling through a KPI.
This page includes:
-
KPI Number
-
KPI Group
-
KPI Name
-
Unit
-
Formula
-
Definition
-
Type (LTB or UTB)
This helps teams understand what each KPI means and how it is calculated. Because supermarket metrics differ across businesses, this page ensures that everyone uses the same definitions and avoids confusion.
The page also includes a Back button that returns users to the Summary Page.
Click to Purchases Supermarkets KPI Dashboard in Power BI
Excel Data Structure for the Dashboard
The dashboard receives data from an Excel file. This file contains three worksheets:
1. Input_Actual Sheet
Users fill the actual numbers here:
-
KPI Name
-
Month (use first date of the month)
-
MTD Actual
-
YTD Actual
Because the file uses clean structured data, Power BI loads the numbers smoothly.
2. Input_Target Sheet
Users enter targets here:
-
KPI Name
-
Month
-
MTD Target
-
YTD Target
Target entry keeps the dashboard aligned with business goals.
3. KPI Definition Sheet
Users define each KPI here:
-
KPI Number
-
KPI Group
-
KPI Name
-
Unit
-
Formula
-
Definition
-
Type
Since the dashboard uses this sheet for definitions and drill-through, teams maintain clarity and accuracy.
Click to Purchases Supermarkets KPI Dashboard in Power BI
Advantages of the Supermarkets KPI Dashboard in Power BI
A supermarket handles multiple operations each day, so a dashboard becomes a powerful decision-making tool. The following advantages highlight why this dashboard is essential.
Better Visibility
The dashboard shows MTD, YTD, and PY comparisons clearly. As a result, managers understand every metric quickly.
Faster Decision-Making
Since Power BI updates all visuals instantly, teams react faster and take corrective actions without delays.
Improved Accountability
The dashboard shows KPI groups and performance icons, so every department understands its responsibilities.
Easy Data Management
Because the dashboard uses Excel as a data source, teams edit values without any complex system.
Enhanced Accuracy
Automatically calculated percentages, icons, and comparisons reduce errors and misinterpretation.
Time Savings
Teams spend less time preparing reports and more time analyzing insights.
Clear Target Tracking
MTD and YTD comparisons show where the team meets or misses targets.
Better Trend Analysis
Combo charts help managers study patterns and avoid future risks.
Click to Purchases Supermarkets KPI Dashboard in Power BI
Best Practices for the Supermarkets KPI Dashboard in Power BI
To get maximum value from the dashboard, teams must follow some best practices.
Use Clean Data
Always fill the Excel file carefully. Keep KPI names consistent. Avoid empty rows and ensure correct dates.
Refresh the Dashboard Regularly
Refresh the model daily, weekly, or monthly based on business needs. Regular updates keep insights accurate.
Define KPIs Clearly
Use the KPI Definition sheet to explain KPIs, formulas, and units. This ensures clarity for all users.
Monitor Icons Carefully
Red ▼ icons signal risk. Act on them early to avoid bigger issues.
Add Comments in Data Sheets
Use short remarks in Excel for unusual events. This helps analysts understand sudden spikes or drops.
Review Trends Frequently
Study combo charts before planning promotions, pricing, or procurement.
Control Access
Allow editing only for authorized team members. This prevents accidental data mistakes.
Set Realistic Targets
Use past performance and industry benchmarks to set achievable MTD and YTD targets.
How This Dashboard Supports Supermarket Operations
Supermarket management teams depend on accurate and real-time insights. The dashboard helps them improve operations in the following ways:
-
Tracks sales movement
-
Monitors customer behavior
-
Evaluates stock availability
-
Controls wastage levels
-
Supports vendor performance review
-
Improves financial planning
-
Helps during annual budgeting
-
Reduces reporting workload
Because Power BI transforms raw data into meaningful visuals, supermarkets gain a strong competitive advantage.
How the Dashboard Helps Teams Make Data-Driven Decisions
Teams in supermarkets use the dashboard daily. Department heads, store managers, analysts, and finance teams benefit in different ways.
Store Managers
Monitor daily and monthly KPIs quickly.
Sales Teams
Track revenue progress, category performance, and customer trends.
Procurement Teams
Compare targets vs actual for stock KPIs.
Finance Teams
Review margins, costs, and YTD results.
Operations Teams
Ensure process efficiency and service quality.
Because the dashboard supports all teams, it becomes a complete supermarket performance management system.
Conclusion
A Supermarkets KPI Dashboard in Power BI helps supermarket leaders understand trends, measure performance, and improve productivity. Since it brings all KPIs into one interactive dashboard, it reduces reporting effort and increases clarity. Teams identify issues early, compare results quickly, and take decisions confidently. With clear target tracking, real-time charts, and a structured data entry system, this dashboard becomes a powerful tool for any supermarket that wants to grow and stay competitive.
Click to Purchases Supermarkets KPI Dashboard in Power BI
Frequently Asked Questions (FAQs)
1. What is a Supermarkets KPI Dashboard in Power BI?
It is a ready-to-use dashboard that tracks key supermarket metrics like sales, costs, customer trends, and operational activities. It uses Excel data and Power BI visuals.
2. Who can use this dashboard?
Store managers, department heads, supervisors, analysts, and business owners use it to monitor performance and make decisions.
3. Do I need technical skills to use this dashboard?
No. You only update Excel sheets. Power BI refreshes everything automatically.
4. What data do I need to maintain?
You maintain actual numbers, target numbers, and KPI definitions in three Excel sheets.
5. Can I add more KPIs?
Yes. Add them in the KPI Definition sheet and update actual and target sheets accordingly.
6. Does the dashboard support MTD and YTD insights?
Yes. It shows MTD, YTD, and PY comparisons for all KPIs.
7. Can I customize this dashboard?
Yes. You can add visuals, modify KPIs, or enhance layout based on your supermarket’s needs.
8. Why is Power BI useful for supermarkets?
It visualizes data clearly, updates results instantly, and reduces manual reporting.
Click to Purchases Supermarkets KPI Dashboard in Power BI
Visit our YouTube channel to learn step-by-step video tutorials