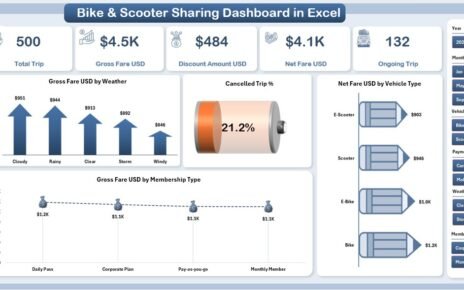
Urban mobility changes every day, and people look for faster, cleaner, and more flexible travel options. Because of this, bike
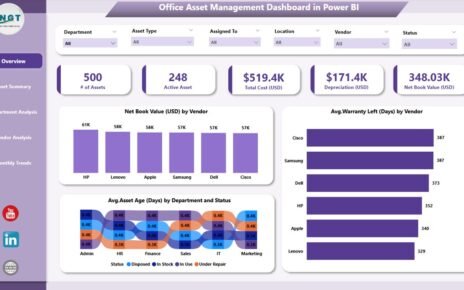
In today's fast-paced business environment, managing office assets effectively is crucial for optimizing resource utilization and minimizing operational costs. The
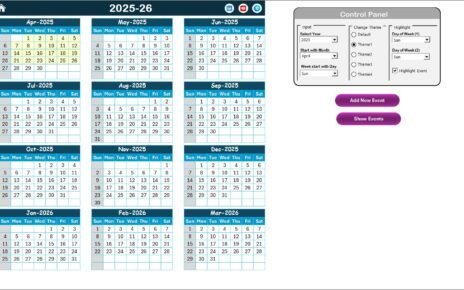
Managing holidays, plant shutdowns, maintenance days, and special manufacturing events often becomes challenging. However, when teams rely on scattered notes