Managing fisheries involves continuous monitoring of fleet performance, fishing methods, crew efficiency, seasonal conditions, and financial outcomes. When this information spreads across multiple spreadsheets, managers struggle to make quick decisions. A Fisheries Dashboard in Excel solves this challenge. It brings all data into one powerful reporting system that shows performance, cost, revenue, and operational trends in a clear and interactive way.
In this article, you will learn everything about the Fisheries Dashboard in Excel, including its structure, features, benefits, advantages, best practices, and FAQs. This guide will help fishing companies, marine analysts, and operations teams understand how this dashboard supports smarter planning and better decision-making.
Click to Purchases Fisheries Dashboard in Excel
What Is a Fisheries Dashboard in Excel?
A Fisheries Dashboard in Excel is an easy-to-use reporting tool that tracks all operational, financial, and performance metrics of fisheries. It converts raw data into interactive charts, slicers, cards, and summaries so team members can monitor fishing performance without checking multiple reports.
The dashboard works as a centralized control panel. Fleet managers can analyze profit margins, crew costs, fuel usage, maintenance costs, on-time log compliance, and revenue patterns by species category, season, or fishing method. With one quick look, the management team gets complete clarity on what works well and what needs improvement.
Because the dashboard runs in Microsoft Excel, users do not need advanced technical skills. The layout is simple, fast, and visually easy to understand.
Key Features of the Fisheries Dashboard in Excel
The Fisheries Dashboard includes a structured set of five analytical pages. A Page Navigator on the left side allows quick movement from one page to another. This makes the dashboard user-friendly and smooth for daily reporting.
Let us explore each page in detail.
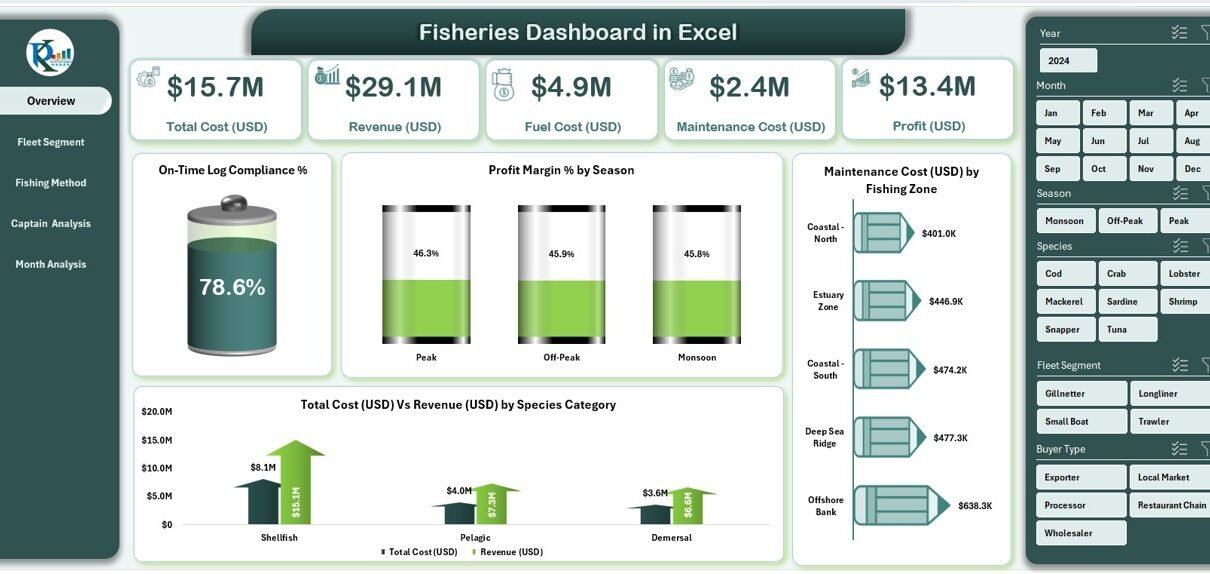
1. Overview Page – What Does It Show?
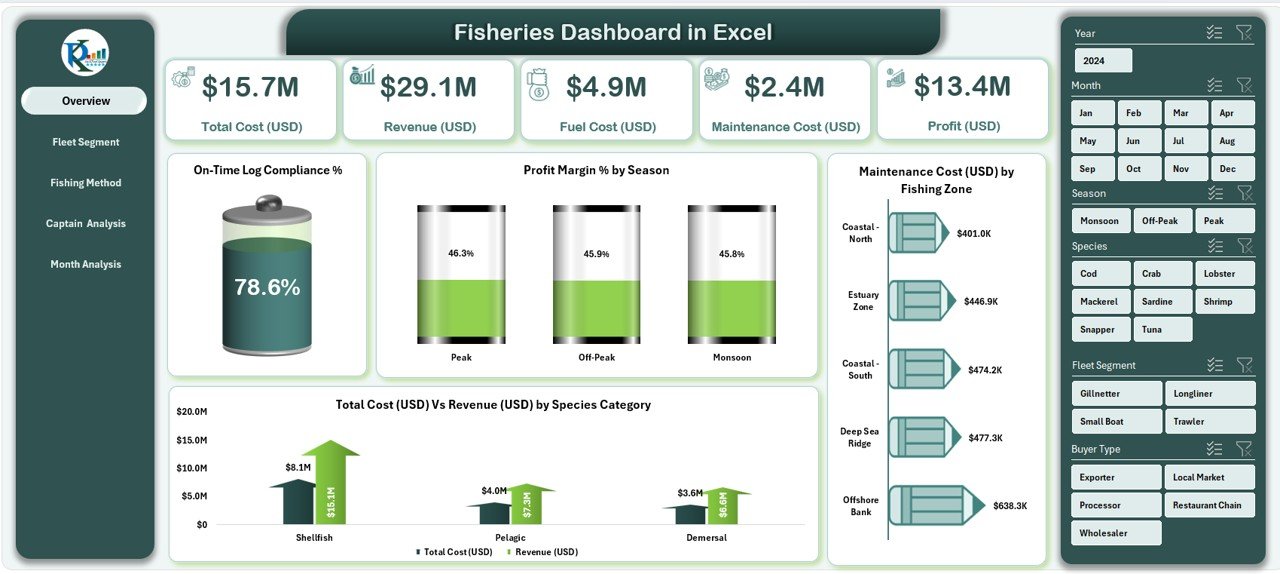
The Overview Page works as the main entry point of the dashboard. It displays global insights that give a snapshot of fisheries operations.
What You See on This Page:
-
On-Time Log Compliance %
Shows how efficiently logs get recorded and submitted on time. -
Profit Margin % by Season
Helps identify which seasons perform better. -
Maintenance Cost (USD) by Fishing Zone
Displays zone-wise maintenance patterns. -
Total Cost (USD) vs Revenue (USD) by Species Category
Helps compare cost and revenue across different categories.
Why It Matters
Managers get a quick overview of financial, seasonal, and operational performance, helping them take timely action.
2. Fleet Segment Analysis – What Insights Does It Provide?
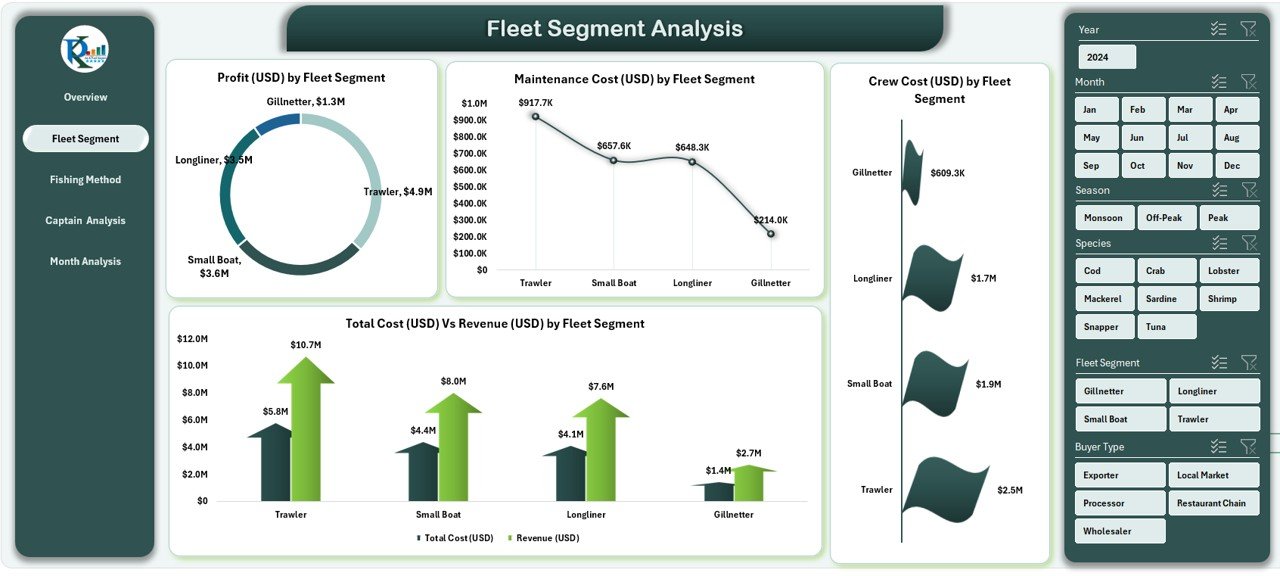
This page breaks down revenue, cost, and profit by every fleet segment.
Charts Included:
-
Profit (USD) by Fleet Segment
-
Maintenance Cost (USD) by Fleet Segment
-
Total Cost (USD) vs Revenue (USD) by Fleet Segment
-
Crew Cost (USD) by Fleet Segment
How It Helps
Users can track which fleet segment brings the highest profit, which fleet incurs most cost, and how crew expenses vary across segments.
This makes budgeting and resource allocation more efficient.
3. Fishing Method Analysis – Why Is It Important?
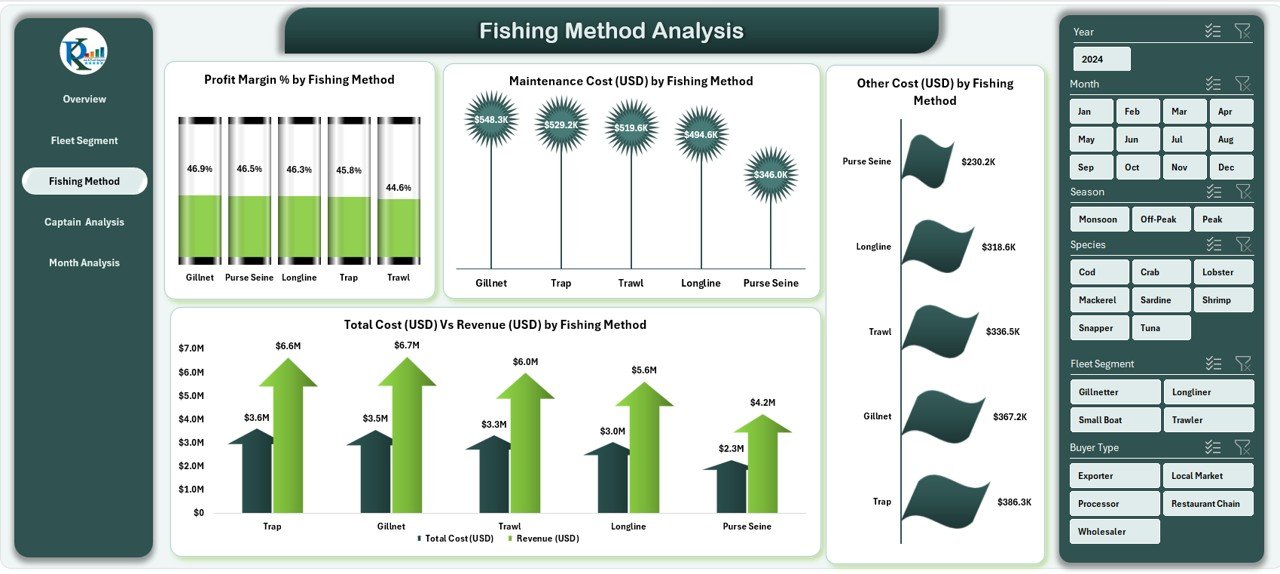
Every fishing method gives different cost and revenue outcomes. This page helps identify methods that deliver better performance.
Charts Included:
-
Profit Margin % by Fishing Method
-
Maintenance Cost (USD) by Fishing Method
-
Total Cost (USD) vs Revenue (USD) by Fishing Method
-
Other Cost (USD) by Fishing Method
What You Learn
This analysis supports decision-making on which methods to encourage, adjust, or optimize based on cost-benefit outcomes.
Click to Purchases Fisheries Dashboard in Excel
4. Captain Analysis – What Trends Can You Track?
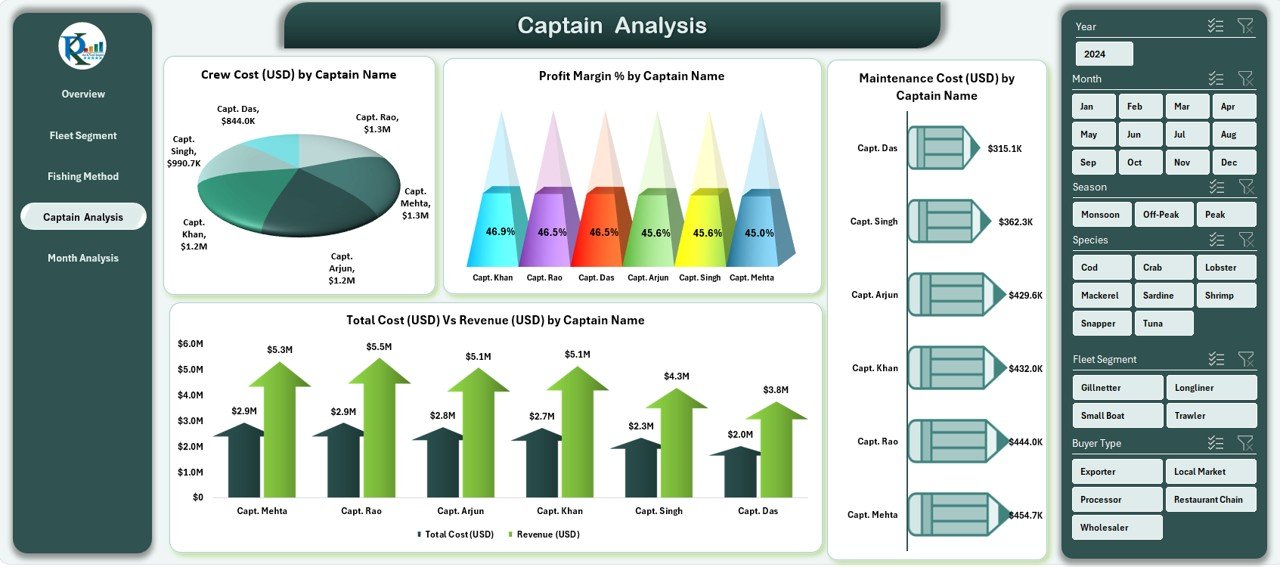
Captains play a key role in the performance of fishing fleets. This section helps evaluate their overall contribution.
Charts Included:
-
Profit Margin % by Captain Name
-
Maintenance Cost (USD) by Captain Name
-
Total Cost (USD) vs Revenue (USD) by Captain Name
-
Crew Cost (USD) by Captain Name
Why It Matters
It helps identify:
-
Which captains manage operations efficiently
-
Who delivers higher profit performance
-
Where additional training or support may be needed
5. Month Analysis – What Does It Show?
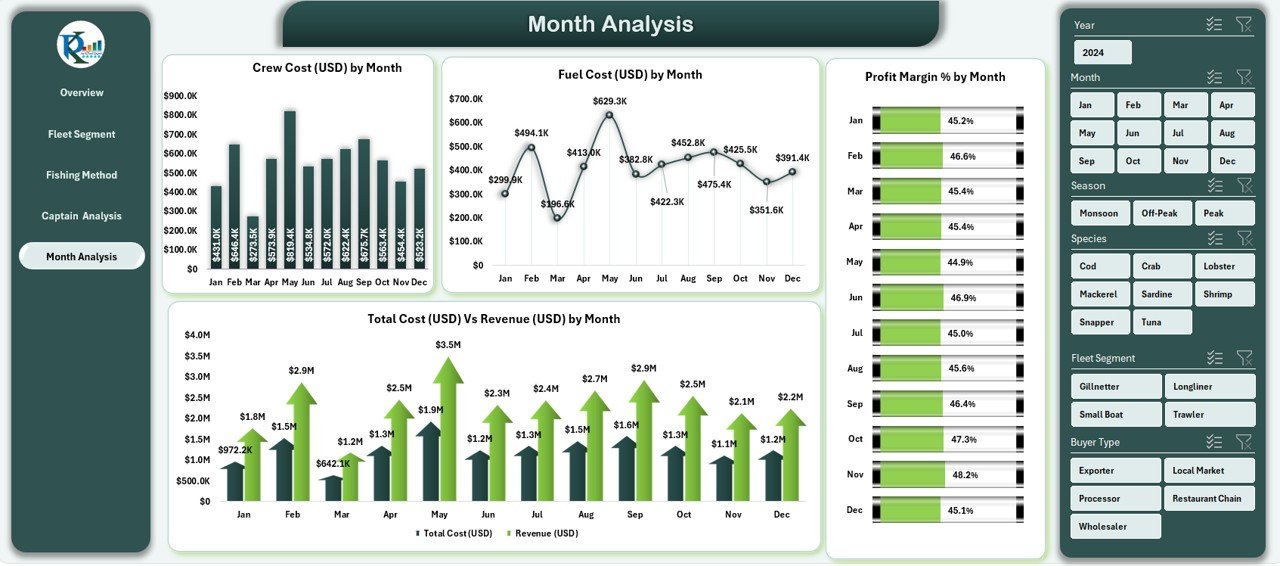
Monthly trends help understand seasonal and operational patterns. This page shows month-wise cost and revenue cycles.
Charts Included:
-
Profit Margin % by Month
-
Total Cost (USD) vs Revenue (USD) by Month
-
Crew Cost (USD) by Month
-
Fuel Cost (USD) by Month
How It Helps
Teams can quickly track:
-
High-cost months
-
High-revenue months
-
Fuel consumption patterns
-
Seasonal variations
This helps optimize planning and forecasting.
Why Should You Use a Fisheries Dashboard in Excel?
Because it simplifies reporting, reduces manual work, and improves decision-making.
Here are the main reasons to use this dashboard:
✔ Real-time insights into cost and revenue
You can track expenses, fuel cost, maintenance charges, and revenue instantly.
✔ Better fleet management
Monitor fleet segments and ensure each segment meets the performance goals.
✔ Improved captain performance monitoring
Helps evaluate productivity and decision-making of each captain.
✔ Season-wise performance tracking
Identify profitable seasons and those that need strategic adjustments.
✔ Reduced errors due to automated calculations
The dashboard removes repetitive calculations and reduces mistakes.
✔ Easy to share and use
Excel dashboards open on any computer without complex software.
Advantages of a Fisheries Dashboard in Excel
1. Easy to Use
The dashboard uses simple Excel formulas, charts, and slicers. Anyone can use it without advanced training.
2. Helps Compare Performance
Click to Purchases Fisheries Dashboard in Excel
Users can compare segments, captains, fishing methods, zones, and months with one click.
3. Saves Time
You do not need to merge multiple reports. All insights appear in one place.
4. Improves Accuracy
Automated calculations ensure correct and consistent reporting.
5. Supports Strategic Planning
Managers can track trends across seasons, fishing methods, and fleet segments to make stronger decisions.
6. Offers Visual Insights
The dashboard uses charts that help visualize data better than manual tables.
7. Works Without Extra Tools
You only need Microsoft Excel. No plugins or additional software required.
Best Practices for Using the Fisheries Dashboard in Excel
Follow these best practices to get the best performance from your dashboard:
1. Update the Data Sheet Regularly
Keep the data sheet updated with accurate and recent information to maintain correct results.
2. Use Clean and Structured Data
Avoid merging cells or using inconsistent formats. Clean data ensures accurate insights.
3. Refresh All Calculations
After updating data, refresh pivot tables and charts to see the latest numbers.
4. Review Fleet Segment Trends Monthly
Track performance every month to adjust fleet usage and resource allocation.
5. Monitor Fuel and Maintenance Costs Closely
These two areas influence profit margins significantly.
6. Use Slicers for Quick Comparisons
Switch between seasons, species, fishing methods, and months to analyze deeper insights.
7. Keep Backup Copies of Data
Store backup files to avoid data loss and maintain historical records.
8. Conduct Monthly Review Meetings
Use the dashboard during management meetings to review revenue, profit, and performance trends.
How Does the Fisheries Dashboard Support Better Decision-Making?
The dashboard helps teams make profitable and efficient decisions. It shows real-time patterns in cost, revenue, fuel usage, crew performance, and fleet efficiency.
Managers can:
-
Adjust fishing schedules based on performance
-
Reduce operational costs
-
Optimize fleet assignments
-
Identify profitable species categories
-
Improve captain-level performance
-
Forecast seasonal trends
These insights help improve productivity, reduce expenses, and increase profits.
Conclusion
A Fisheries Dashboard in Excel acts as a complete reporting tool for managing fishing operations. It brings together cost, revenue, fleet performance, seasonal patterns, captain insights, and fishing method analysis in one interactive file.
With its clean layout, easy navigation, and powerful visual charts, the dashboard helps fisheries make faster and smarter decisions. When teams use it regularly, they gain better control over expenses, boost profitability, and ensure consistent performance.
If you manage fisheries or marine operations, this dashboard becomes an essential tool for accurate reporting and advanced planning.
Frequently Asked Questions (FAQs)
1. What is a Fisheries Dashboard in Excel?
It is an Excel-based reporting system that tracks fleet performance, cost, revenue, fishing methods, and seasonal trends using charts and slicers.
2. Who can use this dashboard?
Fisheries managers, marine analysts, captains, accounting teams, and logistics coordinators can use it.
3. Can beginners use this dashboard?
Yes. The dashboard uses simple Excel features that anyone can understand.
4. How often should I update the data sheet?
Update it daily or weekly depending on your fishing operations.
5. Does it require advanced Excel skills?
No. Basic Excel knowledge is enough.
6. Can it track cost and revenue trends?
Yes. It shows cost vs revenue by fleet segment, species, month, and fishing method.
7. Does the dashboard help compare captains?
Yes. The Captain Analysis page shows profit margin, crew cost, and maintenance cost for each captain.
8. What pages does the dashboard include?
Overview, Fleet Segment Analysis, Fishing Method Analysis, Captain Analysis, and Month Analysis.
Visit our YouTube channel to learn step-by-step video tutorials
Click to Purchases Fisheries Dashboard in Excel