Digital media agencies handle hundreds of tasks every day—from planning ad campaigns to tracking budgets, monitoring client performance, managing service-wise profits, and analyzing monthly trends. Because of this wide workload, agencies often struggle with scattered data across spreadsheets, emails, and multiple reporting tools. When managers do not get timely insights, they cannot make fast decisions. However, a Digital Media Agencies Dashboard in Power BI solves all these problems with clarity.
This dashboard brings every important KPI into one place. It shows your campaigns, services, budgets, spends, revenues, sentiments, profit margins, and client industries in clean visual formats. It also helps you move from guesswork to real-time data insights. In this detailed article, I will explain everything about this dashboard, how each page works, why every digital agency needs it, and how your team can benefit from its simple navigation and powerful analytics.
Click to Purchases Digital Media Agencies Dashboard in Power BI
What Is a Digital Media Agencies Dashboard in Power BI?
A Digital Media Agencies Dashboard in Power BI is a ready-to-use performance monitoring tool built for digital marketing agencies, media planners, account managers, and decision-makers. It shows every KPI related to campaigns, services, clients, budgets, spends, revenues, and trends in one place. The dashboard connects with a structured Excel file, so your data updates automatically.
Teams can easily track:
-
How campaigns perform
-
Which services generate maximum revenue
-
Which client industry delivers high profit
-
How budgets compare with spends
-
How month-wise performance changes
Because of these simple yet powerful insights, agencies make better strategic decisions.
Why Do Digital Media Agencies Need a Power BI Dashboard?
Digital media agencies deal with fast-moving tasks. New campaigns launch every week. Budgets change every month. Client expectations rise every day. When teams rely on manual reports, mistakes happen and decisions slow down.
A Power BI dashboard solves this by giving:
-
Real-time data visibility
-
Quick comparison between planned vs. actual performance
-
Clear understanding of ROI
-
Fast identification of profitable areas
-
Better control over budgets and spending patterns
As a result, managers act faster and improve planning.
Key Features of the Digital Media Agencies Dashboard in Power BI
This dashboard includes 5 powerful pages, each focused on a different area of agency performance. Together, they give a full view of operations.
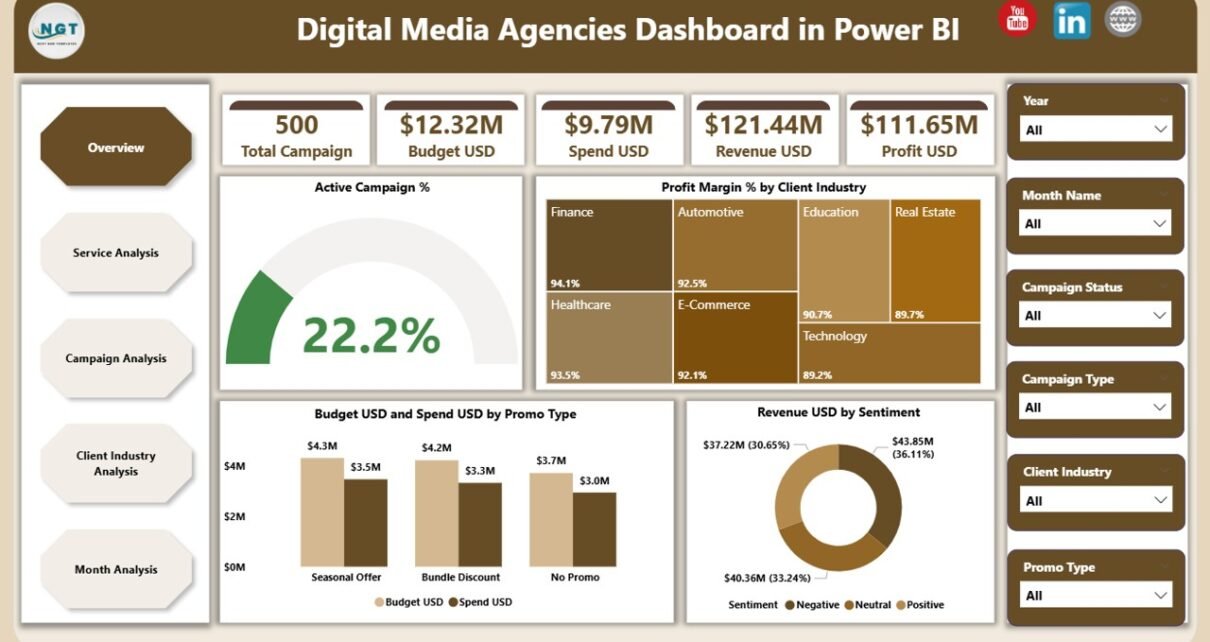
1. Overview Page – Complete Snapshot of the Agency
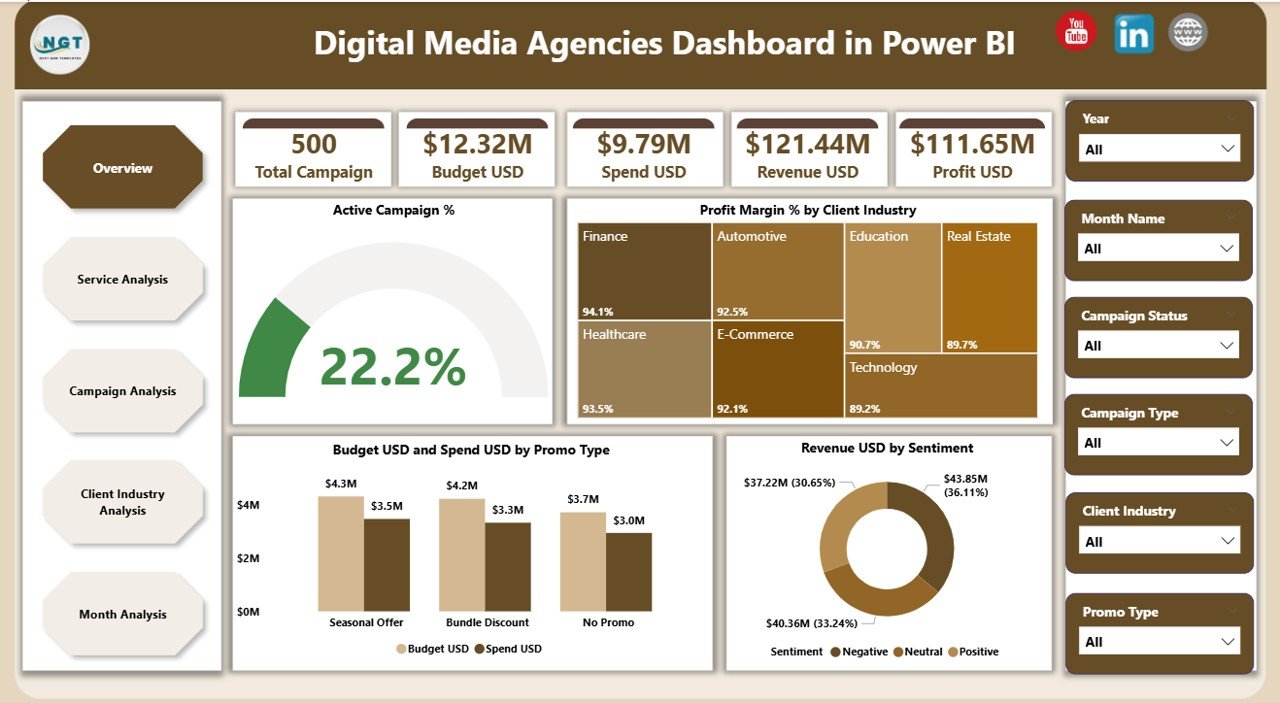
The Overview Page acts as the main screen of the dashboard. It gives an immediate snapshot of all key KPIs so users understand the overall agency performance in seconds.
Click to Purchases Digital Media Agencies Dashboard in Power BI
You get:
-
4 KPI cards showing high-level metrics
-
4 visually clear charts
The charts include:
-
Active Campaign %
-
Profit Margin % by Client Industry
-
Budget USD vs Spend USD by Promo Type
-
Revenue USD by Sentiment
This page helps leaders understand:
-
Are campaigns active and healthy?
-
Which client industries bring the most profit?
-
How marketing spends compare with budgets?
-
What customer sentiment looks like across promotions?
The simplicity of this page allows anyone to read the data without training. You get both at-a-glance insights and detailed clarity.
2. Service Analysis – Performance of Each Service Type
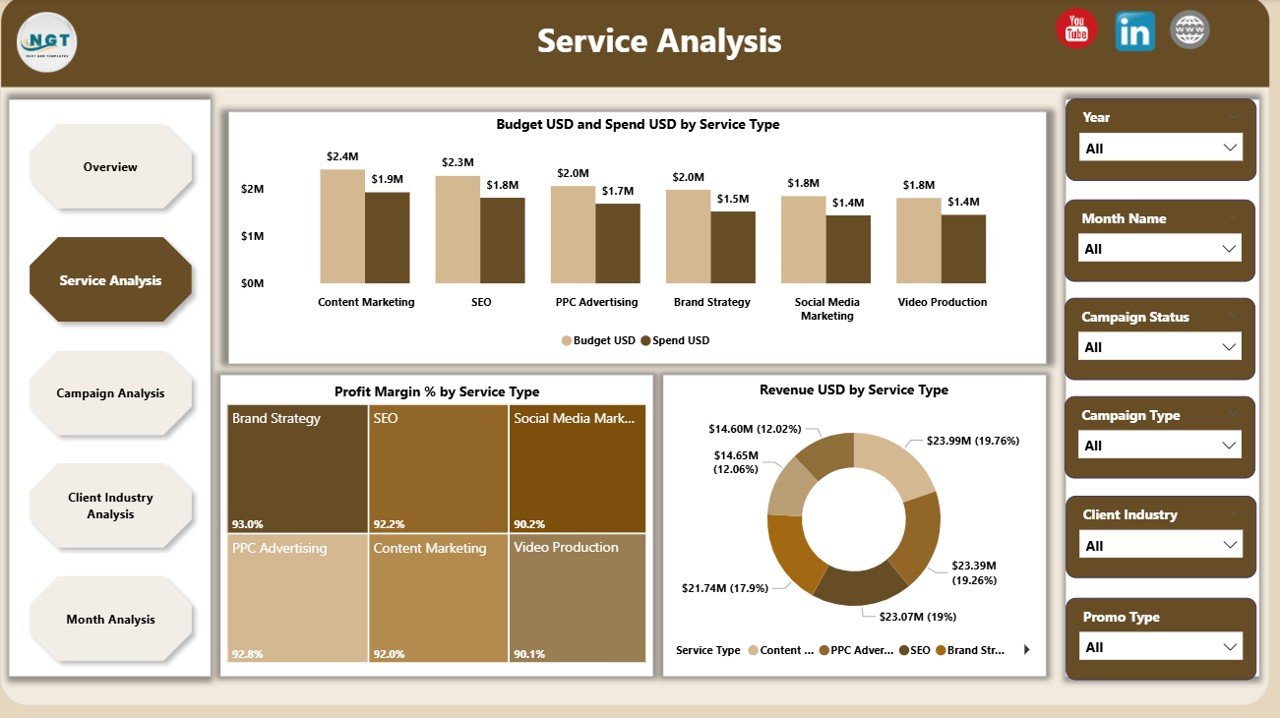
The Service Analysis Page helps agencies understand how each service performs financially. It focuses on service-specific trends so teams know where to invest more.
It includes 3 detailed charts:
-
Budget USD vs Spend USD by Service Type
-
Profit Margin % by Service Type
-
Revenue USD by Service Type
With these visuals, you get answers to questions like:
-
Which service consumes more budget?
-
Which service generates high revenue?
-
Which service type maintains healthy profit margins?
-
Which areas need improvement?
This page helps managers realign resources, adjust pricing, and optimize service offerings.
3. Campaign Analysis – Deep Dive into Campaign Performance
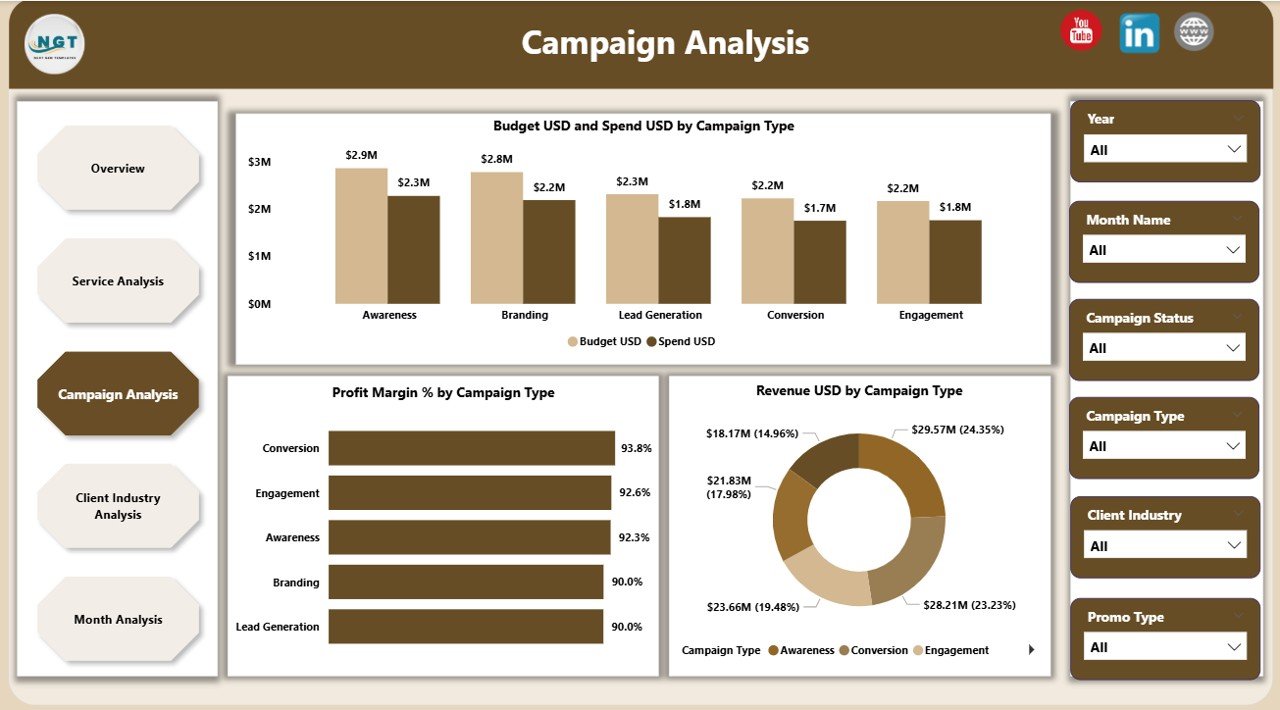
Campaigns drive digital marketing agencies. Because of this, the Campaign Analysis Page focuses on campaign-wise performance metrics.
It includes 3 important charts:
-
Budget USD vs Spend USD by Campaign Type
-
Profit Margin % by Campaign Type
-
Revenue USD by Campaign Type
Teams get clear answers such as:
-
Which campaign type performs better?
-
Which campaign brings strong ROI?
-
Where does the agency overspend?
-
Which campaign category needs strategy improvement?
This page helps account managers refine campaign planning and maximize returns.
Click to Purchases Digital Media Agencies Dashboard in Power BI
4. Client Industry Analysis – Profitability by Industry
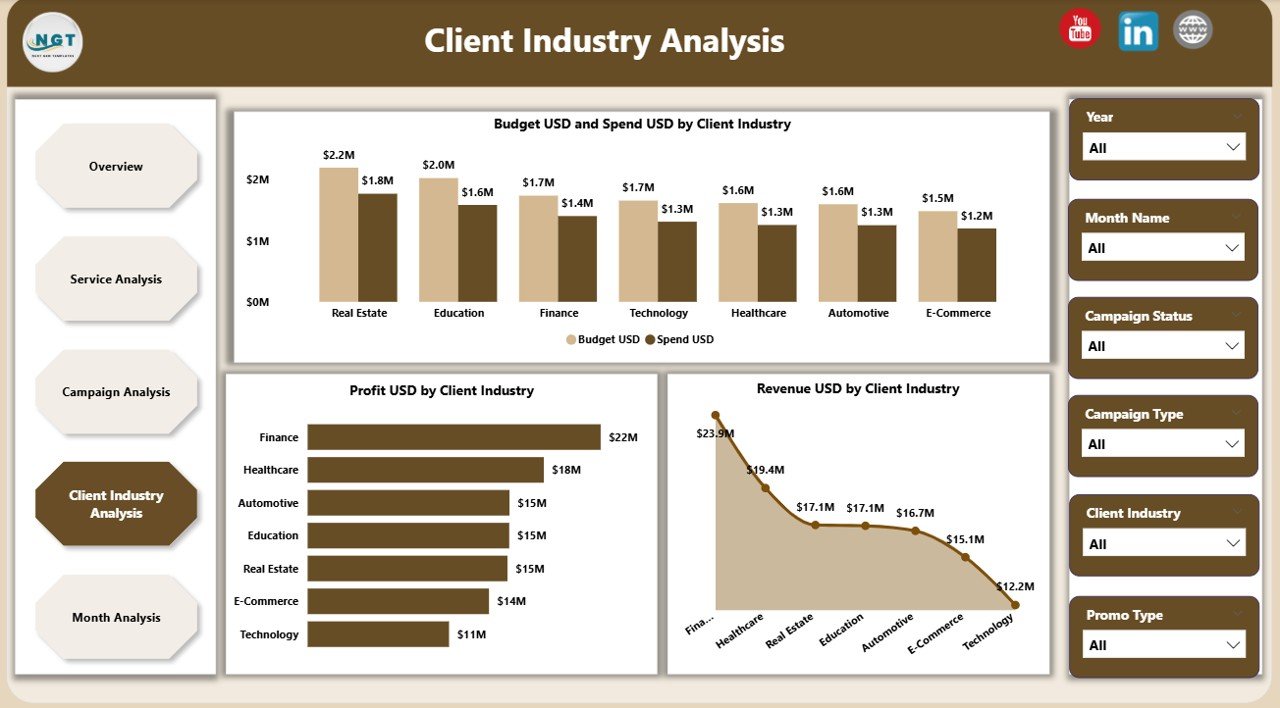
Every agency works with clients from different industries. However, not all industries give the same revenue or profit margin. This page focuses entirely on Client Industry Analysis.
It includes 3 visual charts:
-
Budget USD vs Spend USD by Client Industry
-
Profit USD by Client Industry
-
Revenue USD by Client Industry
This helps you understand:
-
Which industry brings the highest revenue?
-
Where the agency spends more than expected?
-
Which client segment offers strong profit margins?
-
Which industries need new strategies or revised pricing?
When agencies know the best-performing industries, they can focus their energy on profitable segments.
5. Monthly Trends – Performance Across the Year
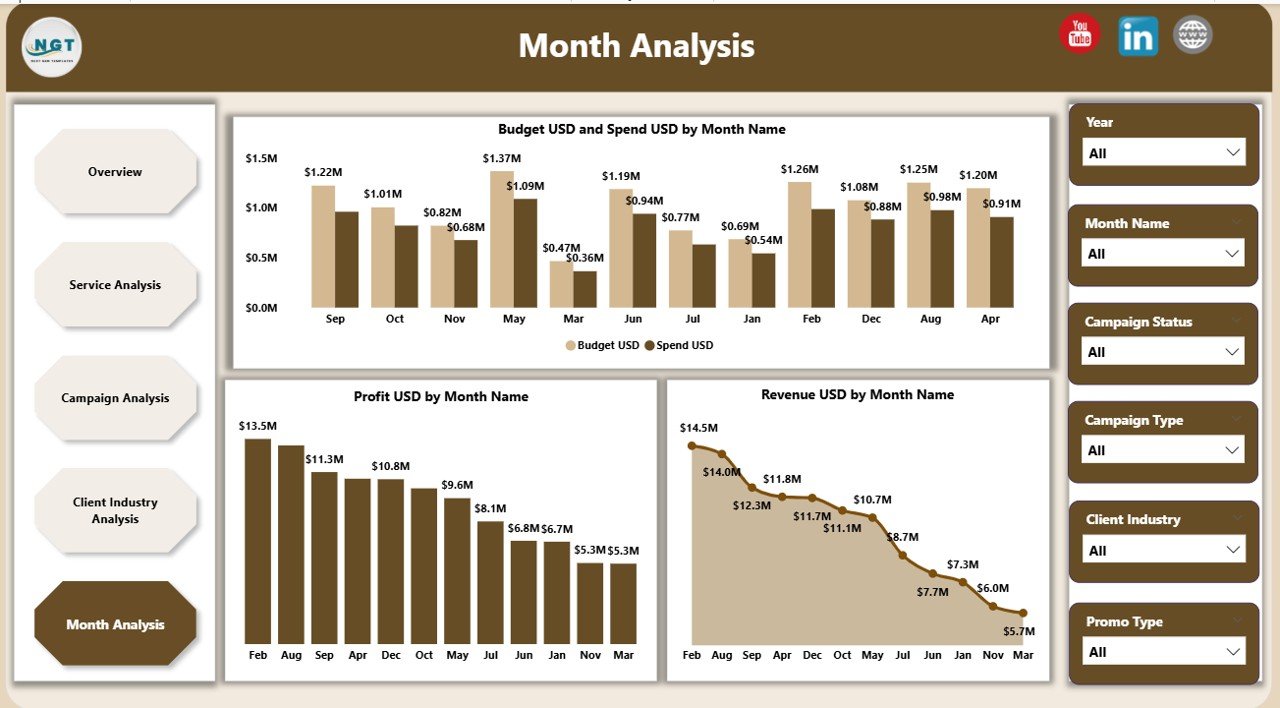
The Monthly Trends Page shows how your agency performs every month. Trend analysis is important because it helps teams plan budgets, adjust strategies, and predict future performance.
This page includes:
-
Budget USD vs Spend USD by Month
-
Profit USD by Month
-
Revenue USD by Month
With this, agencies understand:
-
Which months perform well
-
When spends rise above budgets
-
How profit fluctuates
-
When to increase campaign planning
-
Seasonal peaks and drops
Trend analysis makes future planning smooth and accurate.
Advantages of the Digital Media Agencies Dashboard in Power BI
A dashboard is not just a reporting tool. It is a growth accelerator. Here are the major advantages:
1. Real-time Insights for Fast Decisions
Managers no longer wait for weekly or monthly reports. They get real-time metrics.
2. Clear View of Campaign and Service Performance
Teams understand what works and what needs improvement.
3. Better Budget and Spend Tracking
The dashboard shows whether the agency is using the budget effectively.
4. Higher Accuracy in Profitability Analysis
Profit margins and revenues appear clearly by campaign, service, and industry.
5. Improved Client Reporting
Agencies can share transparent data-backed performance reports with clients.
6. Time-saving Automation
Once the Excel file updates, the entire dashboard refreshes automatically.
7. Enhanced Team Collaboration
Everyone works with the same accurate data, reducing confusion.
Best Practices for Using the Digital Media Agencies Dashboard in Power BI
Follow these best practices to get the best output from this dashboard:
1. Keep the Data Updated
Refresh the Excel file daily or weekly to get accurate insights.
2. Review Campaign Trends Regularly
Check how campaigns perform to avoid last-minute overspending.
3. Monitor Profit Margins by Service and Industry
Identify which areas bring maximum profit and focus more on them.
4. Compare Budgets and Actual Spends Frequently
This prevents financial leakages and improves planning.
5. Use Filters Smartly
Use slicers for months, industries, campaign types, and service types to understand deeper insights.
6. Share Reports with Teams
Help your sales, operations, and campaign managers stay aligned.
7. Analyze Monthly Trends for Forecasting
Plan future goals based on historical performance and seasonality.
How Does This Dashboard Improve Agency Productivity?
This dashboard removes manual work and gives a single source of truth for all teams. Managers save time, employees work smarter, and decision-making becomes faster.
It helps:
-
Campaign teams track performance
-
Finance teams monitor budgets and profits
-
Client managers prepare quick reports
-
Senior management plan future strategies
Productivity rises because the dashboard gives complete clarity.
Conclusion
A Digital Media Agencies Dashboard in Power BI is one of the most effective tools for modern digital agencies. It brings every KPI—budgets, spends, profits, revenues, services, campaigns, client industries, and trends—into a single interactive platform. Because of this, agencies gain control over their performance, plan smarter, and improve results faster.
Digital agencies that use data grow faster than agencies that rely on assumptions. This dashboard helps you join the group of high-performing, data-driven marketing teams.
Frequently Asked Questions (FAQs)
Click to Purchases Digital Media Agencies Dashboard in Power BI
1. What is a Digital Media Agencies Dashboard in Power BI?
It is a performance monitoring tool that shows campaign, service, budget, spend, and revenue insights in simple Power BI visuals.
2. Who should use this dashboard?
Digital marketing agencies, media planners, managers, analysts, and client account teams can use it.
3. How does the dashboard update?
It connects with an Excel file. When the Excel data updates, the dashboard refreshes automatically.
4. Can this dashboard track campaign profitability?
Yes. It shows budget, spend, revenue, and profit margin by campaign type.
5. Why is monthly trend analysis important?
Monthly trends help agencies understand performance patterns and plan future campaigns.
6. Can agencies customize this dashboard?
Yes, you can add new charts, filters, and KPIs based on your requirements.
7. Does it help with client reporting?
Yes. You can share clear data-backed insights with clients, improving trust and transparency.
8. Is the dashboard easy to understand?
Yes. The visuals are simple and easy to read, even for non-technical users.
Visit our YouTube channel to learn step-by-step video tutorials