Managing investments across asset classes, funds, client segments, and time periods demands accuracy, clarity, and speed. However, many asset management companies still rely on scattered spreadsheets, static reports, and manual calculations. As a result, decision-making becomes slow, error-prone, and reactive. That is exactly why an Asset Management Companies Dashboard in Excel plays a critical role in modern financial management.
In this detailed, SEO-friendly guide, you will learn what an Asset Management Companies Dashboard in Excel is, why it matters, how it works, and how each analytical page adds value. Moreover, the article explains key features, advantages, best practices, and real-world use cases. Finally, you will find a detailed Frequently Asked Questions section to clarify common doubts.
Click to Purchases Asset Management Companies Dashboard in Excel
What Is an Asset Management Companies Dashboard in Excel?
An Asset Management Companies Dashboard in Excel is a ready-to-use analytical and reporting tool designed to track, analyze, and visualize financial performance across asset classes, funds, regions, client segments, and time periods.
Instead of reviewing multiple reports separately, this dashboard brings all critical investment and profitability metrics into one structured Excel file. Therefore, asset managers, analysts, and finance teams gain instant visibility into revenue, profit margin, operating cost, risk exposure, and net fund flows.
Because the dashboard runs entirely in Excel, it remains flexible, affordable, and easy to customize. Additionally, it does not require advanced technical skills or expensive BI software.
Why Do Asset Management Companies Need a Dashboard in Excel?
Asset management companies deal with complex data every single day. They track assets under management, profitability, client segments, and market performance simultaneously. However, without a centralized dashboard, teams struggle to identify trends and risks early.
An Asset Management Companies Dashboard in Excel helps because:
-
It consolidates scattered data into one file
-
It reduces manual calculations and reporting errors
-
It improves decision-making speed and accuracy
-
It supports data-driven investment strategies
-
It enhances transparency across teams
As a result, organizations stay proactive rather than reactive.
How Does an Asset Management Companies Dashboard in Excel Work?
The dashboard works by connecting structured data tables with dynamic charts, KPIs, and slicers. First, users update the underlying data. Then, Excel automatically recalculates metrics and refreshes visuals.
Moreover, interactive slicers allow users to filter data by region, asset class, fund type, client segment, or month. Consequently, stakeholders can analyze performance from multiple perspectives without editing formulas.
Key Features of the Asset Management Companies Dashboard in Excel
This ready-to-use dashboard includes several powerful features designed specifically for asset management operations.
Page Navigator for Easy Navigation
A Page Navigator, located on the left side, allows users to move quickly between analytical pages. Instead of scrolling through multiple sheets, users jump directly to the required analysis. Therefore, usability improves significantly.
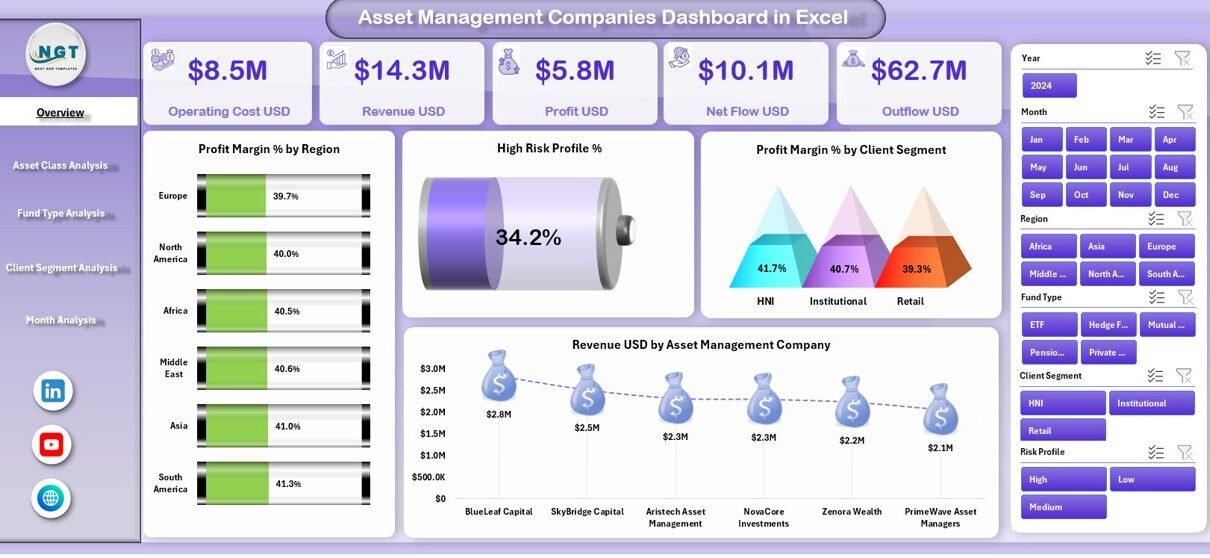
What Does the Overview Page Show?

The Overview Page acts as the control center of the dashboard. It provides a high-level snapshot of overall business performance.
Key KPI Cards on the Overview Page
The Overview Page displays five critical KPI cards that summarize performance instantly. These cards highlight key financial indicators and set the context for deeper analysis.
Charts Available on the Overview Page
Additionally, the page includes four insightful charts:
-
Profit Margin % by Region
This chart highlights profitability differences across geographical regions. As a result, managers quickly identify strong and weak markets. -
High Risk Profit %
This visual shows the share of profit linked to high-risk investments. Therefore, risk-adjusted decision-making becomes easier. -
Profit Margin % by Client Segment
This chart compares profitability across client types, such as retail, institutional, or high-net-worth clients. -
Revenue USD by Asset Management Company
This chart helps benchmark revenue performance across different asset management entities.
Together, these visuals provide instant clarity on overall performance.
How Does Asset Class Analysis Improve Investment Insights?
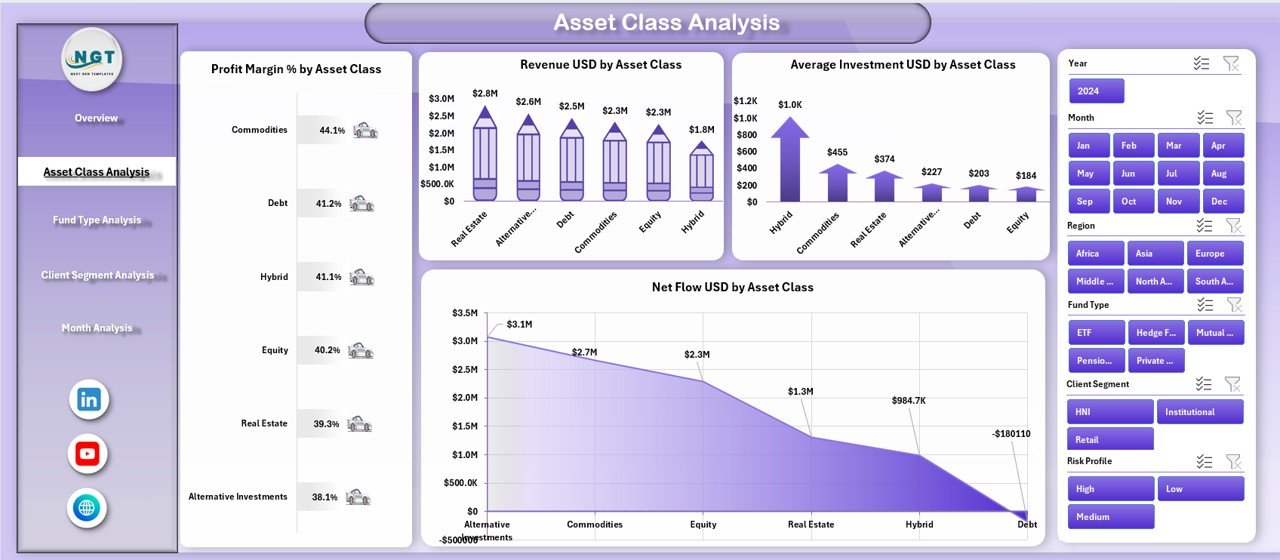
The Asset Class Analysis Page focuses on performance across different asset categories. Because asset allocation drives returns, this page plays a vital role.
Charts Included in Asset Class Analysis
This page includes four detailed charts:
-
Profit Margin % by Asset Class
This chart shows which asset classes generate the highest margins. -
Revenue USD by Asset Class
This visual identifies asset classes that contribute most to total revenue. -
Average Investment USD by Asset Class
This chart reveals how investment amounts vary across asset types. -
Net Flow USD by Asset Class
This metric tracks inflows and outflows, helping managers spot investor sentiment trends.
As a result, portfolio optimization becomes more data-driven.
Click to Purchases Asset Management Companies Dashboard in Excel
Why Is Fund Type Analysis Important?

Different fund types behave differently in terms of risk, return, and investor preference. Therefore, analyzing performance by fund type becomes essential.
Fund Type Analysis Page Explained
The Fund Type Analysis Page provides clarity on fund-level performance through four charts:
-
Average Investment USD by Fund Type
This chart shows where investors allocate the most capital. -
Profit Margin % by Fund Type
This visual compares profitability across fund structures. -
Revenue USD by Fund Type
This chart identifies revenue-generating fund types. -
Profit USD by Fund Type
This metric highlights absolute profit contribution by fund category.
Because of this structured view, fund managers adjust strategies confidently.
How Does Client Segment Analysis Help Business Growth?
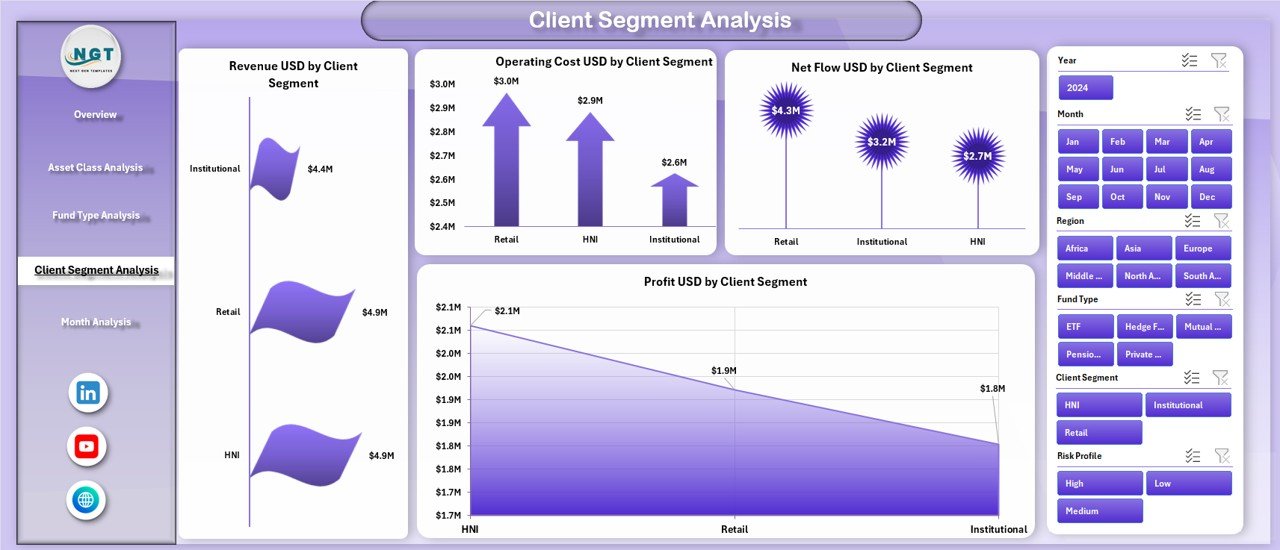
Client behavior directly affects revenue stability and profitability. Therefore, understanding client segments remains critical.
Client Segment Analysis Page Breakdown
This page includes four focused charts:
-
Revenue USD by Client Segment
This chart shows which client groups drive revenue growth. -
Operating Cost USD by Client Segment
This visual highlights cost-intensive client segments. -
Net Flow USD by Client Segment
This metric tracks inflows and outflows at the client level. -
Profit USD by Client Segment
This chart compares profit contribution across segments.
As a result, companies improve pricing strategies and client relationship management.
What Insights Does the Month Analysis Page Provide?
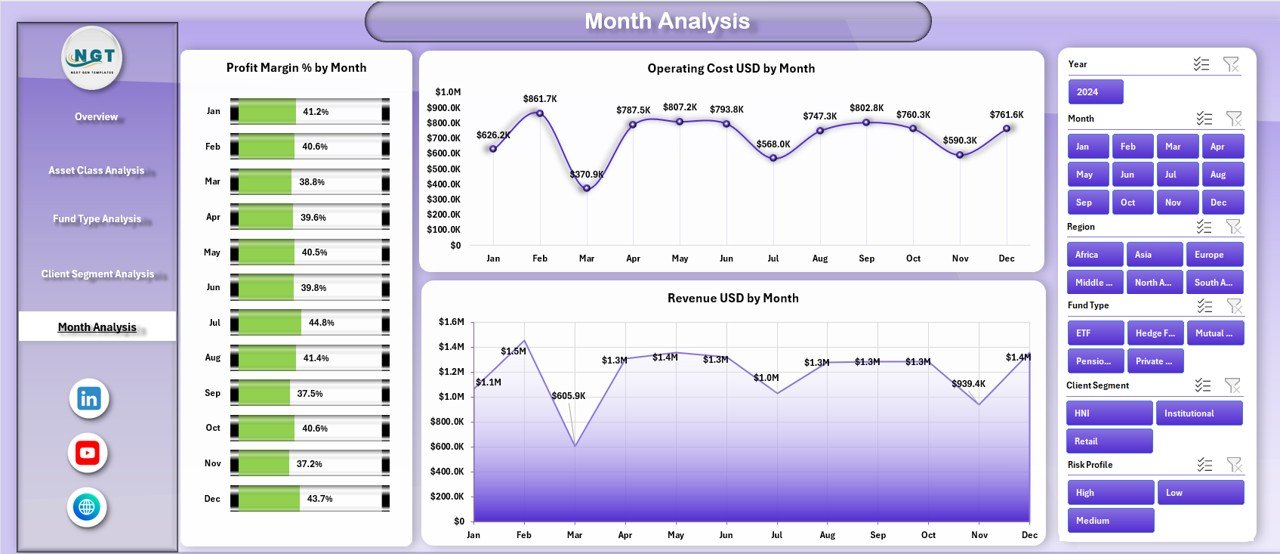
Trends over time reveal seasonality, growth patterns, and operational efficiency. Therefore, the Month Analysis Page focuses on time-based performance.
Charts on the Month Analysis Page
This page includes three key charts:
-
Profit Margin % by Month
This chart tracks profitability trends over time. -
Operating Cost USD by Month
This visual helps control cost fluctuations. -
Revenue USD by Month
This chart shows monthly revenue movement and growth patterns.
Consequently, forecasting and budgeting become more accurate.
Click to Purchases Asset Management Companies Dashboard in Excel
Advantages of Asset Management Companies Dashboard in Excel
Using an Asset Management Companies Dashboard in Excel offers several strong advantages.
-
✔ Centralized financial visibility in one file
-
✔ Faster and more accurate decision-making
-
✔ Reduced manual reporting effort
-
✔ Improved risk and profitability analysis
-
✔ Easy customization without coding
-
✔ Cost-effective compared to BI tools
-
✔ Familiar Excel interface for users
Because of these benefits, organizations gain a competitive edge.
Opportunities for Improvement in Asset Management Dashboards
Although the dashboard delivers strong value, continuous improvement ensures long-term effectiveness.
-
Adding automated data imports improves efficiency
-
Including benchmarking metrics enhances insights
-
Integrating scenario analysis supports forecasting
-
Adding drill-down tables improves detail visibility
Therefore, organizations should refine dashboards regularly.
Best Practices for the Asset Management Companies Dashboard in Excel
To maximize value, follow these best practices:
-
Maintain clean and structured data tables
-
Update data at regular intervals
-
Use consistent definitions for KPIs
-
Limit charts to meaningful metrics only
-
Apply slicers for flexible analysis
-
Validate formulas periodically
-
Train users on dashboard interpretation
By following these practices, teams ensure reliability and accuracy.
Who Should Use an Asset Management Companies Dashboard in Excel?
This dashboard suits multiple stakeholders, including:
-
Asset managers
-
Portfolio managers
-
Investment analysts
-
Finance teams
-
Risk management teams
-
Senior leadership
Because it supports both strategic and operational decisions, it fits organizations of all sizes.
Real-World Use Cases of Asset Management Companies Dashboard in Excel
-
Monitoring profitability across asset classes
-
Identifying underperforming fund types
-
Tracking client-wise revenue and cost
-
Analyzing monthly performance trends
-
Supporting investor reporting and reviews
Therefore, the dashboard delivers value across daily operations and long-term planning.
Conclusion
An Asset Management Companies Dashboard in Excel transforms complex financial data into clear, actionable insights. By combining overview metrics with asset class, fund type, client segment, and monthly analysis, the dashboard empowers organizations to make informed decisions quickly.
Moreover, its Excel-based design ensures flexibility, affordability, and ease of use. When implemented with best practices, this dashboard becomes a powerful decision-support system for modern asset management companies.
Frequently Asked Questions (FAQs)
What is an Asset Management Companies Dashboard in Excel?
It is a structured Excel-based tool that visualizes financial and investment performance across asset classes, funds, clients, and time periods.
Who can use this dashboard?
Asset managers, analysts, finance teams, and leadership teams can use it effectively.
Does this dashboard require advanced Excel skills?
No, basic Excel knowledge is enough to use and customize the dashboard.
Can I customize the dashboard for my organization?
Yes, you can easily add metrics, charts, or filters based on your needs.
How often should the data be updated?
You should update the data monthly or as frequently as business needs demand.
Is this dashboard suitable for small asset management firms?
Yes, it works well for both small firms and large enterprises.
Visit our YouTube channel to learn step-by-step video tutorials