Credit card companies operate in one of the most data-intensive and competitive environments. Every day, teams track transactions, revenues, delinquency rates, customer growth, approval ratios, fraud levels, and operational efficiency. However, when data spreads across multiple files and reports, leaders lose clarity. As a result, decisions slow down and risks increase.
That is exactly why a Credit Card Companies KPI Dashboard in Excel becomes a powerful solution.
This article explains everything you need to know about a Credit Card Companies KPI Dashboard in Excel. You will learn what it is, why it matters, how it works, worksheet-by-worksheet explanations, advantages, best practices, and frequently asked questions. Moreover, you will see how this dashboard transforms raw numbers into actionable insights.
Click to buy Credit Card Companies KPI Dashboard in Excel
What Is a Credit Card Companies KPI Dashboard in Excel?
A Credit Card Companies KPI Dashboard in Excel is a centralized, interactive reporting system designed to track, analyze, and visualize key performance indicators related to credit card operations.
Instead of reviewing disconnected spreadsheets for approvals, usage, defaults, and revenue, teams use one structured Excel file. Consequently, decision-makers gain instant visibility into both operational and financial performance.
This dashboard supports:
- Month-to-date (MTD) analysis
- Year-to-date (YTD) tracking
- Target vs Actual comparisons
- Current year vs previous year comparisons
Because Excel powers the dashboard, teams avoid complex tools and still enjoy advanced analytics.
Why Do Credit Card Companies Need a KPI Dashboard in Excel?
Credit card businesses handle massive transaction volumes. Therefore, even small inefficiencies create large financial impacts. A KPI dashboard helps teams act quickly and confidently.
Key reasons include:
- You monitor performance in real time
- You identify risks before they escalate
- You compare actual results against targets
- You track trends across months and years
- You improve accountability across departments
Moreover, Excel dashboards offer flexibility. Teams can customize KPIs without heavy IT support.
How Does a Credit Card Companies KPI Dashboard Improve Decision-Making?
A KPI dashboard improves decision-making by turning data into stories. Instead of scanning rows of numbers, users see patterns instantly.
For example:
- Conditional formatting highlights underperforming KPIs
- Trend charts show growth or decline over time
- Slicers allow month-wise analysis
- Comparison metrics reveal gaps against targets
As a result, leadership focuses on strategy rather than manual reporting.
What KPIs Do Credit Card Companies Commonly Track?
A Credit Card Companies KPI Dashboard in Excel typically includes KPIs across multiple areas.
Financial KPIs
- Total Revenue
- Interest Income
- Fee Income
- Cost per Account
- Profit Margin
Customer KPIs
- Active Cardholders
- New Card Issuance
- Customer Retention Rate
- Average Spend per Card
Risk & Compliance KPIs
- Delinquency Rate
- Charge-off Rate
- Fraud Transactions
- Approval Rate
Operational KPIs
- Transaction Volume
- Authorization Success Rate
- Processing Time
Because the dashboard supports customization, teams can add or remove KPIs easily.
What Are the Key Features of the Credit Card Companies KPI Dashboard in Excel?
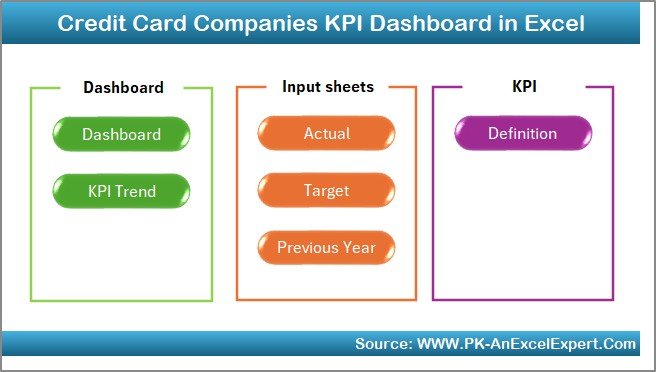
This dashboard comes with a well-structured layout that simplifies analysis and navigation. It contains 7 powerful worksheets, each designed for a specific purpose.
Let us explore each sheet in detail.
Summary Page
The Summary Page acts as the index of the dashboard.
Key highlights of the Summary Page:
- Six navigation buttons for quick access
- Clean and user-friendly layout
- Logical flow across all worksheets
Because this page acts as a control center, users move between sheets without confusion. Therefore, reporting becomes faster and smoother.
Click to buy Credit Card Companies KPI Dashboard in Excel
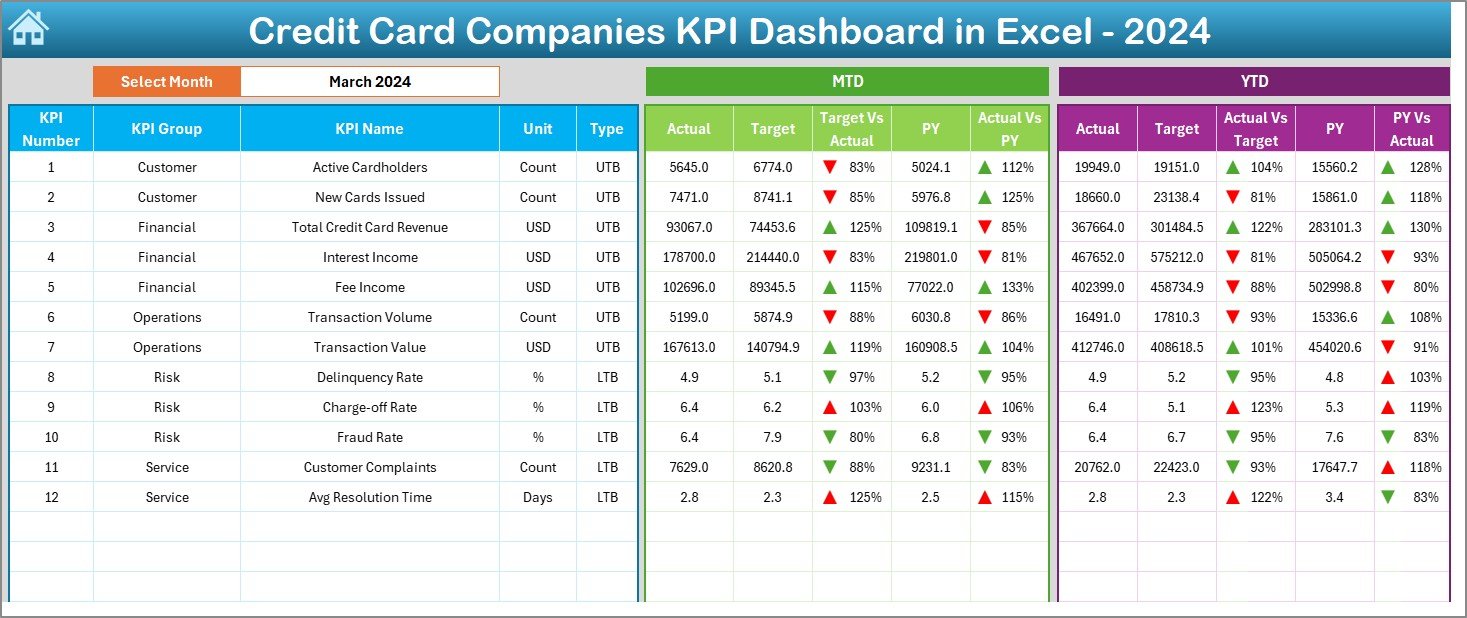
Dashboard Sheet
The Dashboard Sheet Tab serves as the heart of the KPI Dashboard.
Core functionalities include:
- Month selection from cell D3
- Automatic refresh of all KPIs based on the selected month
- Display of MTD Actual, Target, and Previous Year values
- Display of YTD Actual, Target, and Previous Year values
Performance comparison indicators:
- Target vs Actual comparison
- Previous Year vs Actual comparison
- Conditional formatting with up and down arrows
As a result, users quickly identify whether KPIs perform well or need attention.
Click to buy Credit Card Companies KPI Dashboard in Excel
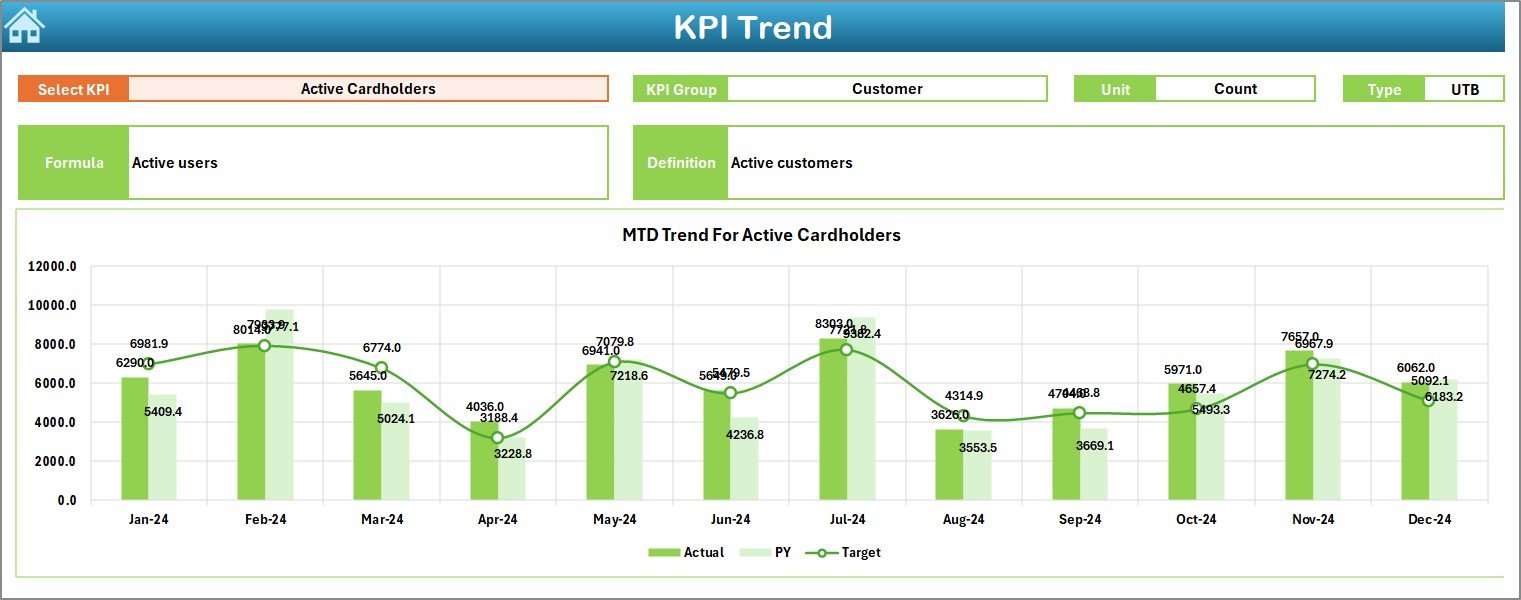
Trend Sheet
The Trend Sheet Tab focuses on deeper KPI analysis.
Key features include:
- KPI selection from dropdown in cell C3
- Display of KPI Group
- Unit of measurement
- KPI type (Lower the Better or Upper the Better)
- KPI formula and definition
Visual analysis:
- MTD trend chart for Actual, Target, and Previous Year
- YTD trend chart for Actual, Target, and Previous Year
Because trends reveal performance direction, this sheet helps teams forecast outcomes and plan actions.
Click to buy Credit Card Companies KPI Dashboard in Excel
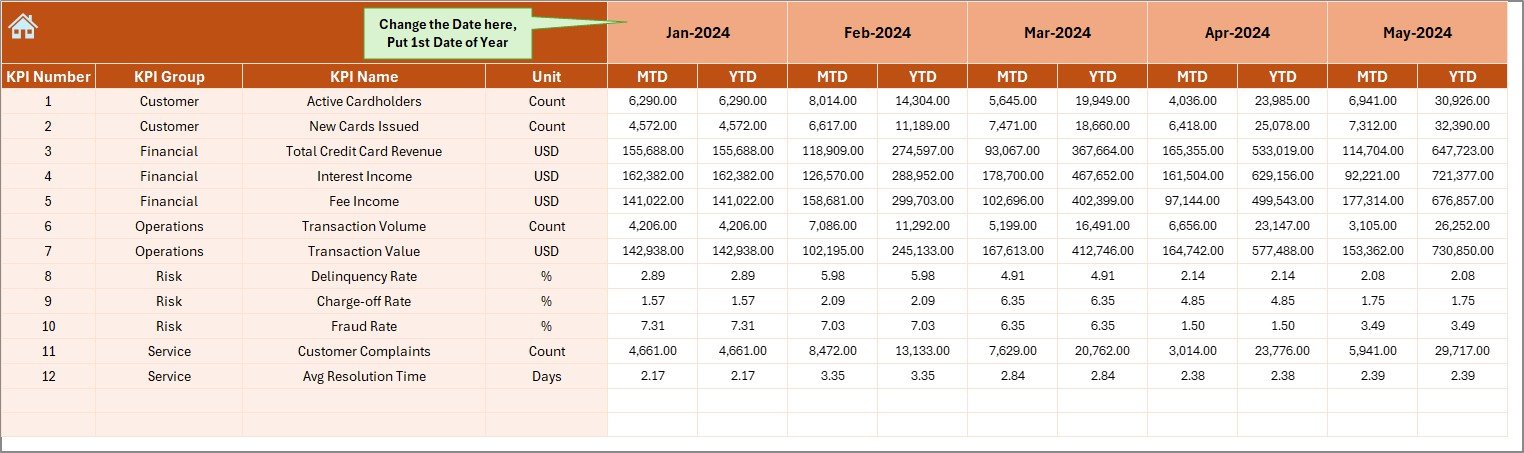
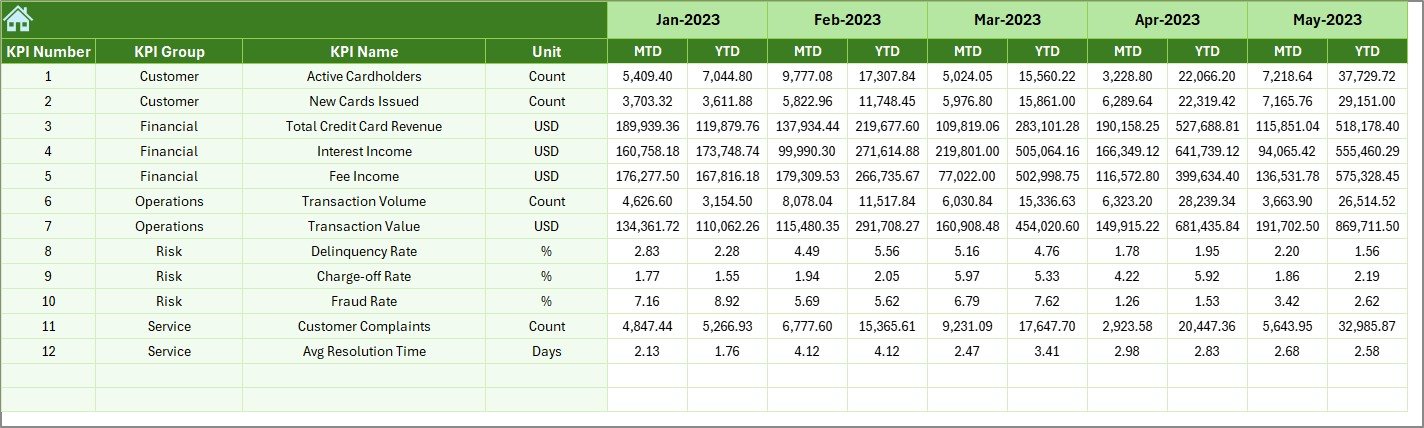
Actual Numbers Input Sheet
The Actual Numbers Input Sheet captures real performance data.
How it works:
- Enter actual MTD and YTD values
- Select the first month of the year in cell E1
- Change months easily as the year progresses
Because this sheet drives the entire dashboard, accurate data entry ensures reliable insights.
Click to buy Credit Card Companies KPI Dashboard in Excel
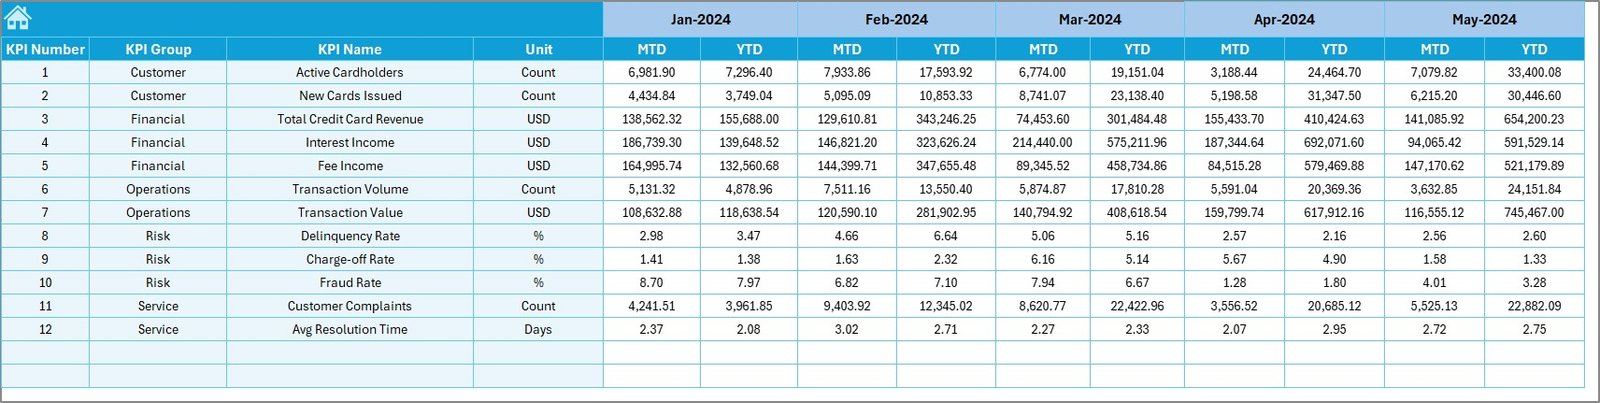
the Target Sheet
The Target Sheet Tab defines performance expectations.
Key responsibilities:
- Enter MTD target values for each KPI
- Enter YTD target values for each KPI
Targets guide performance tracking. Therefore, this sheet supports accountability and goal alignment.
Click to buy Credit Card Companies KPI Dashboard in Excel
Previous Year Number Sheet
The Previous Year Number Sheet Tab enables historical comparison.
Key benefits:
- Enter last year’s MTD values
- Enter last year’s YTD values
- Compare growth or decline year over year
Because year-over-year analysis highlights progress, this sheet supports strategic planning.
Click to buy Credit Card Companies KPI Dashboard in Excel
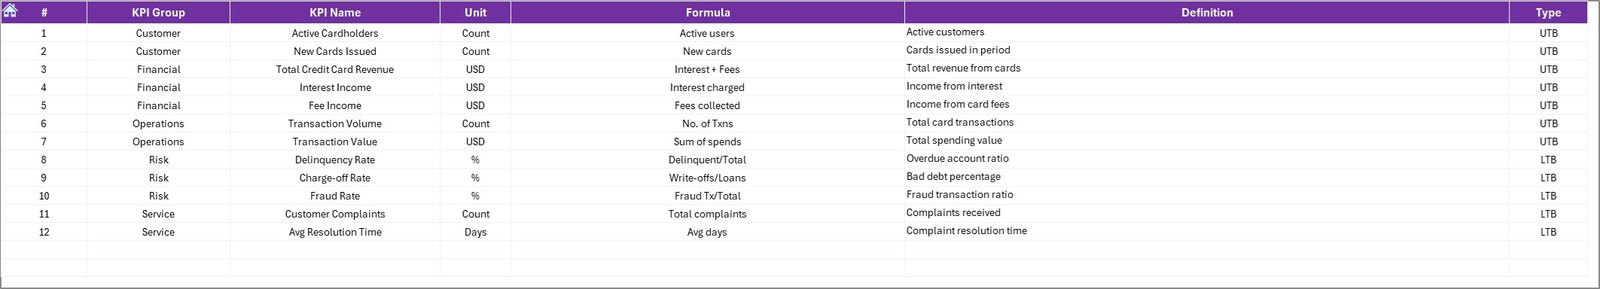
KPI Definition Sheet
The KPI Definition Sheet Tab acts as a reference guide.
Information stored includes:
- KPI Name
- KPI Group
- Unit of measurement
- KPI Formula
- KPI Definition
This sheet ensures consistency across teams. As a result, everyone interprets KPIs the same way.
Click to buy Credit Card Companies KPI Dashboard in Excel
Advantages of a Credit Card Companies KPI Dashboard in Excel
A Credit Card Companies KPI Dashboard in Excel delivers measurable value across the organization.
Key advantages include:
- Centralized Reporting – All KPIs in one place
- Time Savings – No manual report creation
- Target Visibility – Clear target vs actual comparison
- Trend Analysis – MTD and YTD performance tracking
- Risk Monitoring – Early detection of delinquency and fraud
- Flexibility – Easy KPI customization
- Cost-Effective – No expensive BI tools required
Because Excel supports automation and visuals, teams gain power without complexity.
How Does This Dashboard Support Strategic Growth?
Strategic growth requires accurate insights. This dashboard supports growth by:
- Highlighting profitable customer segments
- Identifying underperforming KPIs early
- Supporting data-driven product decisions
- Improving operational efficiency
As a result, leadership shifts focus from reporting to strategy.
Best Practices for the Credit Card Companies KPI Dashboard in Excel
To maximize value, teams should follow proven best practices.
- Define Clear KPIs First
Always align KPIs with business goals. Avoid tracking metrics that do not drive decisions.
- Maintain Data Accuracy
Enter actual, target, and previous year data carefully. Clean data ensures reliable insights.
- Review the Dashboard Regularly
Schedule monthly or weekly reviews. Regular reviews keep teams aligned and proactive.
- Use Trend Analysis for Forecasting
Analyze trends rather than isolated numbers. Trends reveal direction and momentum.
- Train Teams on KPI Definitions
Ensure everyone understands KPI formulas and definitions. Shared understanding prevents misinterpretation.
- Update Targets Periodically
Revise targets when business conditions change. Updated targets keep performance realistic.
How Can This Dashboard Improve Compliance and Risk Management?
Credit card companies face strict compliance requirements. This dashboard supports compliance by:
- Tracking delinquency and charge-off trends
- Monitoring approval and fraud rates
- Providing audit-ready historical data
Therefore, teams stay proactive rather than reactive.
Is Excel Still Relevant for Credit Card Analytics?
Yes, Excel remains highly relevant.
Reasons include:
- Familiarity across finance teams
- Flexibility in customization
- Low implementation cost
- Integration with other systems
When designed correctly, Excel dashboards deliver enterprise-level insights.
Conclusion: Why Should Credit Card Companies Use a KPI Dashboard in Excel?
A Credit Card Companies KPI Dashboard in Excel transforms complex data into clear insights. It centralizes performance tracking, supports faster decisions, and improves accountability. Moreover, it empowers teams without heavy technology investments.
When credit card companies track the right KPIs, review trends regularly, and follow best practices, they gain a competitive edge. This dashboard serves as a practical, powerful, and scalable solution for modern credit card operations.
Frequently Asked Questions (FAQs)
- What is the main purpose of a Credit Card Companies KPI Dashboard in Excel?
The main purpose involves tracking, analyzing, and visualizing key performance indicators in one centralized Excel file for better decision-making.
- Can non-technical users operate this dashboard?
Yes. The dashboard uses dropdowns, buttons, and visuals. Therefore, non-technical users can operate it easily.
- How often should teams update the dashboard?
Teams should update actual and target data monthly. However, high-volume environments may update it more frequently.
- Can companies add custom KPIs to the dashboard?
Yes. The KPI Definition Sheet allows users to add or modify KPIs based on business needs.
- Does this dashboard support year-over-year analysis?
Yes. The Previous Year Number Sheet enables detailed year-over-year comparisons.
- Is this dashboard suitable for small and large credit card companies?
Yes. Both small and large organizations benefit because Excel scales easily with data volume.
- How does conditional formatting help decision-making?
Conditional formatting highlights performance gaps instantly. As a result, teams focus on critical KPIs faster.
Click to buy Credit Card Companies KPI Dashboard in Excel
Visit our YouTube channel to learn step-by-step video tutorials
Watch the step-by-step video tutorial: