TV channels operate in a fast-moving and highly competitive environment. Every single day, teams monitor ratings, audience reach, advertising revenue, content performance, and operational efficiency. Therefore, tracking performance accurately becomes critical. However, many TV networks still depend on scattered Excel files, manual reports, and delayed summaries. As a result, decision-making often becomes reactive instead of strategic.
That is exactly where the TV Channels KPI Dashboard in Excel delivers powerful value.
In this detailed, SEO-friendly, and easy-to-understand article, you will learn what a TV Channels KPI Dashboard in Excel is, why it matters, how it works, its worksheet-wise structure, advantages, best practices, and frequently asked questions. Moreover, this article expands your provided information with practical insights so you can confidently use this dashboard in real-world TV channel operations.
Click to Purchases TV Channels KPI Dashboard in Excel
What Is a TV Channels KPI Dashboard in Excel?
A TV Channels KPI Dashboard in Excel is a ready-to-use analytical tool designed to track, analyze, and visualize key performance indicators related to television channel operations.
Instead of managing separate sheets for ratings, revenue, targets, and historical performance, this dashboard consolidates all critical KPIs into one structured Excel file. Consequently, channel heads, programming teams, finance teams, and management gain instant visibility into performance.
Moreover, because the dashboard runs entirely in Excel, teams can update data easily without relying on complex tools or external software.
Why Do TV Channels Need a KPI Dashboard in Excel?
TV channels face constant pressure to deliver high-quality content, maintain viewership, and achieve revenue targets. Therefore, performance tracking must remain accurate, timely, and actionable.
Common Challenges Without a KPI Dashboard
-
KPI data scattered across multiple files
-
Manual calculations causing errors
-
Slow monthly and yearly reporting
-
Difficulty comparing current and previous year performance
-
Limited visibility into target achievement
However, a TV Channels KPI Dashboard in Excel eliminates these challenges by providing a centralized and automated reporting framework.
Click to Purchases TV Channels KPI Dashboard in Excel
How Does the TV Channels KPI Dashboard in Excel Work?
The dashboard follows a simple and logical workflow.
-
First, users enter actual, target, and previous year data
-
Then, the dashboard calculates MTD and YTD metrics automatically
-
Next, visuals and KPI tables update dynamically
-
Finally, decision-makers review performance using slicers and trend charts
As a result, reporting becomes faster, more consistent, and highly reliable.
What Are the Key Features of the TV Channels KPI Dashboard in Excel?
This ready-to-use dashboard includes multiple features designed for performance clarity and ease of use.
🔹 Month-Based Analysis
-
Month selection using a drop-down
-
Automatic refresh of all KPIs
🔹 Comprehensive KPI Coverage
-
MTD performance
-
YTD performance
-
Target vs Actual
-
Current Year vs Previous Year
🔹 Visual Performance Indicators
-
Up and down arrows
-
Green and red conditional formatting
🔹 Structured KPI Definitions
-
KPI group
-
KPI type (LTB / UTB)
-
Formula and definition
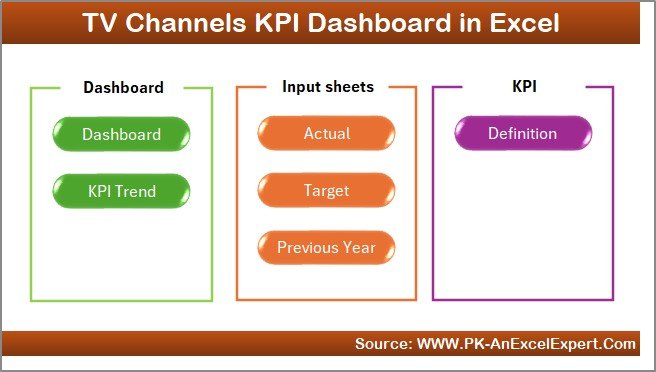
How Many Worksheets Are Included in the TV Channels KPI Dashboard in Excel?
The TV Channels KPI Dashboard in Excel consists of 7 well-structured worksheets, each serving a specific purpose.
1️⃣ What Is the Home Sheet in the TV Channels KPI Dashboard?
The Home Sheet acts as the navigation hub of the dashboard.
Key Highlights of the Home Sheet
-
Clean and user-friendly layout
-
6 navigation buttons
-
One-click access to all major sheets
Therefore, users can move across the dashboard easily without searching for tabs.
Click to Purchases TV Channels KPI Dashboard in Excel
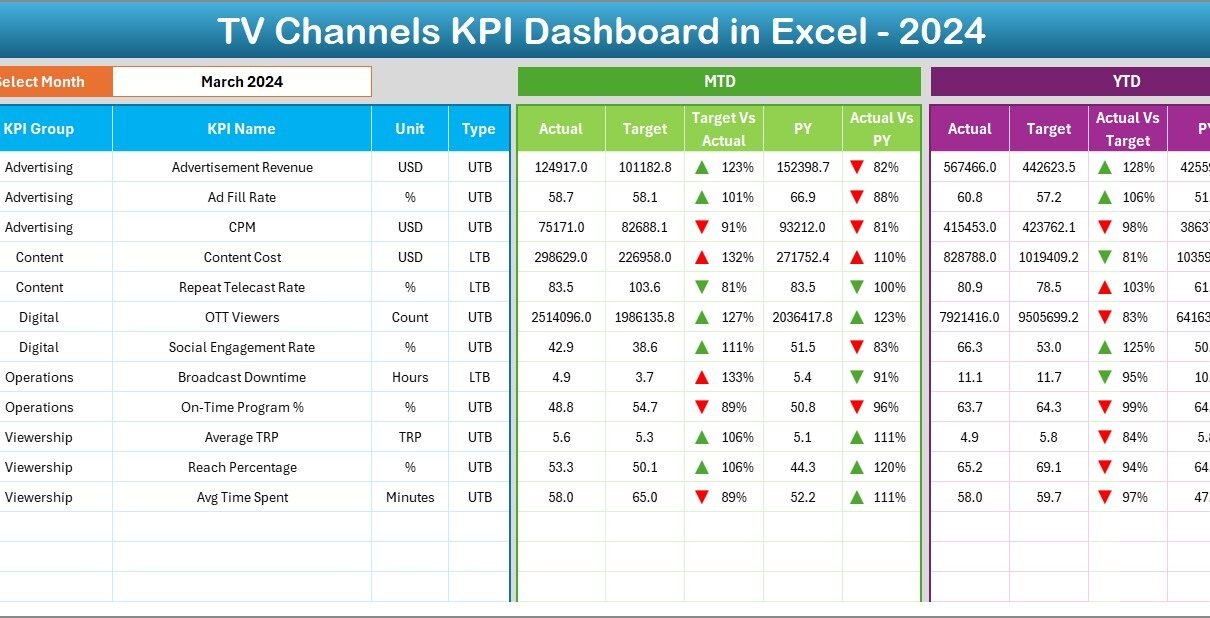
2️⃣ What Does the Dashboard Sheet Show?
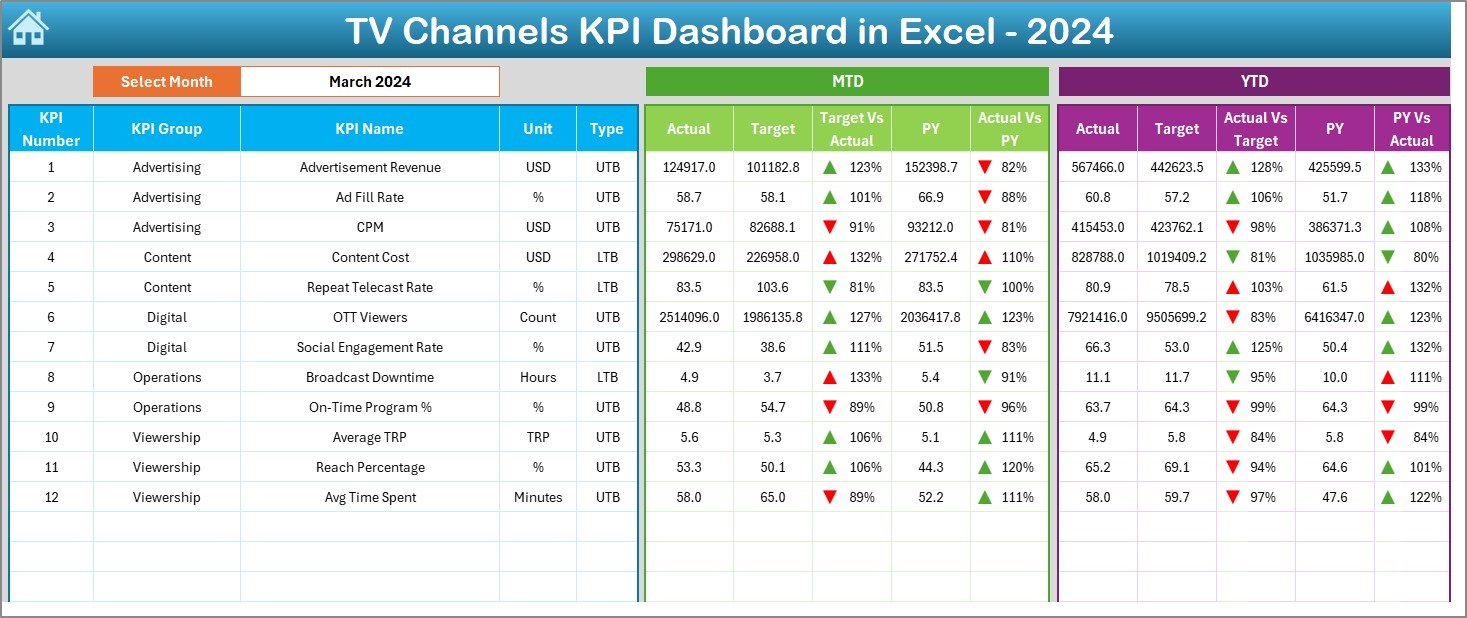
The Dashboard Sheet serves as the main performance overview page.
Month Selection Feature
-
Located at cell D3
-
Users select the reporting month
-
Entire dashboard updates automatically
As a result, users can analyze any month instantly.
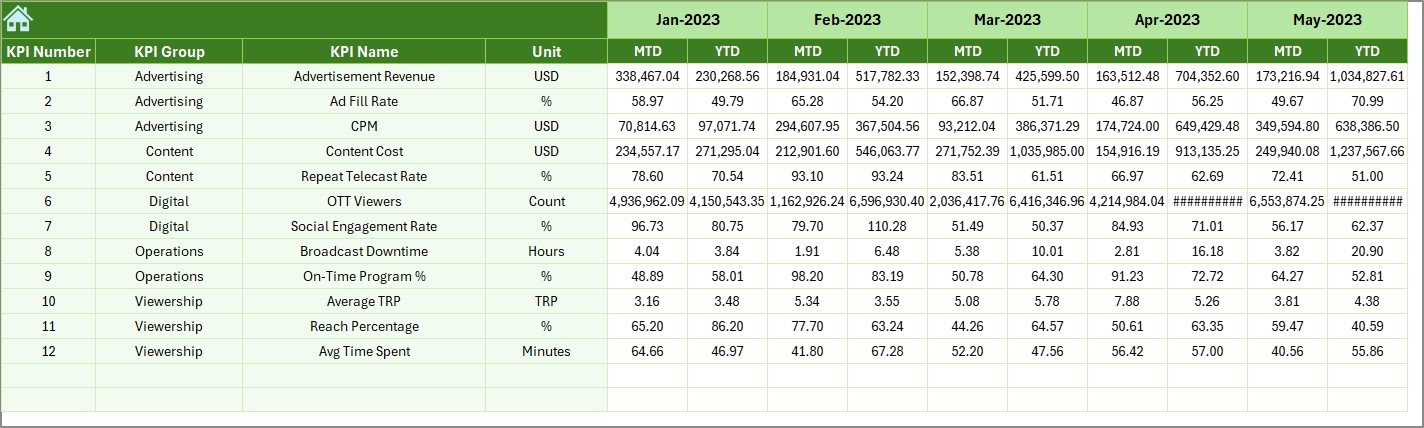
MTD Performance Section
This section displays Month-to-Date performance for all KPIs.
-
MTD Actual – Current month actual value
-
MTD Target – Planned target value
-
Previous Year MTD – Last year’s same-period data
-
Target vs Actual % – Actual ÷ Target
-
PY vs Actual % – Actual ÷ Previous Year
Conditional formatting arrows highlight performance gaps clearly.
YTD Performance Section
This section focuses on Year-to-Date performance.
-
YTD Actual – Current year cumulative performance
-
YTD Target – Yearly planned targets
-
Previous Year YTD – Last year cumulative data
-
Target vs Actual % – Actual ÷ Target
-
PY vs Actual % – Actual ÷ Previous Year
Therefore, teams track both short-term and long-term performance together.
Click to Purchases TV Channels KPI Dashboard in Excel
3️⃣ What Is the KPI Trend Sheet and Why Is It Important?
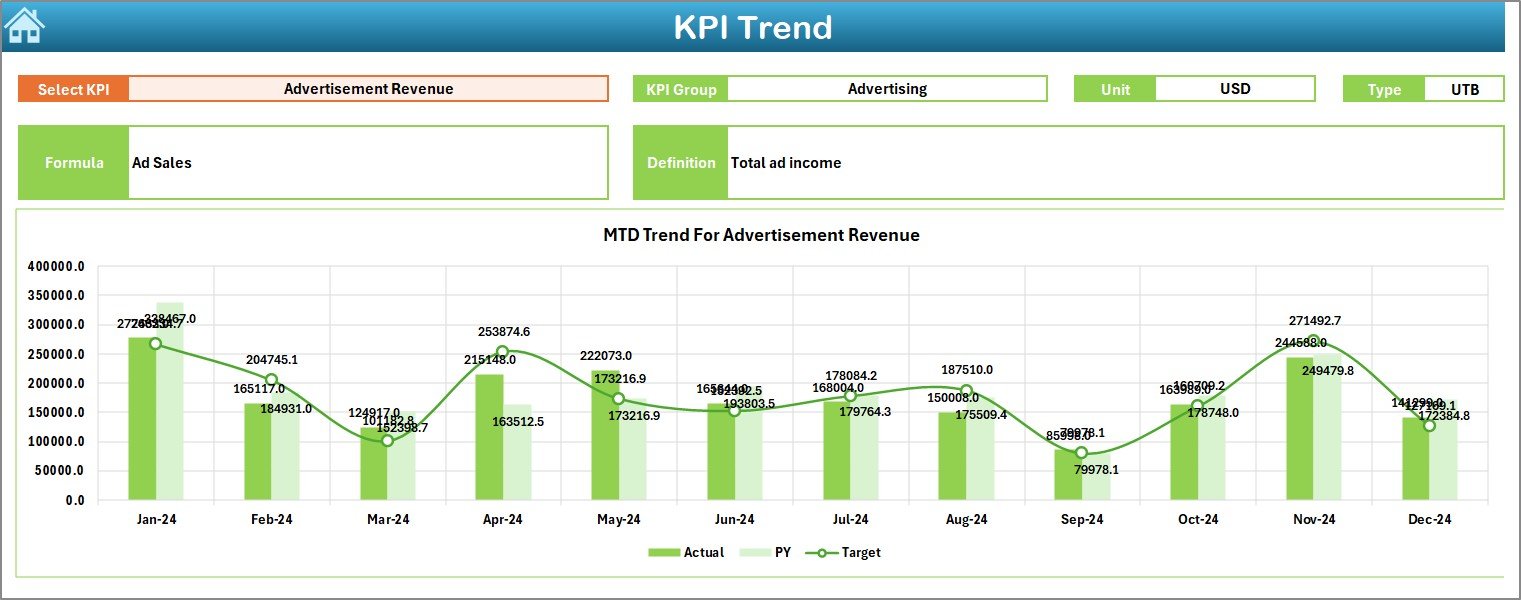
The KPI Trend Sheet helps users analyze performance movement over time.
Key Features of the KPI Trend Sheet
-
KPI selection drop-down at cell C3
-
Display of KPI Group
-
Unit of KPI
-
KPI Type (Lower the Better / Upper the Better)
-
KPI Formula and Definition
Trend Charts on the KPI Trend Sheet
-
MTD Trend Chart
-
Actual
-
Target
-
Previous Year
-
-
YTD Trend Chart
-
Actual
-
Target
-
Previous Year
-
Because of these charts, users can easily identify trends, seasonality, and performance shifts.
4️⃣ What Is the Actual Numbers Input Sheet?
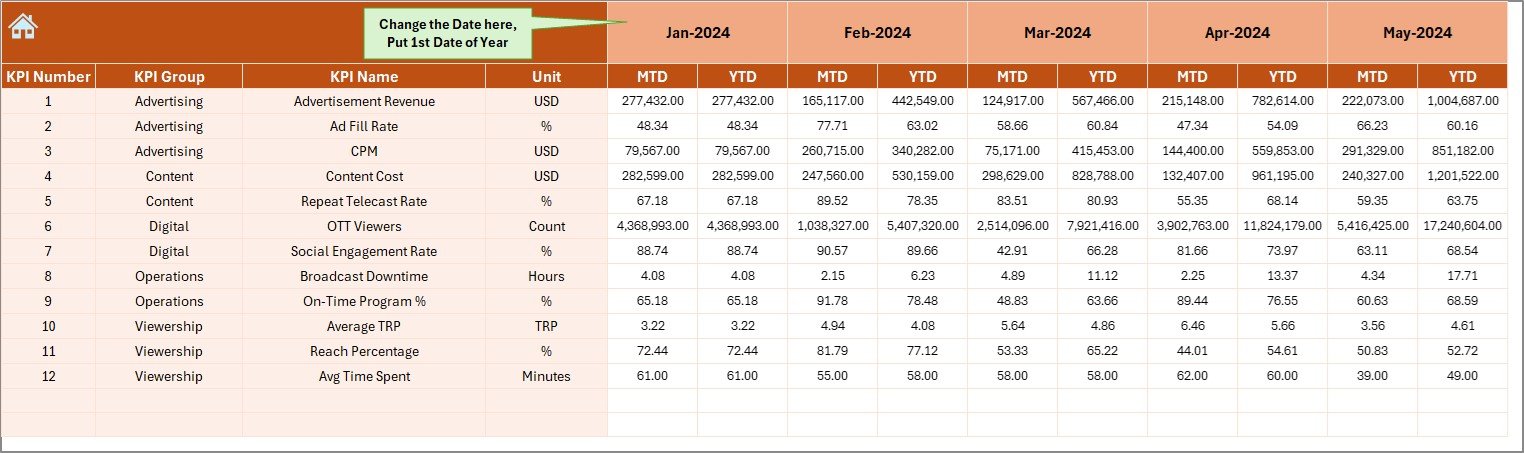
The Actual Numbers Input Sheet captures real performance data.
How to Use This Sheet
-
Enter MTD and YTD actual values
-
Select the reporting month from cell E1
-
Use the first month of the year as the base
As a result, the dashboard calculates and displays performance accurately.
5️⃣ What Is the Target Sheet Used For?
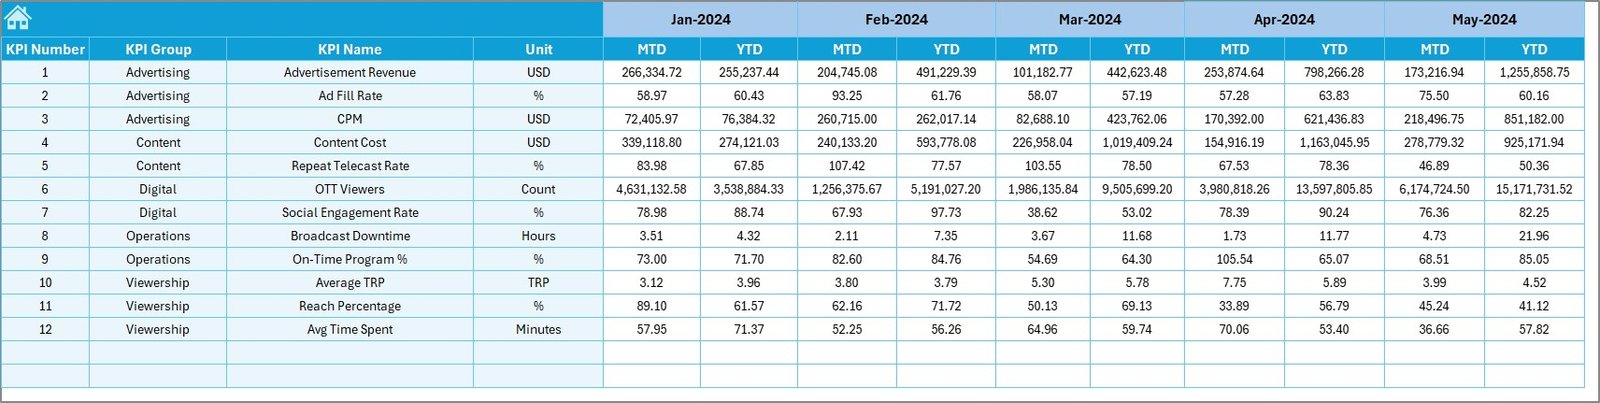
The Target Sheet stores planned KPI values.
Data Entered in This Sheet
-
KPI-wise MTD target values
-
KPI-wise YTD target values
-
Month-wise targets
Therefore, the dashboard can compare actual performance against planned goals.
Click to Purchases TV Channels KPI Dashboard in Excel
6️⃣ Why Is the Previous Year Number Sheet Important?
The Previous Year Number Sheet enables year-over-year comparison.
Key Benefits
-
Stores last year’s MTD data
-
Stores last year’s YTD data
-
Supports CY vs PY analysis
As a result, management understands growth, decline, and stability clearly.
7️⃣ What Is the KPI Definition Sheet?
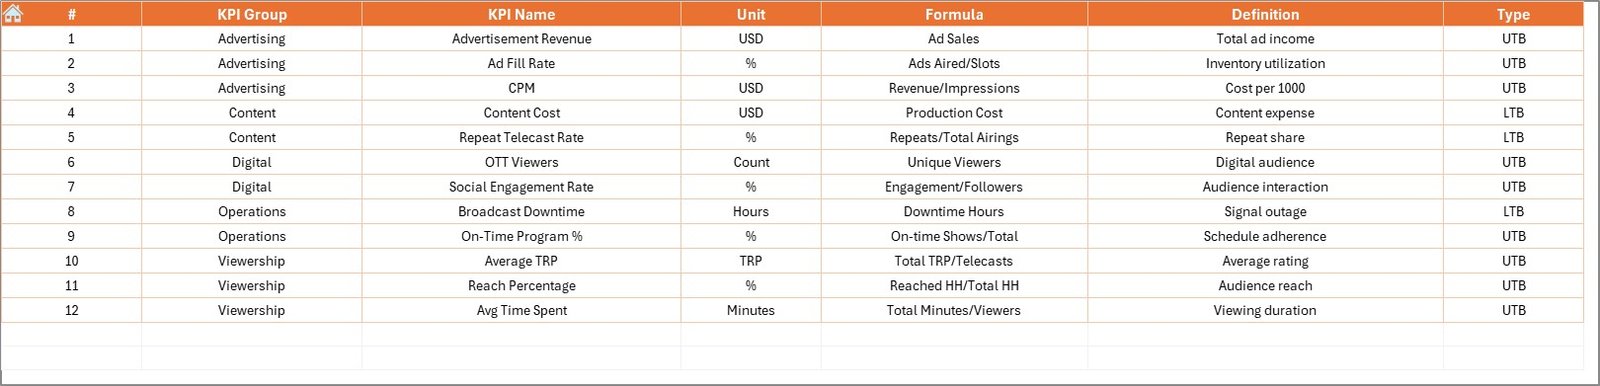
The KPI Definition Sheet ensures clarity and governance.
Information Captured in This Sheet
-
KPI Name
-
KPI Group
-
Unit
-
Formula
-
KPI Definition
Because of this sheet, users interpret KPIs consistently across teams.
Advantages of TV Channels KPI Dashboard in Excel
Using a TV Channels KPI Dashboard in Excel offers several business advantages.
✅ Centralized Reporting
All KPIs remain in one structured file.
✅ Faster Performance Reviews
Monthly and yearly reviews take minutes instead of hours.
✅ Improved Decision-Making
Clear visuals support data-driven decisions.
✅ Better Target Tracking
Instant visibility into target achievement.
✅ Strong Historical Comparison
Year-over-year insights improve planning.
✅ Easy Adoption
Excel-based design requires minimal training.
Click to Purchases TV Channels KPI Dashboard in Excel
Best Practices for the TV Channels KPI Dashboard in Excel
To get maximum value, follow these best practices.
🔹 Define KPIs Clearly
Always maintain accurate formulas and definitions.
🔹 Update Data Monthly
Consistent updates ensure reliable insights.
🔹 Validate Target Numbers
Ensure targets align with business goals.
🔹 Monitor Trends Regularly
Trend charts reveal risks early.
🔹 Use KPI Types Correctly
Classify KPIs as LTB or UTB carefully.
🔹 Review Both MTD and YTD
Balance short-term actions with long-term strategy.
How Does This Dashboard Support TV Channel Management?
This dashboard supports multiple management decisions:
-
Content performance evaluation
-
Advertising revenue planning
-
Programming strategy reviews
-
Operational efficiency tracking
-
Management reporting
Therefore, leadership shifts from reactive reporting to proactive performance management.
Conclusion: Why Should TV Channels Use a KPI Dashboard in Excel?
A TV Channels KPI Dashboard in Excel transforms raw performance data into a clear, visual, and actionable reporting system. Because it combines structured worksheets, automated calculations, and intuitive visuals, teams gain clarity without complexity.
Moreover, this dashboard helps TV channels improve transparency, accountability, and strategic decision-making. If your organization aims to strengthen performance tracking and reporting efficiency, this dashboard becomes an essential tool.
Frequently Asked Questions (FAQs)
❓ What is a TV Channels KPI Dashboard in Excel?
It is an Excel-based tool that tracks and visualizes key performance indicators for television channel operations.
❓ Can non-technical users operate this dashboard?
Yes. Users only need basic Excel knowledge to update data.
❓ What does LTB and UTB mean?
LTB means Lower the Better, while UTB means Upper the Better.
❓ Does this dashboard support year-over-year analysis?
Yes. It compares current year performance with previous year MTD and YTD values.
❓ Can KPIs be customized?
Absolutely. Users can add or modify KPIs using the KPI Definition sheet.
❓ How often should the dashboard be updated?
Monthly updates work best for accurate performance tracking.
Click to Purchases TV Channels KPI Dashboard in Excel
Visit our YouTube channel to learn step-by-step video tutorials