Managing refinery procurement without a centralized analytics system often creates delays, cost overruns, and visibility gaps. However, when procurement teams use a Refinery Procurement Dashboard in Power BI, they gain complete control over purchasing data, supplier performance, and cost trends. Therefore, many refinery organizations now rely on Power BI dashboards to simplify procurement decision-making.
In this article, you will clearly understand what a Refinery Procurement Dashboard in Power BI is, how it works, its structure, advantages, best practices, and real-world use cases. Moreover, you will learn how this dashboard improves transparency, efficiency, and cost control across refinery procurement operations.
Click to Purchases Refinery Procurement Dashboard in Power BI
What Is a Refinery Procurement Dashboard in Power BI?
A Refinery Procurement Dashboard in Power BI is an interactive analytics solution designed to track, analyze, and visualize procurement KPIs in a single, centralized platform. Instead of working with multiple spreadsheets and manual reports, procurement teams can monitor performance instantly.
As a result, users can analyze purchase order values, invoice status, supplier efficiency, lead time, and unit costs in real time. Furthermore, Power BI provides dynamic slicers, drill-downs, and visuals that help stakeholders explore data effortlessly.
Because Power BI updates data automatically, decision-makers always work with accurate and up-to-date procurement insights.
Why Do Refineries Need a Procurement Dashboard in Power BI?
Refinery procurement involves high-value transactions, multiple suppliers, and strict timelines. Therefore, manual tracking often leads to errors and delayed actions. A procurement dashboard solves these issues efficiently.
Refineries need this dashboard because it helps to:
-
Monitor procurement performance across departments and suppliers
-
Control unit costs and purchase order values
-
Identify invoice disputes and pending invoices early
-
Improve supplier lead time and efficiency
-
Support data-driven procurement decisions
Consequently, procurement managers can reduce risks and improve operational efficiency.
How Is the Refinery Procurement Dashboard in Power BI Structured?
This Refinery Procurement Dashboard in Power BI includes 5 well-structured pages, each designed for focused analysis.
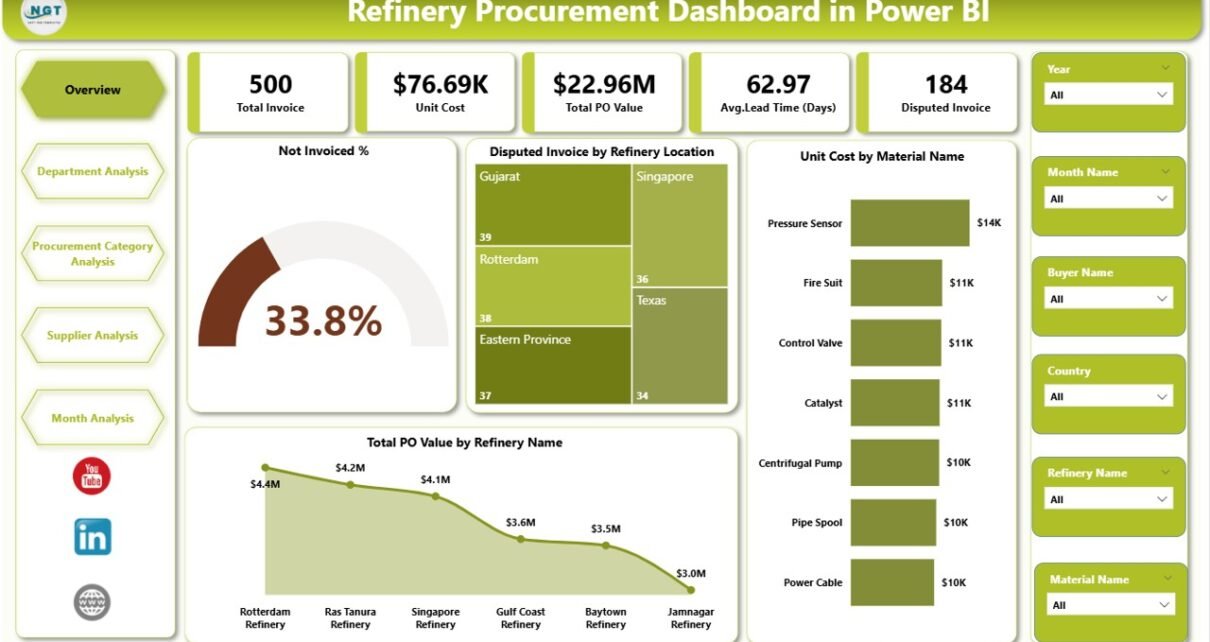
1. Overview Page – What Is the Overall Procurement Status?
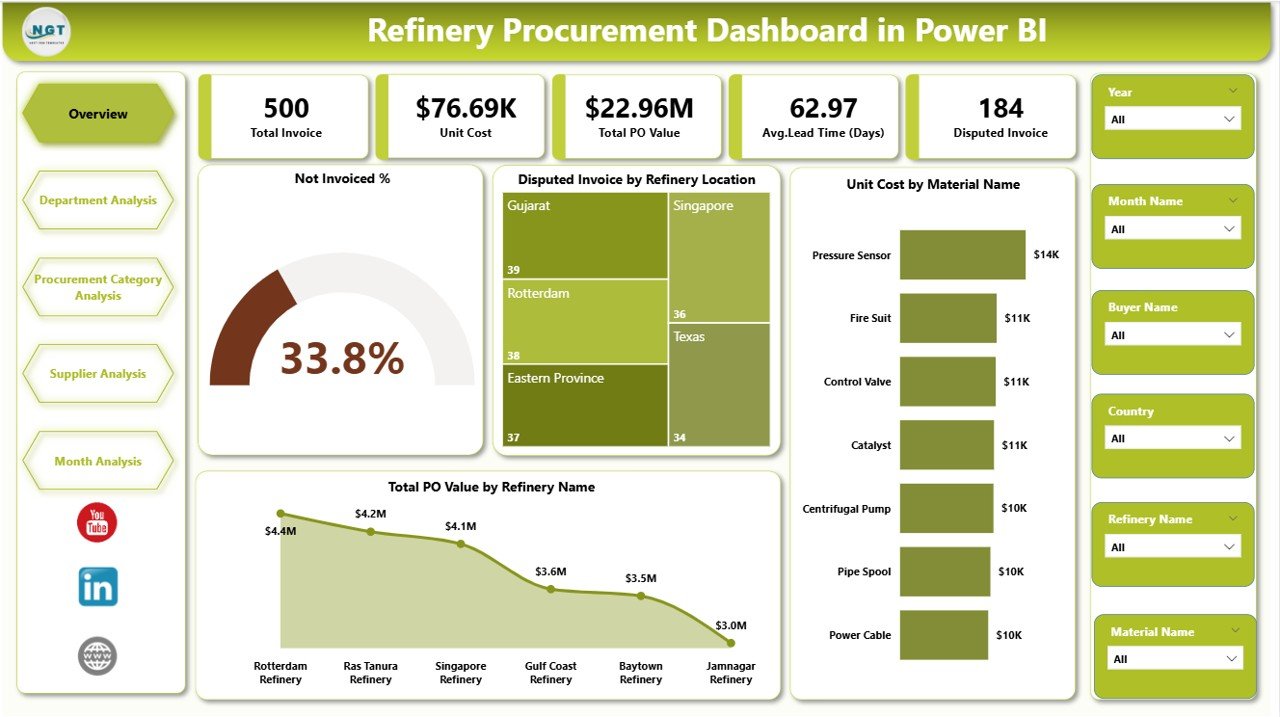
The Overview Page acts as the central monitoring screen for procurement leadership.
Key elements include:
-
🔹 Cards
-
Not Invoiced %
-
Disputed Invoice Value
-
-
📊 Charts
-
Not Invoice %
-
Disputed Invoice by Refinery Location
-
Unit Cost by Material Name
-
Total PO Value by Refinery Name
-
As a result, decision-makers get an instant snapshot of procurement health.
Click to Purchases Refinery Procurement Dashboard in Power BI
2. Department Analysis – How Are Departments Performing?
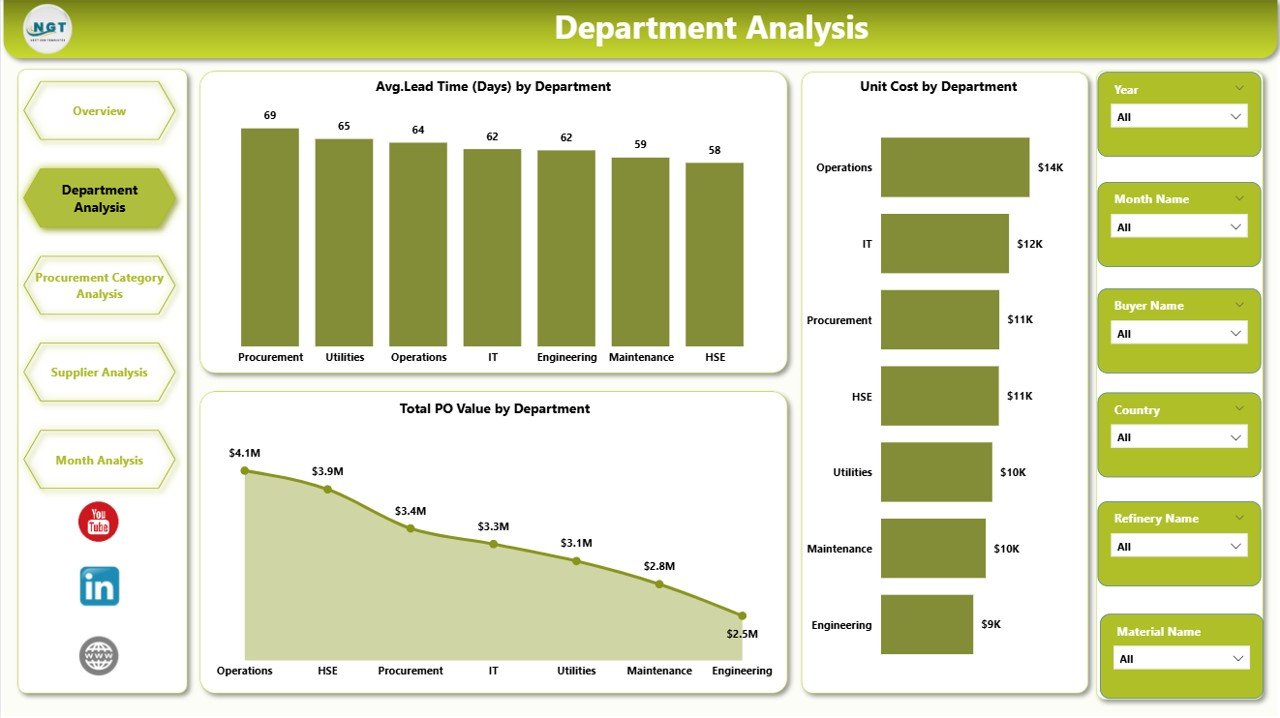
The Department Analysis Page focuses on departmental procurement efficiency.
Key charts include:
-
📈 Avg. Lead Time by Department
-
📊 Unit Cost by Department
-
💰 Total PO Value by Department
Therefore, managers can quickly identify cost-intensive or delayed departments.
3. Procurement Category Analysis – Which Categories Drive Costs?
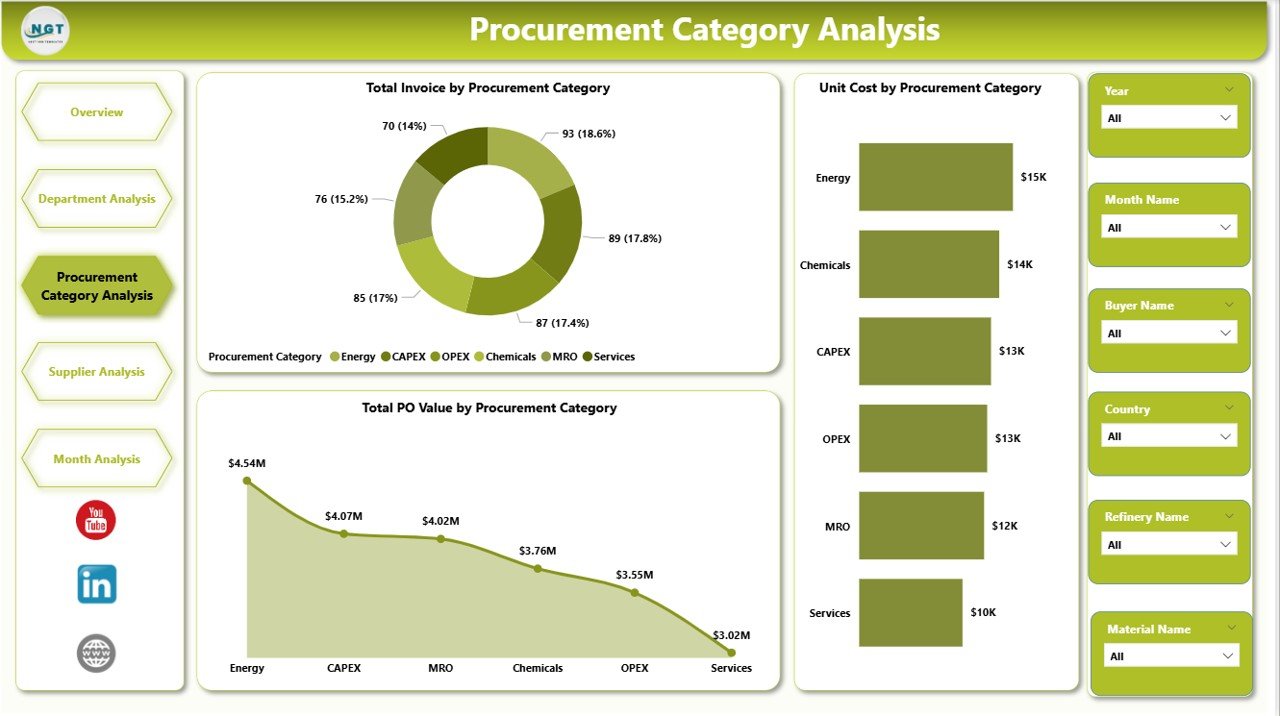
This page helps users analyze procurement performance by category.
Included visuals:
-
📊 Total Invoice by Procurement Category
-
📈 Unit Cost by Procurement Category
-
💰 Total PO Value by Procurement Category
As a result, procurement teams can optimize category-wise sourcing strategies.
4. Supplier Analysis – Which Suppliers Perform Best?
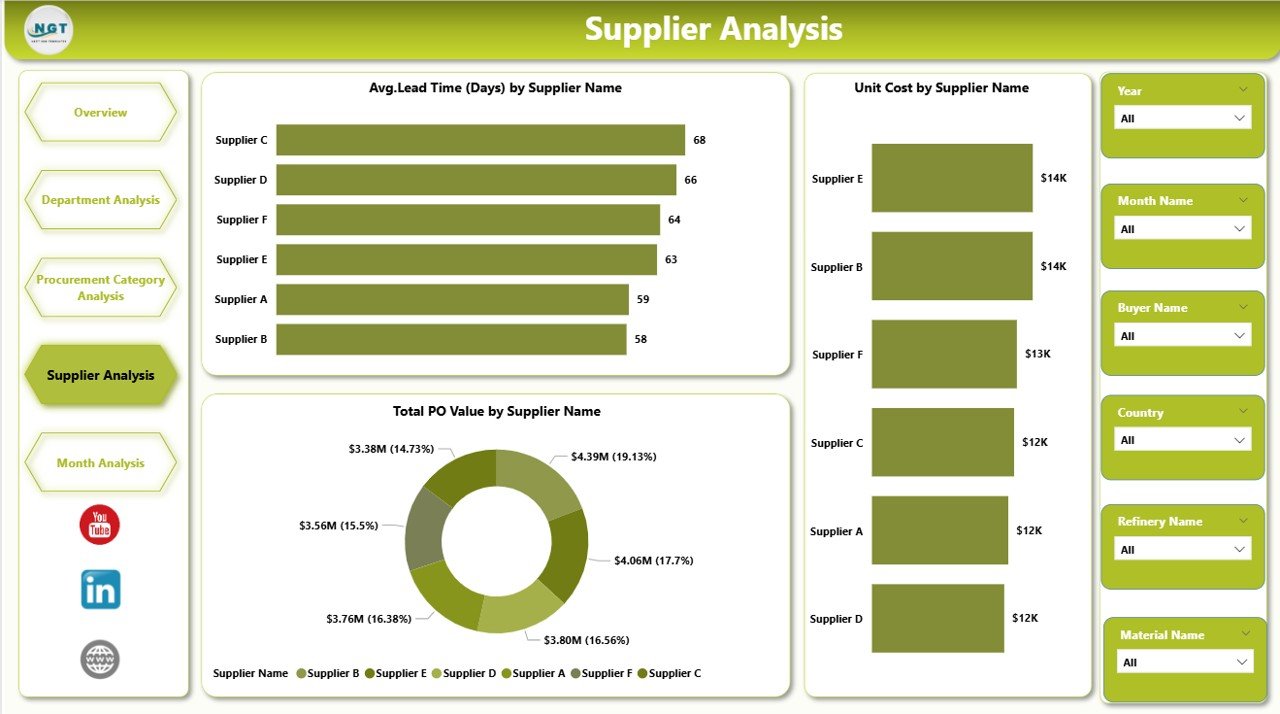
The Supplier Analysis Page evaluates supplier efficiency and reliability.
Key charts include:
-
⏱ Avg. Lead Time by Supplier Name
-
📈 Unit Cost by Supplier Name
-
💰 Total PO Value by Supplier Name
Therefore, teams can strengthen relationships with high-performing suppliers.
5. Monthly Trends – How Do Procurement Metrics Change Over Time?
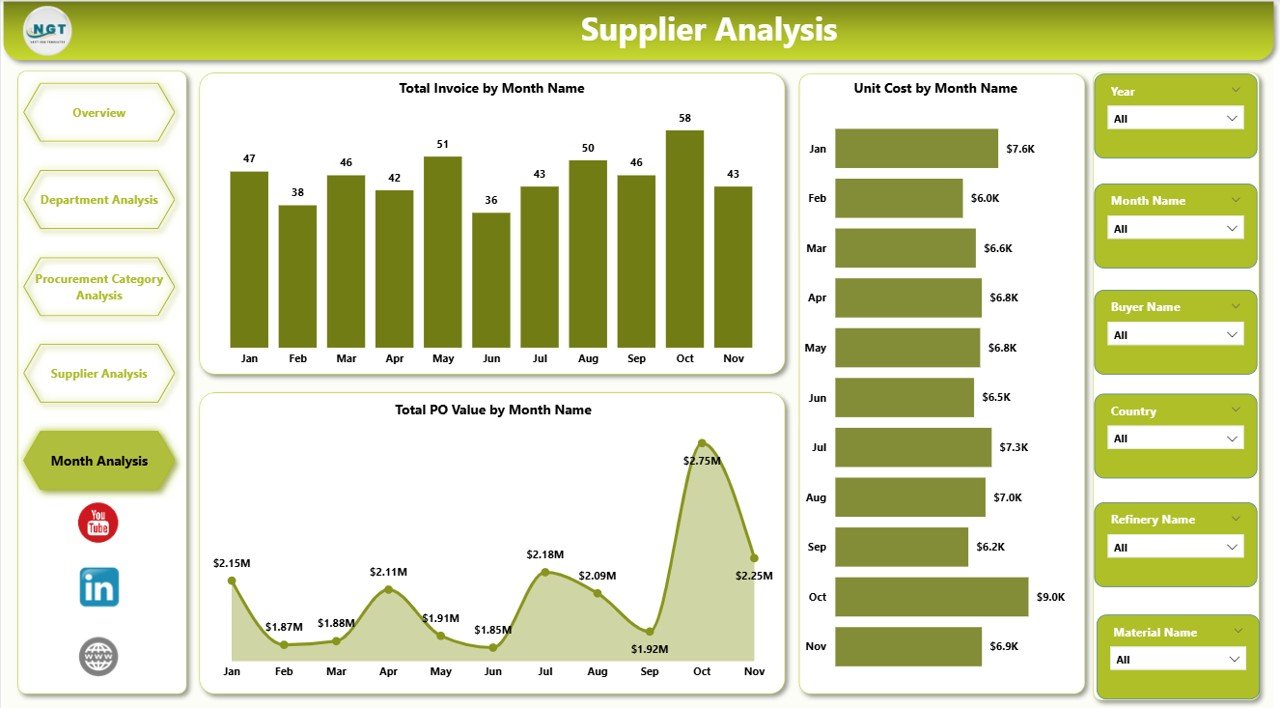
The Monthly Trends Page highlights procurement performance trends.
Charts include:
-
📊 Total Invoice by Month
-
📈 Unit Cost by Month
-
💰 Total PO Value by Month
Consequently, teams can detect seasonal patterns and cost fluctuations.
Click to Purchases Refinery Procurement Dashboard in Power BI
Advantages of Refinery Procurement Dashboard in Power BI
Using this dashboard delivers measurable business benefits.
Key Advantages
-
✅ Centralized Procurement Visibility – Track all procurement KPIs in one place
-
✅ Real-Time Insights – Make decisions using live and updated data
-
✅ Cost Optimization – Identify high unit costs and negotiate better pricing
-
✅ Improved Supplier Management – Monitor lead times and supplier performance
-
✅ Faster Decision-Making – Eliminate manual reporting delays
Therefore, refineries achieve higher procurement efficiency and cost control.
Best Practices for the Refinery Procurement Dashboard in Power BI
To maximize value, organizations should follow these best practices.
Recommended Best Practices
-
📌 Define clear procurement KPIs before dashboard design
-
📌 Use standardized data sources for accuracy
-
📌 Apply slicers for refinery, department, supplier, and time
-
📌 Review dashboards regularly for insights and improvements
-
📌 Train procurement teams to interpret visuals correctly
As a result, the dashboard delivers consistent and actionable insights.
How Does This Dashboard Support Data-Driven Procurement Decisions?
This dashboard converts raw procurement data into meaningful visuals. Therefore, leaders can:
-
Detect invoice disputes early
-
Reduce procurement lead time
-
Control material unit costs
-
Improve supplier accountability
-
Forecast procurement budgets accurately
Consequently, refineries shift from reactive decisions to proactive procurement planning.
Conclusion
A Refinery Procurement Dashboard in Power BI is no longer optional for modern refineries. Instead, it acts as a strategic tool that improves transparency, efficiency, and cost control. By using structured visuals, real-time data, and focused analysis pages, procurement teams gain clarity and confidence in every decision.
When refineries adopt this dashboard, they reduce risks, optimize spending, and strengthen supplier relationships. Therefore, investing in a Power BI procurement dashboard directly supports long-term operational success.
Frequently Asked Questions (FAQs)
Click to Purchases Refinery Procurement Dashboard in Power BI
What is the main purpose of a Refinery Procurement Dashboard in Power BI?
The main purpose is to track procurement KPIs, supplier performance, costs, and trends in a centralized and interactive platform.
Who should use this procurement dashboard?
Procurement managers, supply chain teams, finance teams, and refinery leadership can all benefit from this dashboard.
Can this dashboard handle large procurement datasets?
Yes, Power BI efficiently processes large datasets and delivers fast, interactive analytics.
Does this dashboard support real-time data updates?
Yes, when connected to live data sources, the dashboard refreshes automatically.
Can the dashboard be customized for specific refinery needs?
Absolutely. Users can add KPIs, filters, and visuals based on refinery procurement requirements.
Visit our YouTube channel to learn step-by-step video tutorials