Smart cities continue to transform the way governments plan, execute, and monitor urban development projects. From infrastructure upgrades to digital services, every smart city initiative depends heavily on well-managed contracts. However, managing hundreds of contracts across departments, cities, and vendors becomes challenging when data stays scattered across spreadsheets and manual reports.
That is exactly why a Smart Cities Contract Management Dashboard in Excel plays a critical role. This ready-to-use Excel dashboard converts complex contract data into clear, visual, and actionable insights. Moreover, it helps decision-makers track performance, control costs, and improve accountability—without investing in expensive BI tools.
In this detailed, SEO-friendly article, you will learn everything about the Smart Cities Contract Management Dashboard in Excel. Additionally, you will understand its structure, features, advantages, best practices, and real-world use cases. By the end, you will clearly see how this dashboard supports smarter, faster, and more confident contract decisions.
Click to Purchases Smart Cities Contract Management Dashboard in Excel
What Is a Smart Cities Contract Management Dashboard in Excel?
A Smart Cities Contract Management Dashboard in Excel is a structured and interactive reporting solution designed to monitor, analyze, and manage contract-related KPIs for smart city projects. It consolidates contract data into a single Excel file and presents insights through cards, charts, and slicers.
Instead of reviewing lengthy contract registers or static reports, stakeholders can instantly see:
-
Active contract percentage
-
Planned versus actual contract cost
-
Cost variance across departments and cities
-
Contract delays and completion rates
As a result, contract governance improves significantly. Furthermore, teams save time and reduce errors because Excel automates calculations and visualizations.
Why Do Smart City Projects Need Contract Management Dashboards?
Smart city projects involve multiple stakeholders, departments, and vendors. Therefore, contract complexity increases rapidly. Without a centralized dashboard, teams face several challenges.
Common Contract Management Challenges in Smart Cities
-
Lack of real-time visibility into contract performance
-
Difficulty tracking cost overruns and delays
-
Poor coordination across departments and cities
-
Manual reporting that consumes valuable time
-
Delayed decision-making due to unclear insights
However, a Smart Cities Contract Management Dashboard in Excel solves these issues effectively. Because Excel remains widely used and accessible, organizations adopt this dashboard quickly without major training or infrastructure costs.
How Does a Smart Cities Contract Management Dashboard in Excel Work?
This dashboard works by connecting structured contract data with interactive visual elements. First, users maintain contract records in a dedicated Data Sheet. Then, Excel formulas, pivot tables, and charts transform raw data into meaningful insights.
Additionally, the dashboard includes a Page Navigator and right-side slicers, which allow users to filter data by department, city, contract type, or month. As a result, analysis becomes faster and more focused.
What Are the Key Features of the Smart Cities Contract Management Dashboard in Excel?
This ready-to-use dashboard includes thoughtfully designed features that support deep analysis while remaining easy to use.
How Does the Page Navigator Improve Usability?
The Page Navigator, located on the left side of the dashboard, allows users to move seamlessly between analytical pages. Instead of scrolling or searching for sheets, users jump directly to the required analysis page with one click.
Because of this feature, navigation becomes intuitive and user-friendly, even for non-technical users.
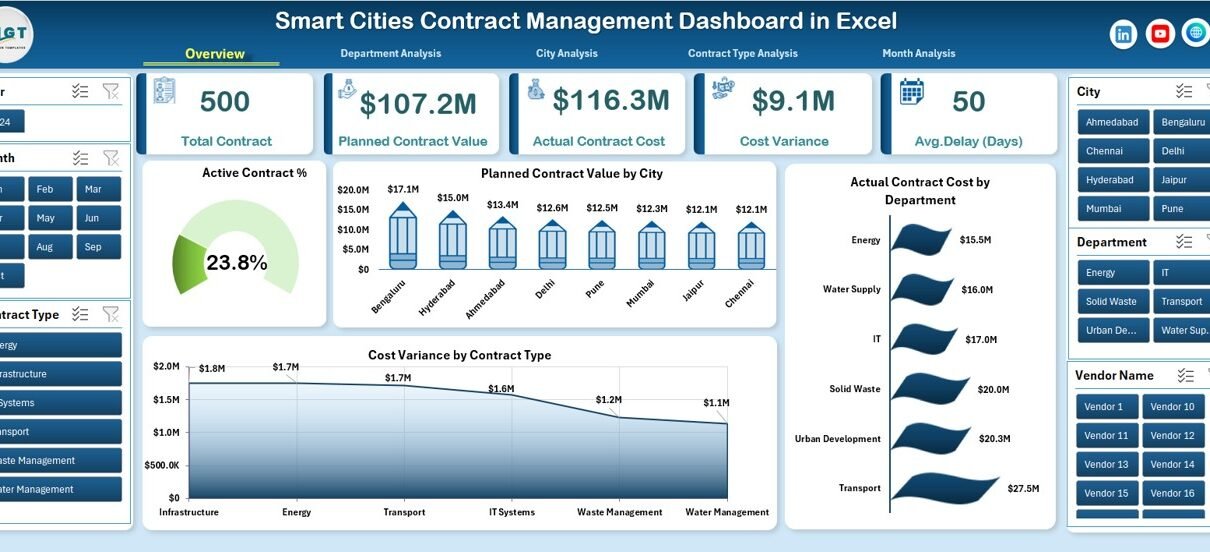
What Insights Does the Overview Page Provide?
Overview Page: The Executive Summary
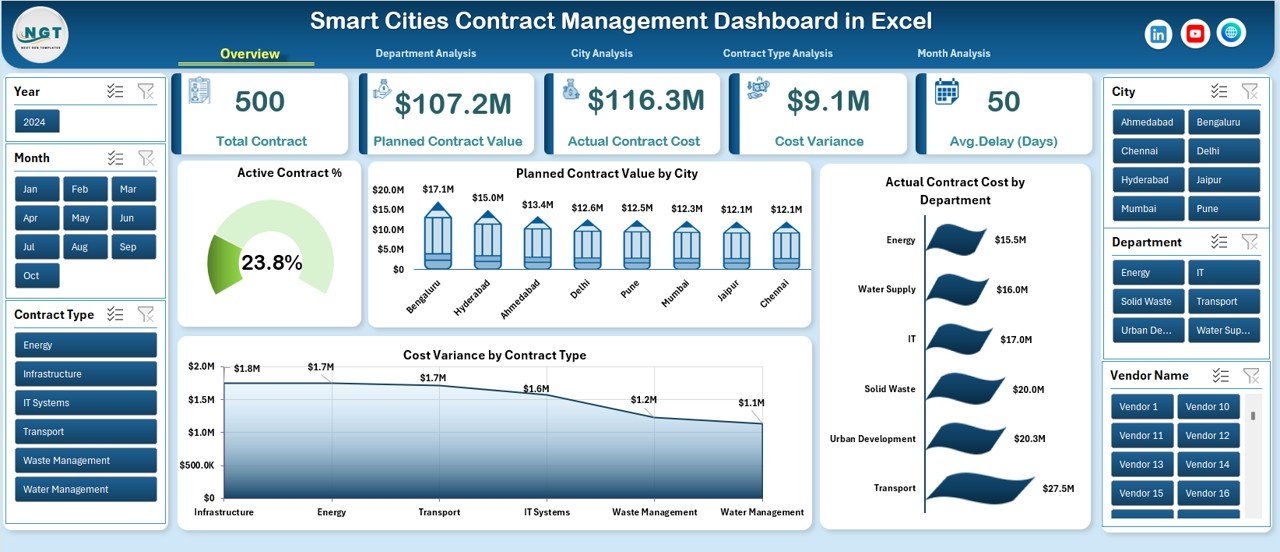
The Overview Page acts as the main landing page of the dashboard. It provides a high-level snapshot of contract performance across the smart city ecosystem.
Key Elements on the Overview Page
Right-Side Slicer
-
Enables quick filtering by city, department, contract type, or time period
KPI Cards
-
Active Contract %
-
Other high-level contract indicators
Charts Included
-
📊 Active Contract %
-
📊 Planned Contract Value by City
-
📊 Actual Contract Cost by Department
-
📊 Cost Variance by Contract Type
Because all critical metrics appear in one place, decision-makers gain instant clarity. Moreover, this page supports quick presentations and executive reviews.
How Does Department Analysis Help Contract Governance?
Click to Purchases Smart Cities Contract Management Dashboard in Excel
Department Analysis Page Explained
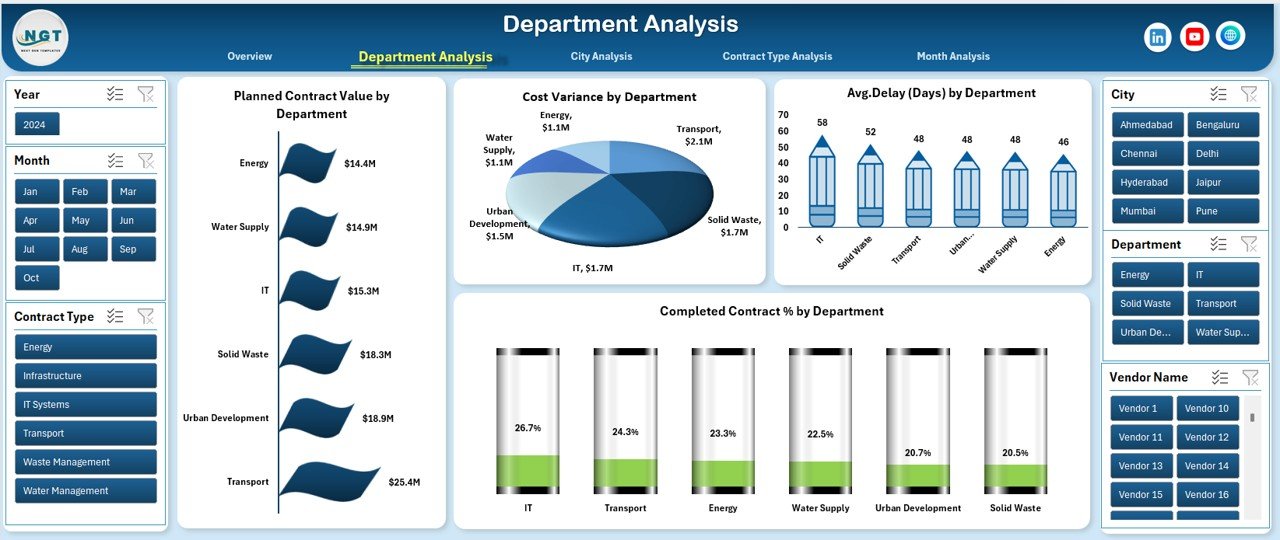
The Department Analysis page focuses on contract performance at the departmental level. Since smart city projects span multiple departments, this view becomes essential for accountability and optimization.
Charts on the Department Analysis Page
-
📈 Planned Contract Value by Department
-
📉 Cost Variance by Department
-
⏱️ Average Delay by Department
-
✅ Completed Contract % by Department
With these visuals, managers can quickly identify which departments perform well and which ones require intervention. Additionally, the dashboard supports data-driven discussions instead of assumptions.
Why Is City-Level Contract Analysis Important?
City Analysis Page Overview

Smart city initiatives often span multiple cities or regions. Therefore, city-level contract insights play a crucial role in planning and benchmarking.
Charts on the City Analysis Page
-
📊 Actual Contract Cost by City
-
📊 Cost Variance by City
-
⏳ Average Delay by City
-
📌 Active Contract % by City
This page helps stakeholders compare cities side by side. Furthermore, it highlights best-performing cities and flags locations where projects face delays or cost overruns.
How Does Contract Type Analysis Improve Strategic Decisions?
Contract Type Analysis Page
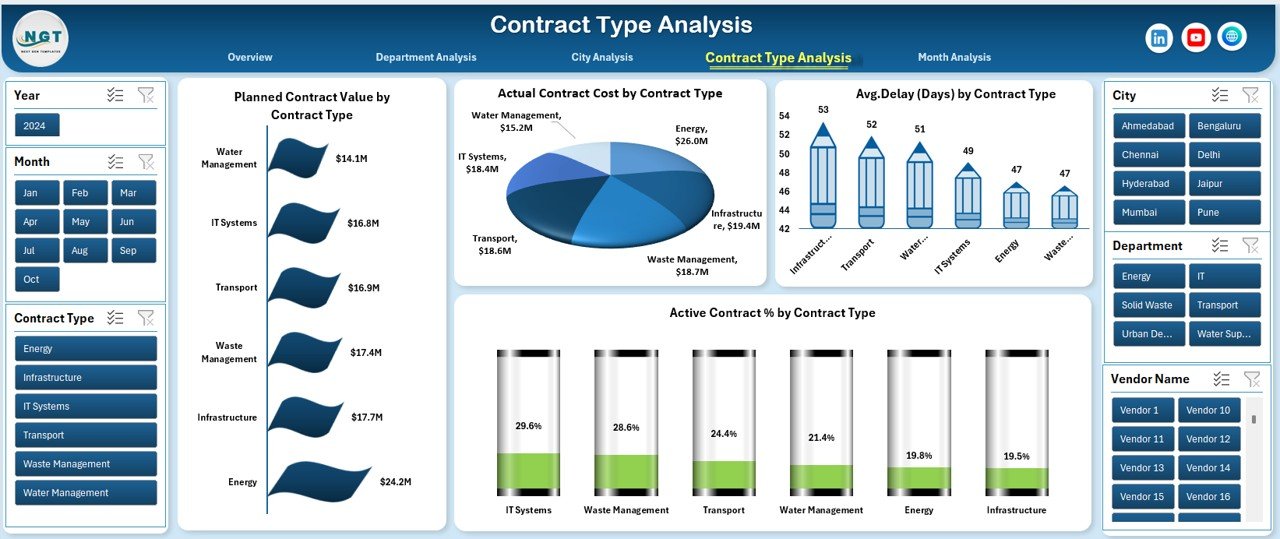
Different contract types—such as infrastructure, IT, maintenance, or consulting—behave differently in terms of cost and timelines. Therefore, analyzing contracts by type adds strategic depth.
Charts Included
-
📈 Planned Contract Value by Contract Type
-
📉 Actual Contract Cost by Contract Type
-
⏱️ Average Delay by Contract Type
-
📌 Active Contract % by Contract Type
With this analysis, organizations identify which contract types deliver better value and which ones need tighter controls. Consequently, future contract planning becomes more effective.
What Trends Does the Month Analysis Page Reveal?
Month Analysis Page Overview
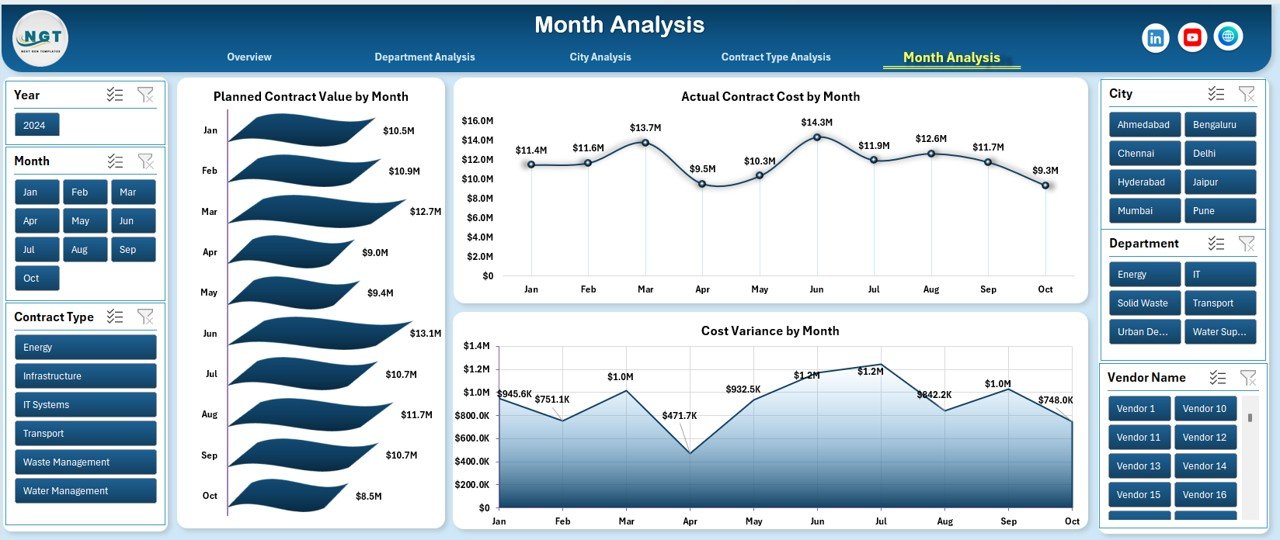
The Month Analysis page focuses on time-based trends. It helps teams understand how contract values and costs change throughout the year.
Charts on the Month Analysis Page
-
📅 Planned Contract Value by Month
-
📅 Actual Contract Cost by Month
-
📅 Cost Variance by Month
Because trends become visible instantly, planners can forecast future costs and allocate budgets more accurately.
What Is the Role of the Data and Support Sheets?
Data Sheet
The Data Sheet acts as the backbone of the dashboard. It stores structured contract records such as:
-
Contract ID
-
Department
-
City
-
Contract Type
-
Planned Contract Value
-
Actual Contract Cost
-
Start and End Dates
-
Delay Days
-
Contract Status
By maintaining clean and consistent data here, the dashboard updates automatically.
Support Sheet
The Support Sheet helps manage dropdowns, mappings, and helper calculations. It ensures smooth functioning of slicers and charts without cluttering the main data.
Advantages of Smart Cities Contract Management Dashboard in Excel
A Smart Cities Contract Management Dashboard in Excel offers several practical benefits.
Key Advantages
-
✅ Centralized contract monitoring across cities and departments
-
✅ Real-time visibility into cost and performance metrics
-
✅ Easy-to-use Excel interface with no extra software costs
-
✅ Interactive analysis using slicers and charts
-
✅ Improved accountability and transparency
-
✅ Faster decision-making with clear visuals
-
✅ Scalable structure for future smart city expansion
Because of these advantages, many public sector organizations prefer Excel-based dashboards for contract management.
How Does This Dashboard Support Smart City Decision-Making?
This dashboard supports smarter decisions by presenting data in a visual and structured format. Instead of relying on intuition, leaders rely on facts.
Additionally, the dashboard enables:
-
Early identification of cost overruns
-
Monitoring of contract delays before escalation
-
Performance benchmarking across cities and departments
-
Strategic planning for future contracts
As a result, smart city governance becomes proactive rather than reactive.
Best Practices for the Smart Cities Contract Management Dashboard in Excel
Click to Purchases Smart Cities Contract Management Dashboard in Excel
To maximize the value of this dashboard, organizations should follow proven best practices.
Best Practices You Should Follow
-
📌 Maintain clean and standardized contract data
-
📌 Update the data sheet regularly
-
📌 Use consistent naming for departments and cities
-
📌 Review cost variance metrics frequently
-
📌 Analyze delays and take corrective actions early
-
📌 Share dashboard insights with stakeholders regularly
-
📌 Archive completed contracts for historical analysis
By following these best practices, teams ensure accuracy, reliability, and long-term usefulness of the dashboard.
Who Can Use the Smart Cities Contract Management Dashboard in Excel?
This dashboard suits a wide range of users involved in smart city projects.
Ideal Users
-
Smart city project managers
-
Government procurement teams
-
Urban planning departments
-
Finance and contract management teams
-
Policy-makers and city administrators
-
Consultants working on smart city initiatives
Because Excel remains familiar to most users, adoption becomes smooth and fast.
Conclusion: Why Smart Cities Need Contract Dashboards in Excel
Managing contracts effectively determines the success of smart city projects. Without visibility, costs rise and delays increase. However, a Smart Cities Contract Management Dashboard in Excel changes the game.
This ready-to-use dashboard delivers clarity, control, and confidence. Moreover, it empowers teams to monitor performance, control budgets, and improve accountability using a familiar tool. Therefore, for organizations seeking a cost-effective yet powerful contract management solution, this Excel dashboard becomes an essential asset.
Frequently Asked Questions (FAQs)
What is a Smart Cities Contract Management Dashboard in Excel?
It is an Excel-based reporting tool that tracks and analyzes contract KPIs for smart city projects using interactive charts and slicers.
Can non-technical users use this dashboard?
Yes, the dashboard uses simple Excel features, making it easy for non-technical users to operate and understand.
Does the dashboard update automatically?
Yes, once you update the data sheet, all charts and KPIs update automatically.
Can this dashboard handle multiple cities and departments?
Absolutely. The dashboard includes slicers and analysis pages designed specifically for multi-city and multi-department projects.
Is Excel suitable for large smart city projects?
Yes, Excel works well for small to mid-sized datasets and offers flexibility, accessibility, and low cost.
Can organizations customize this dashboard?
Yes, teams can easily add new KPIs, charts, or pages based on project needs.
Why choose Excel instead of BI tools for contract management?
Excel offers faster deployment, lower cost, and familiarity, making it ideal for many public sector and smart city teams.
Visit our YouTube channel to learn step-by-step video tutorials