Virtual events have become a core part of modern marketing, training, and community engagement strategies. Webinars, virtual conferences, online workshops, and digital product launches now reach global audiences with ease. However, running virtual events without measuring performance leads to missed insights and unclear results.
That is exactly why a Virtual Events KPI Scorecard in Excel becomes a critical performance management tool.
This ready-to-use Excel scorecard helps event teams track key performance indicators, compare actual results against targets, analyze trends, and make data-driven decisions. Moreover, Excel keeps the scorecard flexible, visual, and easy to maintain.
In this detailed guide, you will learn what a Virtual Events KPI Scorecard in Excel is, why it is important, how it works, its advantages, best practices, and how to use it effectively. In addition, you will find frequently asked questions at the end for complete clarity.
Click to Purchases Virtual Events KPI Scorecard in Excel
What Is a Virtual Events KPI Scorecard in Excel?
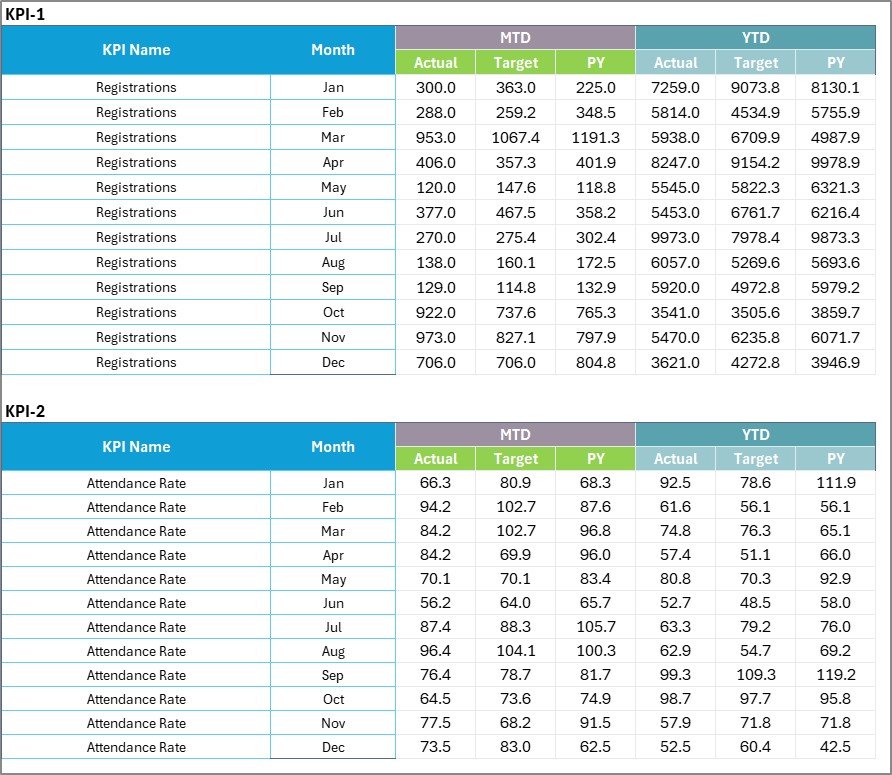
A Virtual Events KPI Scorecard in Excel is a structured performance tracking tool designed to measure the success of virtual events using clearly defined KPIs. It helps teams monitor engagement, attendance, conversion, satisfaction, and operational efficiency in one centralized dashboard.
Instead of relying on raw reports from multiple platforms, this scorecard consolidates KPI data into an interactive Excel file. As a result, teams gain visibility into both Month-to-Date (MTD) and Year-to-Date (YTD) performance.
Because Excel supports formulas, dropdowns, charts, and conditional formatting, this scorecard delivers powerful insights without complex software.
Why Do Virtual Events Need a KPI Scorecard?
Virtual events generate large volumes of data. Attendance numbers, engagement rates, feedback scores, and conversions all matter. Without a KPI scorecard, teams struggle to connect these metrics to actual performance outcomes.
Organizations need a Virtual Events KPI Scorecard in Excel because it:
-
Measures event success objectively
-
Tracks performance against defined targets
-
Identifies high-performing and underperforming KPIs
-
Supports continuous improvement
-
Improves decision-making with data
-
Creates a single source of truth
As virtual events scale, performance measurement becomes essential.
How Does a Virtual Events KPI Scorecard in Excel Work?
The scorecard works through a structured and user-friendly design. It separates KPI configuration, data entry, trend analysis, and performance review into dedicated worksheets.
This template includes four worksheets, each serving a specific purpose.
Click to Purchases Virtual Events KPI Scorecard in Excel
What Worksheets Are Included in the Virtual Events KPI Scorecard Template?
1. Scorecard Sheet – Main Performance Dashboard
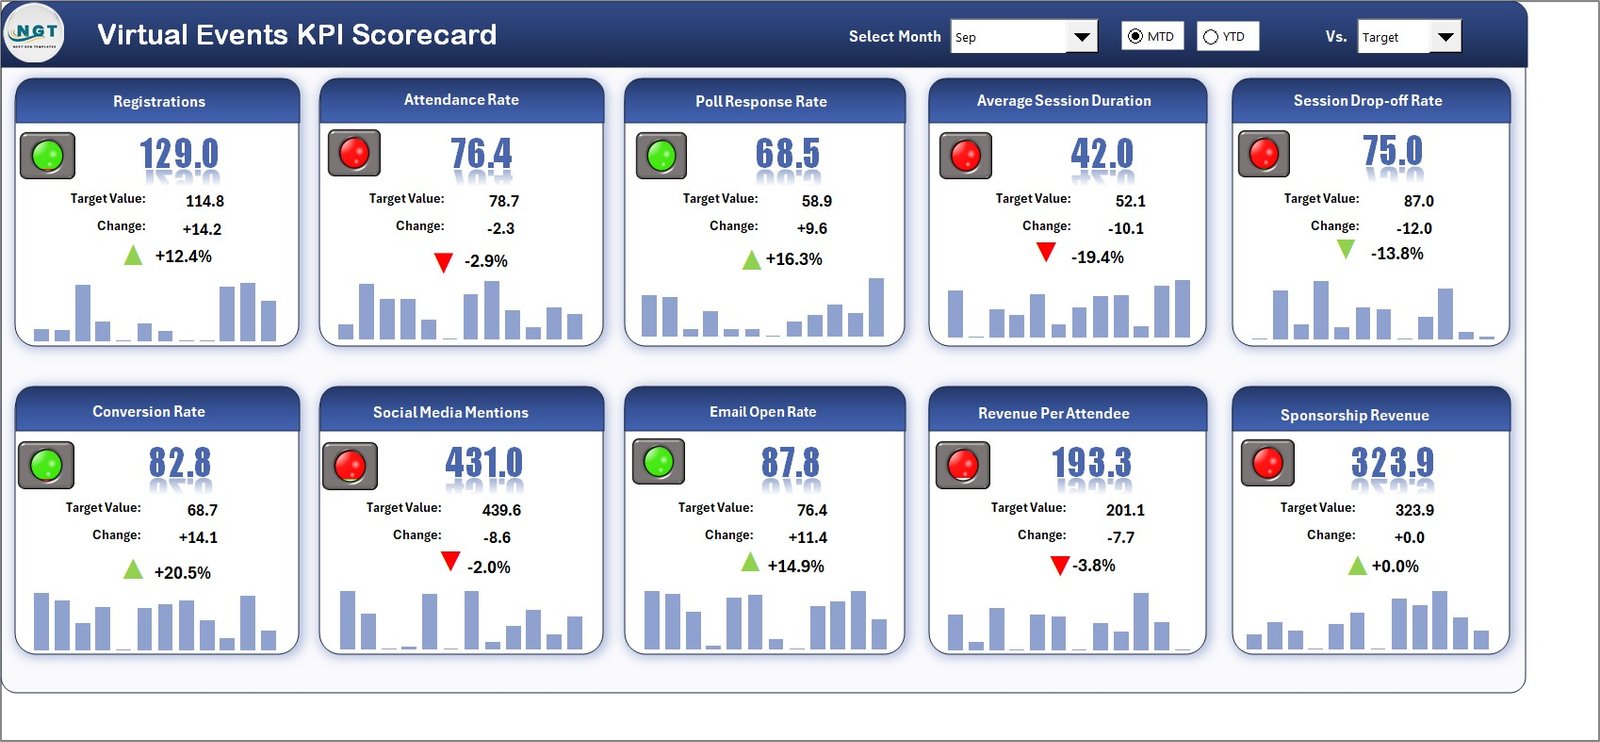
The Scorecard Sheet is the primary interface where users view KPI performance at a glance.
Key Features of the Scorecard Sheet
-
Dropdown Menus
Users can select:-
Month
-
MTD (Month-to-Date)
-
YTD (Year-to-Date)
These selections dynamically update the entire scorecard.
-
-
Actual vs Target Comparison
Each KPI displays actual performance against defined targets, making gaps visible instantly. -
Visual Performance Indicators
Color-coded visuals and conditional formatting highlight:-
On-track KPIs
-
Underperforming KPIs
-
Exceeding targets
-
-
Comprehensive KPI Overview
The scorecard displays all KPIs with MTD and YTD values in one structured view.
Because of this layout, decision-makers can assess virtual event performance within seconds.
2. KPI Trend Sheet Tab – Performance Trend Analysis
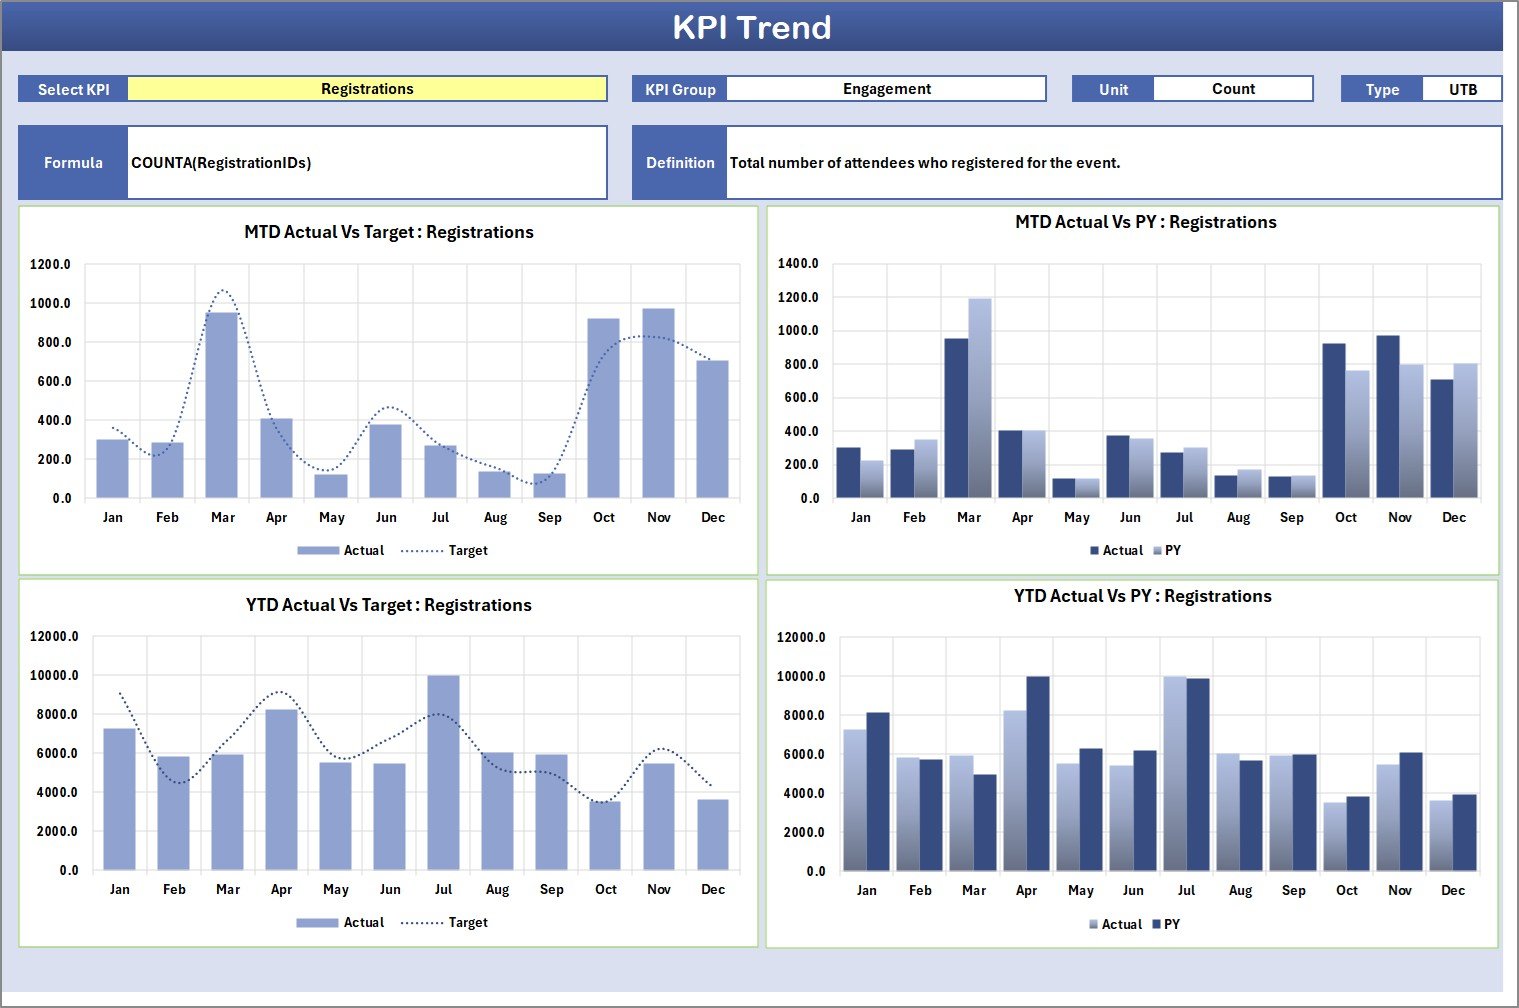
The KPI Trend sheet focuses on historical performance and trend analysis.
Key Features of the KPI Trend Sheet
-
KPI Selection Dropdown
Users select a KPI name from the dropdown available in cell C3. -
KPI Metadata Display
Once selected, the sheet displays:-
KPI Group
-
KPI Unit
-
KPI Type (Lower the Better or Upper the Better)
-
KPI Formula
-
KPI Definition
-
-
MTD and YTD Trend Charts
The sheet shows trend charts for:-
Actual values
-
Target values
-
Previous Year (PY) values
-
Because of these visuals, teams easily identify performance patterns, improvements, and declines.
Click to Purchases Virtual Events KPI Scorecard in Excel
3. Input Data Sheet – KPI Data Entry Area
The Input Data Sheet acts as the data foundation for the entire scorecard.
Key Features of the Input Data Sheet
-
Centralized Data Entry
Users record:-
Actual KPI values
-
Target values
-
Monthly data points
-
-
Flexible Updates
Teams can update data as new event results become available. -
Automatic Scorecard Refresh
Once data is updated, all scorecard visuals and calculations update automatically.
This design ensures the scorecard always reflects the latest performance.
4. KPI Definition Sheet Tab – KPI Governance Layer

The KPI Definition Sheet ensures clarity and consistency across the scorecard.
Information Captured in KPI Definition Sheet
-
KPI Name
-
KPI Group
-
KPI Unit
-
KPI Formula
-
KPI Definition
Because of this structure, users clearly understand what each KPI measures and how calculations work.
How Does This KPI Scorecard Improve Virtual Event Performance?
A Virtual Events KPI Scorecard in Excel improves performance by creating visibility, accountability, and insight.
First, it aligns teams around measurable goals.
Second, it highlights gaps between actual and target performance.
Third, it supports trend-based decision-making.
Finally, it drives continuous improvement through structured reviews.
As a result, virtual events become more strategic and results-driven.
Click to Purchases Virtual Events KPI Scorecard in Excel
Who Can Use a Virtual Events KPI Scorecard in Excel?
This scorecard suits a wide range of users and industries.
Common users include:
-
Marketing teams
-
Event managers
-
Training and L&D teams
-
Webinar hosts
-
Community managers
-
Product marketing teams
-
Small businesses
-
Large enterprises
Because Excel remains widely used, adoption remains simple and fast.
Advantages of Virtual Events KPI Scorecard in Excel
Using a Virtual Events KPI Scorecard in Excel offers multiple advantages.
1. Centralized Performance Tracking
All KPIs stay in one structured dashboard, eliminating scattered reports.
2. Clear Target Alignment
Actual vs target comparison keeps performance expectations clear.
3. Visual Performance Insights
Color indicators and charts make insights easy to understand.
4. Trend-Based Decision Making
MTD and YTD trend analysis supports strategic planning.
5. Easy Customization
Teams can easily add or modify KPIs as event goals evolve.
6. Cost-Effective Solution
Excel removes the need for expensive analytics platforms.
7. Improved KPI Governance
Defined formulas and definitions improve KPI accuracy and trust.
Click to Purchases Virtual Events KPI Scorecard in Excel
How to Use the Virtual Events KPI Scorecard in Excel Step by Step?
Follow these steps to use the scorecard effectively.
Step 1: Define KPIs
List all virtual event KPIs in the KPI Definition sheet.
Step 2: Enter Data
Record monthly actual and target values in the Input Data sheet.
Step 3: Review the Scorecard
Use the Scorecard sheet to analyze performance visually.
Step 4: Analyze Trends
Select KPIs in the KPI Trend sheet to review MTD and YTD trends.
Step 5: Take Action
Use insights to improve engagement, content, and execution.
What KPIs Can a Virtual Events Scorecard Track?
This scorecard supports a wide range of virtual event KPIs, including:
-
Event registrations
-
Attendance rate
-
Engagement rate
-
Drop-off rate
-
Average watch time
-
Feedback score
-
Conversion rate
-
Cost per attendee
-
Repeat attendee rate
Teams can customize KPIs based on event goals.
Best Practices for the Virtual Events KPI Scorecard in Excel
Follow these best practices to maximize value.
1. Keep KPIs Relevant
Track only KPIs that align with event objectives.
2. Set Realistic Targets
Targets should motivate improvement, not discourage teams.
3. Update Data Consistently
Regular updates ensure accurate insights.
4. Review Trends, Not Just Numbers
Trends reveal deeper performance patterns.
5. Protect Formula Cells
Protect calculation cells to avoid accidental errors.
6. Review Scorecard After Every Event
Post-event reviews drive continuous improvement.
7. Train Users Briefly
Short training improves scorecard adoption.
Click to Purchases Virtual Events KPI Scorecard in Excel
Common Mistakes to Avoid When Using a Virtual Events KPI Scorecard
Avoid these common mistakes:
-
Tracking too many KPIs
-
Ignoring target benchmarks
-
Updating data inconsistently
-
Skipping trend analysis
-
Treating the scorecard as static
Avoiding these mistakes ensures long-term success.
How Does This Scorecard Support Strategic Decision-Making?
This KPI scorecard transforms raw data into actionable insights.
Leaders can:
-
Identify top-performing event formats
-
Optimize content and timing
-
Improve audience engagement
-
Allocate budgets effectively
-
Improve ROI from virtual events
As a result, event strategy becomes data-driven.
Click to Purchases Virtual Events KPI Scorecard in Excel
Conclusion: Why You Need a Virtual Events KPI Scorecard in Excel
A Virtual Events KPI Scorecard in Excel helps organizations move from guesswork to measurable performance. With structured KPI definitions, accurate data entry, trend analysis, and visual dashboards, teams gain full control over virtual event success.
Because Excel offers flexibility, affordability, and ease of use, this scorecard becomes an essential tool for any organization running virtual events.
If you want to improve virtual event outcomes consistently, this KPI scorecard is a must-have solution.
Frequently Asked Questions (FAQs)
What is a Virtual Events KPI Scorecard in Excel?
It is an Excel-based dashboard used to measure and analyze virtual event performance using KPIs.
Is this scorecard suitable for beginners?
Yes, anyone with basic Excel knowledge can use it easily.
Can I customize KPIs in the scorecard?
Yes, you can add, remove, or modify KPIs based on event goals.
How does MTD and YTD analysis help?
MTD shows short-term performance, while YTD reveals long-term trends.
Can this scorecard handle multiple events?
Yes, with structured input data, it can track performance across events.
Does this scorecard support management reporting?
Yes, the visual dashboard supports executive-level reporting.
Is this scorecard suitable for small businesses?
Absolutely. Small teams benefit greatly from structured KPI tracking.
Click to Purchases Virtual Events KPI Scorecard in Excel
Visit our YouTube channel to learn step-by-step video tutorials