The cosmetics and skincare industry grows rapidly every year. New brands enter the market, customer preferences change quickly, and competition increases constantly. Therefore, businesses must track sales, profit, discounts, brands, stores, and product categories very closely. However, when data stays scattered across multiple Excel files or manual reports, decision-making becomes slow and risky.
That is exactly why a Cosmetics and Skincare Dashboard in Excel becomes an essential business tool.
In this detailed and SEO-friendly guide, you will learn what a Cosmetics and Skincare Dashboard in Excel is, how it works, why it matters, and how each dashboard page supports data-driven decisions. Moreover, you will explore its advantages, best practices, and frequently asked questions. By the end of this article, you will clearly understand how this ready-to-use Excel dashboard helps cosmetics and skincare businesses turn raw data into actionable insights.
Click to Purchases Cosmetics and Skincare Dashboard in Excel
What Is a Cosmetics and Skincare Dashboard in Excel?
A Cosmetics and Skincare Dashboard in Excel is a structured, interactive, and visual reporting solution designed to track and analyze key business metrics related to cosmetics and skincare operations.
Instead of reviewing long spreadsheets, this dashboard consolidates all critical metrics into one Excel file. As a result, business owners, sales managers, and analysts gain instant visibility into performance.
Moreover, Excel makes this dashboard flexible, affordable, and easy to maintain. You can update data regularly, refresh charts, and analyze trends without complex tools or coding.
Why Do Cosmetics and Skincare Businesses Need a Dashboard?
Cosmetics and skincare businesses handle large volumes of data every day. For example, they track sales by brand, product category, store, region, and month. Additionally, they monitor costs, discounts, and profit margins.
Without a dashboard, teams spend hours compiling reports. However, with a dashboard, teams focus on insights rather than manual work.
Here is why a dashboard matters:
-
It centralizes all performance data in one place
-
It highlights trends, risks, and opportunities instantly
-
It supports faster and smarter decision-making
-
It improves visibility across brands, stores, and regions
Therefore, a Cosmetics and Skincare Dashboard in Excel becomes a strategic advantage rather than just a reporting tool.
What Are the Key Features of the Cosmetics and Skincare Dashboard in Excel?
This ready-to-use dashboard includes multiple analytical pages, interactive slicers, visual charts, and structured data sheets. Each feature supports clear and meaningful analysis.
Let us explore the key features in detail.
How Does the Page Navigator Improve Dashboard Usability?
The Page Navigator, located on the left side of the dashboard, allows users to move easily between different analytical pages.
Instead of scrolling or searching manually, users can jump directly to the required section. As a result, navigation becomes faster and more intuitive.
Benefits of the Page Navigator:
-
Saves time while switching between pages
-
Improves user experience
-
Makes the dashboard more professional
-
Reduces confusion for first-time users
How Many Pages Does the Cosmetics and Skincare Dashboard Include?
The dashboard includes five analytical pages within the Excel desktop application file. Each page focuses on a specific business dimension.
Let us review each page one by one.
What Insights Does the Overview Page Provide?

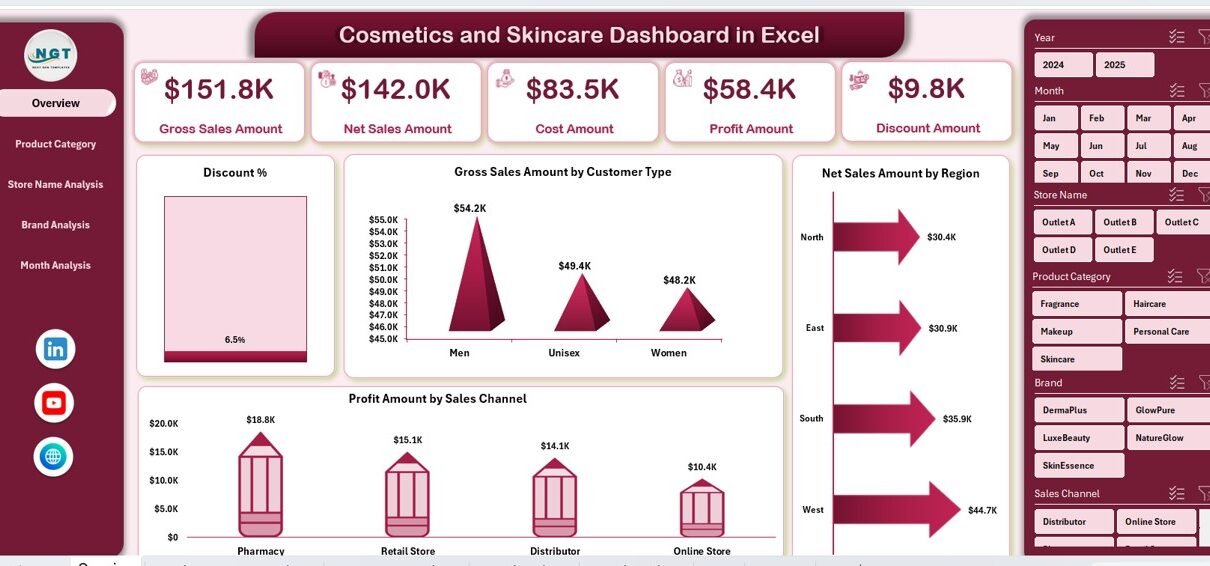
The Overview Page acts as the central summary of the dashboard. It provides a high-level snapshot of overall business performance.
Key Elements of the Overview Page:
-
Right-side slicer for filtering data
-
Four KPI cards for quick insights
-
Four analytical charts for performance analysis
Charts Available on the Overview Page:
-
Discount %
-
Gross Sales Amount by Customer Type
-
Net Sales Amount by Region
-
Profit Amount by Sales Channel
Because of this layout, decision-makers can understand business performance within seconds. Moreover, slicers allow instant filtering by key dimensions.
Why Is Product Category Analysis Important?
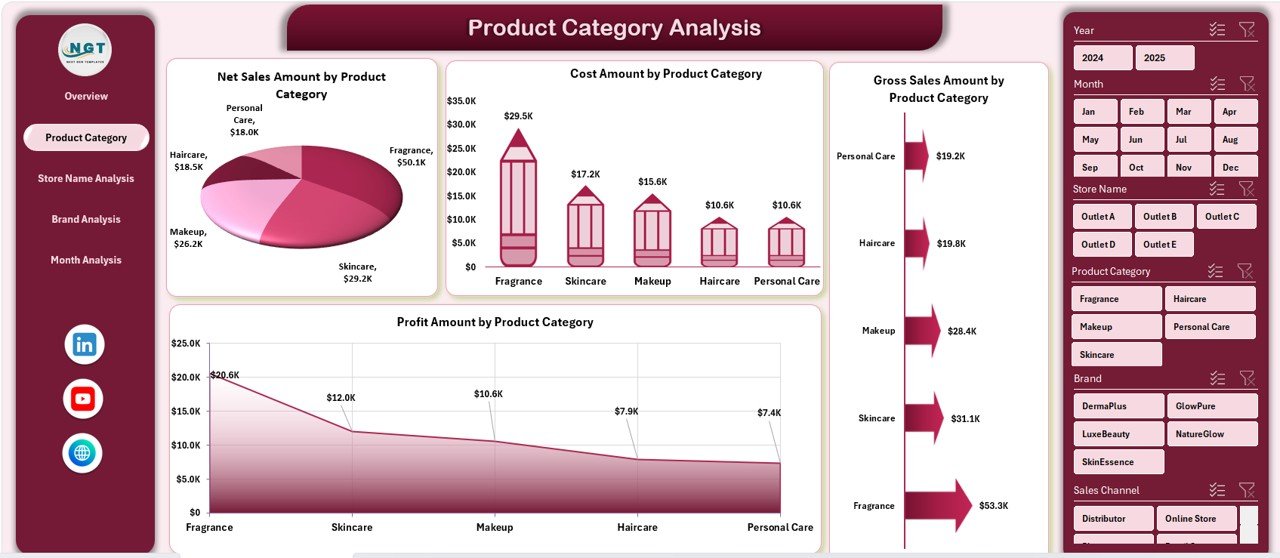
Product categories play a critical role in cosmetics and skincare businesses. Some categories generate high revenue, while others drive higher margins.
The Product Category Analysis Page focuses on understanding category-level performance.
Key Features of This Page:
-
Right-side slicer for dynamic filtering
-
Four detailed charts
Charts Included:
-
Net Sales Amount by Product Category
-
Cost Amount by Product Category
-
Gross Sales Amount by Product Category
-
Profit Amount by Product Category
With this page, managers can quickly identify:
-
Top-performing categories
-
High-cost categories
-
Categories with low profit margins
As a result, businesses can optimize product portfolios effectively.
How Does Store Name Analysis Support Retail Decisions?
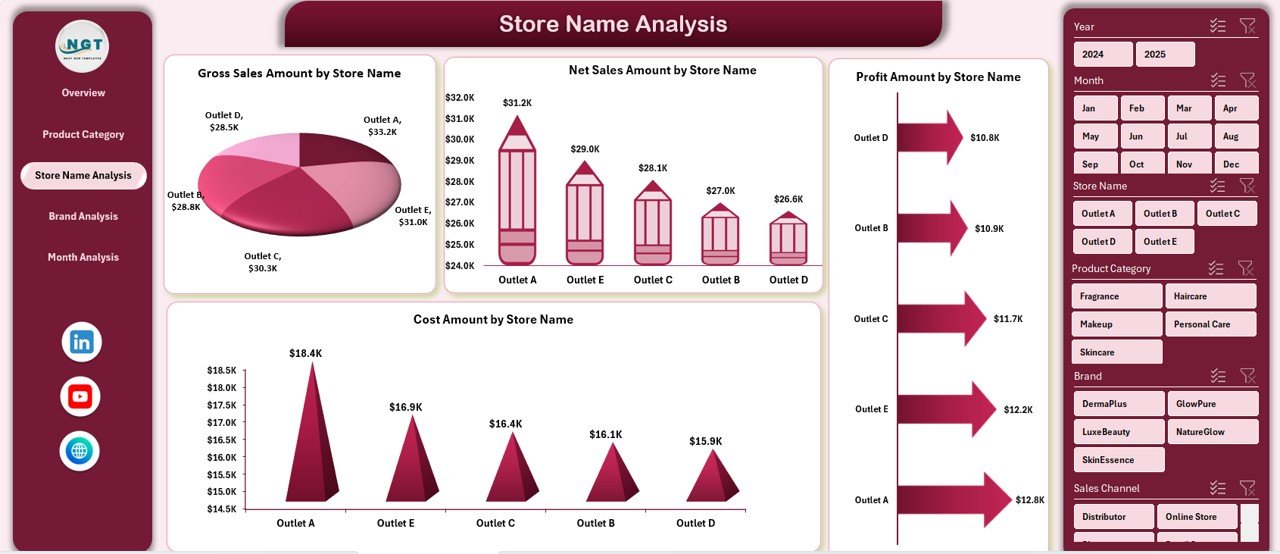
For cosmetics and skincare brands, store-level performance matters a lot. Some stores outperform others due to location, customer base, or promotions.
The Store Name Analysis Page helps analyze store-wise performance clearly.
Click to Purchases Cosmetics and Skincare Dashboard in Excel
Key Highlights:
-
Right-side slicer for easy filtering
-
Four store-level charts
Charts Included:
-
Net Sales Amount by Store Name
-
Cost Amount by Store Name
-
Gross Sales Amount by Store Name
-
Profit Amount by Store Name
This analysis helps businesses:
-
Identify top-performing stores
-
Detect underperforming locations
-
Adjust pricing or promotions store-wise
Why Is Brand Analysis Critical in the Cosmetics Industry?

Brand performance defines success in the cosmetics and skincare industry. Some brands attract loyal customers, while others struggle.
The Brand Analysis Page focuses on measuring brand-level performance.
Key Features:
-
Right-side slicer for flexible analysis
-
Four brand-focused charts
Charts Included:
-
Net Sales Amount by Brand
-
Cost Amount by Brand
-
Gross Brand by Store Name
-
Profit Amount by Brand
Using this page, teams can:
-
Compare brand profitability
-
Identify strong and weak brands
-
Plan brand-specific marketing strategies
How Does Month Analysis Help Track Business Trends?
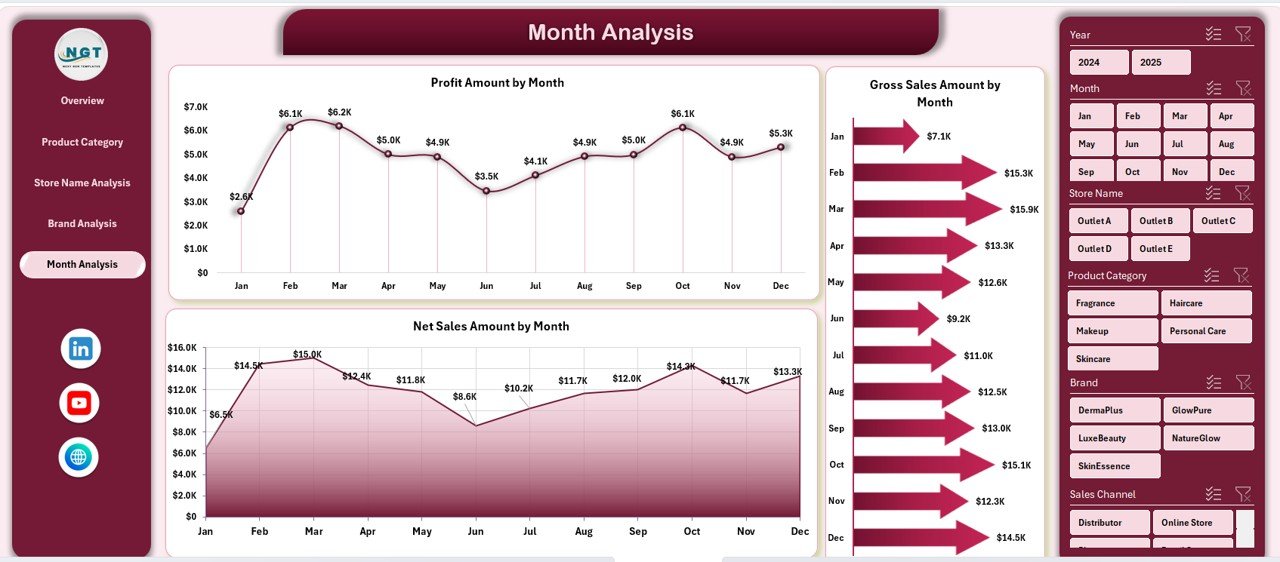
Seasonality plays a major role in cosmetics and skincare sales. Certain months perform better due to festivals, promotions, or weather changes.
The Month Analysis Page helps track trends over time.
Key Insights:
-
Right-side slicer for dynamic selection
-
Monthly performance charts
Charts Included:
-
Net Sales Amount by Month
-
Gross Brand by Month
-
Profit Amount by Month
This page allows businesses to:
-
Spot seasonal patterns
-
Compare month-over-month performance
-
Plan inventory and campaigns effectively
What Is the Role of the Data Sheet and Support Sheet?
Click to Purchases Cosmetics and Skincare Dashboard in Excel
Behind every dashboard lies structured data. The Data Sheet stores all transactional and master data used in the dashboard.
Meanwhile, the Support Sheet helps manage calculations, lookup tables, and intermediate logic.
Together, these sheets ensure:
-
Accurate calculations
-
Smooth dashboard performance
-
Easy data updates
Advantages of Cosmetics and Skincare Dashboard in Excel
Using a Cosmetics and Skincare Dashboard in Excel offers multiple business advantages.
Key Advantages:
-
Centralized reporting in one Excel file
-
Interactive slicers for flexible analysis
-
Clear visual charts for faster insights
-
Reduced manual reporting effort
-
Better control over sales, cost, and profit
-
Improved decision-making speed
Because Excel remains widely used, teams adopt this dashboard quickly without extensive training.
How Does This Dashboard Improve Decision-Making?
This dashboard transforms raw data into meaningful visuals. Therefore, managers no longer rely on assumptions.
Instead, they:
-
Compare actual performance across brands and stores
-
Identify cost leakages quickly
-
Monitor profit trends continuously
As a result, decisions become data-driven rather than intuitive.
Best Practices for the Cosmetics and Skincare Dashboard in Excel
To get maximum value from the dashboard, businesses should follow best practices.
Best Practices:
-
Update data regularly to maintain accuracy
-
Use slicers consistently for focused analysis
-
Review monthly and category trends frequently
-
Validate data before refreshing charts
-
Keep backup copies of the dashboard
-
Train users on navigation and interpretation
By following these practices, businesses ensure long-term dashboard reliability.
How Can Businesses Customize This Dashboard?
Although this dashboard comes ready to use, businesses can customize it easily.
They can:
-
Add new KPIs or charts
-
Modify slicers based on business needs
-
Adjust color themes to match branding
-
Expand analysis to new regions or stores
Because Excel supports flexibility, customization remains simple and cost-effective.
Who Should Use a Cosmetics and Skincare Dashboard in Excel?
This dashboard suits various roles across the organization.
Ideal Users:
-
Business owners
-
Sales managers
-
Retail managers
-
Finance teams
-
Marketing analysts
Each user gains insights relevant to their responsibilities.
How Does This Dashboard Support Growth and Scalability?
As businesses grow, data volume increases. However, this dashboard scales easily.
You can:
-
Add new data rows without changing structure
-
Extend time periods month by month
-
Include new brands or categories
Therefore, the dashboard grows with the business.
Conclusion
A Cosmetics and Skincare Dashboard in Excel offers a powerful, practical, and easy-to-use solution for tracking business performance. It consolidates sales, cost, profit, and trend analysis into a single, interactive Excel file.
Moreover, with pages like Overview, Product Category Analysis, Store Name Analysis, Brand Analysis, and Month Analysis, businesses gain complete visibility. As a result, teams make faster decisions, optimize strategies, and improve profitability.
If you want clarity, control, and confidence in your cosmetics and skincare data, this dashboard delivers exactly that.
Frequently Asked Questions (FAQs)
Click to Purchases Cosmetics and Skincare Dashboard in Excel
What is a Cosmetics and Skincare Dashboard in Excel?
A Cosmetics and Skincare Dashboard in Excel is a visual reporting tool that tracks sales, cost, profit, and trends using interactive charts and slicers.
Can beginners use this Excel dashboard easily?
Yes, the dashboard uses simple navigation, clear visuals, and Excel-native features, making it easy for beginners.
How often should data be updated in the dashboard?
You should update data regularly, preferably monthly or weekly, to keep insights accurate.
Can this dashboard handle large datasets?
Yes, Excel can handle large datasets efficiently when structured properly.
Can I customize this dashboard for my business?
Yes, you can modify charts, slicers, and KPIs to match your business needs.
Does this dashboard support decision-making?
Absolutely. It provides real-time insights that support faster and smarter business decisions.
Visit our YouTube channel to learn step-by-step video tutorials