Arbitration and mediation play a crucial role in resolving disputes efficiently, fairly, and cost-effectively. However, when organizations manage dispute resolution using scattered Excel files, emails, or static reports, visibility drops quickly. As a result, leadership struggles to understand performance, identify delays, and improve outcomes.
That is exactly where an Arbitration and Mediation KPI Dashboard in Power BI delivers real value.
In this in-depth and SEO-friendly article, you will learn what an Arbitration and Mediation KPI Dashboard in Power BI is, why it is important, how it works, and how each dashboard page supports smarter decision-making. Moreover, you will explore its advantages, best practices, and frequently asked questions. By the end of this guide, you will clearly understand how this ready-to-use Power BI dashboard helps legal teams, arbitration centers, and mediation professionals gain full control over dispute resolution performance.
Click to Purchases Arbitration and Mediation KPI Dashboard in Power BI
What Is an Arbitration and Mediation KPI Dashboard in Power BI?
An Arbitration and Mediation KPI Dashboard in Power BI is an interactive and data-driven analytics solution designed to track, monitor, and analyze key performance indicators related to arbitration and mediation activities.
Instead of manually reviewing case registers or static reports, this dashboard consolidates all arbitration and mediation KPIs into a single Power BI file. As a result, legal teams gain instant visibility into case volume, resolution efficiency, backlog status, and performance trends.
Moreover, Power BI adds strong interactivity. Users can filter data, drill through details, and analyze performance dynamically. At the same time, Excel remains the data source, making updates simple and flexible.
Why Is KPI Tracking Important in Arbitration and Mediation?
Arbitration and mediation processes involve time, cost, compliance, and multiple stakeholders. Therefore, tracking performance becomes essential.
KPI tracking helps organizations:
-
Measure how efficiently cases are resolved
-
Monitor pending cases and backlog growth
-
Compare actual performance against defined targets
-
Evaluate improvement against previous years
-
Improve transparency and accountability
Without KPIs, dispute resolution becomes reactive. With KPIs, it becomes measurable, predictable, and controllable.
Click to Purchases Arbitration and Mediation KPI Dashboard in Power BI
What Is the Purpose of an Arbitration and Mediation KPI Dashboard?
The main purpose of this dashboard is to convert raw case data into actionable insights.
This dashboard enables organizations to:
-
Track arbitration and mediation KPIs consistently
-
Monitor Month-to-Date (MTD) and Year-to-Date (YTD) performance
-
Compare current year results with previous year performance
-
Identify delays, inefficiencies, and risks early
-
Support data-driven legal and operational decisions
As a result, leadership can move from assumptions to facts.
Which KPIs Are Commonly Tracked in Arbitration and Mediation?
An Arbitration and Mediation KPI Dashboard in Power BI typically tracks KPIs such as:
-
Total Number of Cases
-
Number of Cases Resolved
-
Number of Pending Cases
-
Average Resolution Time
-
Settlement Success Rate
-
Compliance with Resolution Timelines
-
Cost per Case
-
Arbitrator or Mediator Utilization
Each KPI aligns with a specific objective such as efficiency, quality, cost control, or workload management.
How Does an Arbitration and Mediation KPI Dashboard in Power BI Work?
This dashboard works through Excel-based data input, Power BI modeling, and interactive visuals.
First, users enter data in structured Excel sheets. Then, Power BI connects to the Excel file and refreshes the dashboard. After that, slicers, visuals, and calculations update automatically.
Because Power BI handles calculations and visuals, users only need to maintain the Excel input sheets.
Click to Purchases Arbitration and Mediation KPI Dashboard in Power BI
What Pages Are Included in the Arbitration and Mediation KPI Dashboard in Power BI?
This ready-to-use dashboard includes three well-designed pages, each serving a clear analytical purpose.
Let us explore each page in detail.
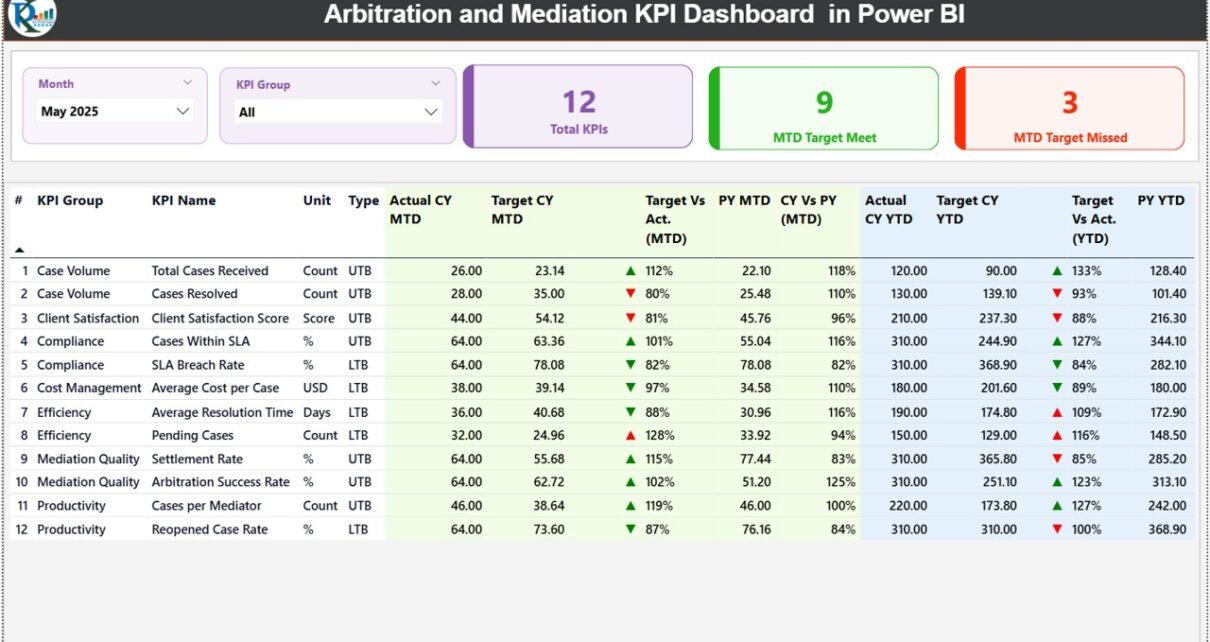
What Is the Summary Page and How Does It Help?
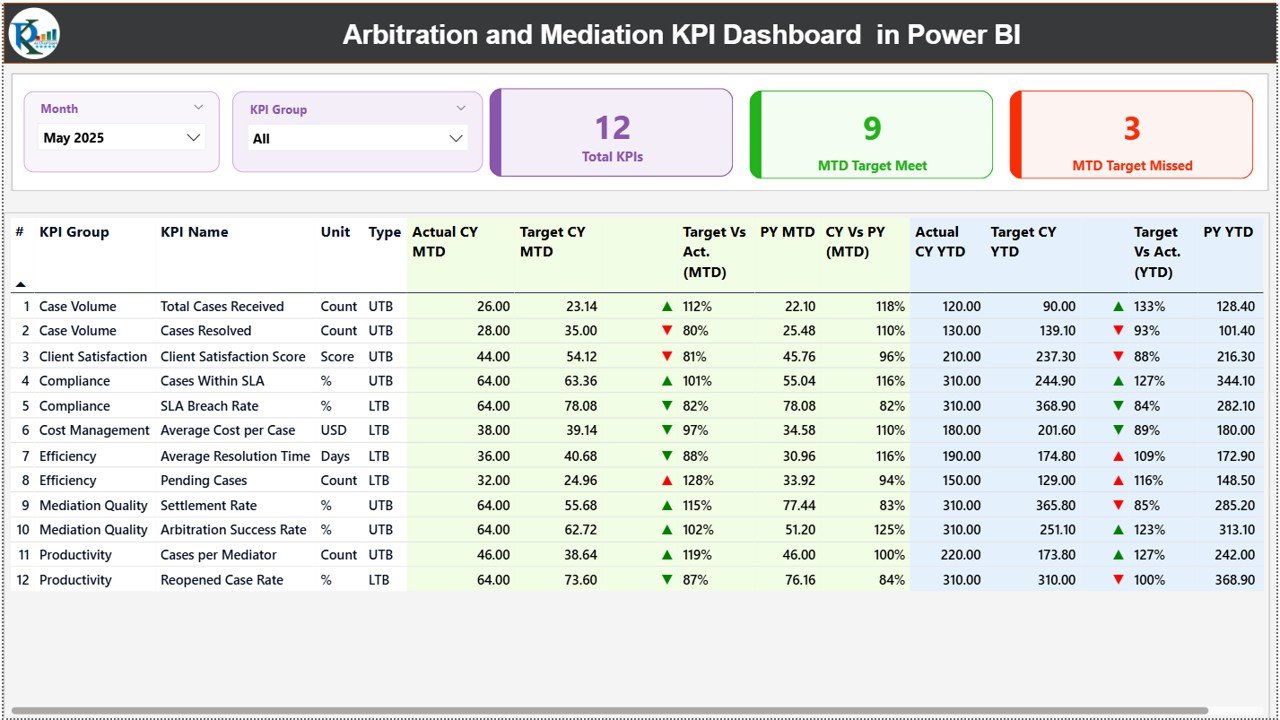
The Summary Page is the main page of the dashboard. It provides a consolidated overview of all arbitration and mediation KPIs.
Key Features of the Summary Page
-
Month Slicer
Allows users to select a specific month for analysis. -
KPI Group Slicer
Enables filtering KPIs by category or group. -
KPI Cards at the Top
Displays:-
Total KPIs Count
-
MTD Target Met Count
-
MTD Target Missed Count
-
Detailed KPI Table
Below the cards, a detailed table displays:
-
KPI Number
-
KPI Group
-
KPI Name
-
Unit
-
KPI Type (Lower the Better or Upper the Better)
-
Actual CY MTD
-
Target CY MTD
-
MTD Status Icon (▲ / ▼ with green or red color)
-
Target vs Actual (MTD %)
-
Previous Year MTD
-
CY vs PY (MTD %)
-
Actual CY YTD
-
Target CY YTD
-
YTD Status Icon
-
Target vs Actual (YTD %)
-
Previous Year YTD
-
CY vs PY (YTD %)
Why the Summary Page Is Critical
This page gives leadership a single-screen view of overall performance. Therefore, decision-makers can quickly identify:
-
Which KPIs perform well
-
Which KPIs miss targets
-
Where immediate action is required
What Is the KPI Trend Page and Why Is It Important?
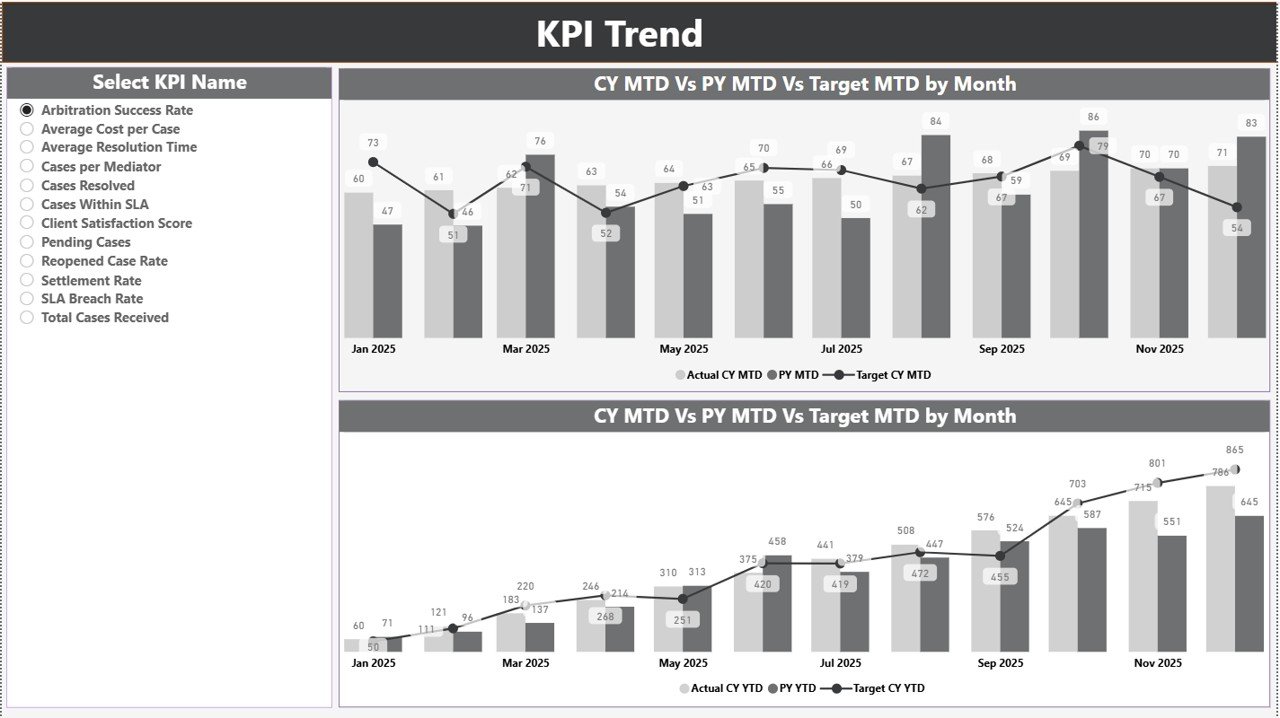
The KPI Trend Page focuses on performance trends over time.
Key Features of the KPI Trend Page
-
KPI Name Slicer on the left
-
Two combo charts:
-
MTD Actual vs Target vs Previous Year
-
YTD Actual vs Target vs Previous Year
-
Why Trend Analysis Matters
Trends reveal patterns that single numbers cannot show. Therefore, this page helps users:
-
Identify consistent delays or improvements
-
Compare current year performance with past performance
-
Understand seasonal or workload-driven fluctuations
As a result, teams can take proactive corrective actions.
Click to Purchases Arbitration and Mediation KPI Dashboard in Power BI
What Is the KPI Definition Page and How Does It Work?
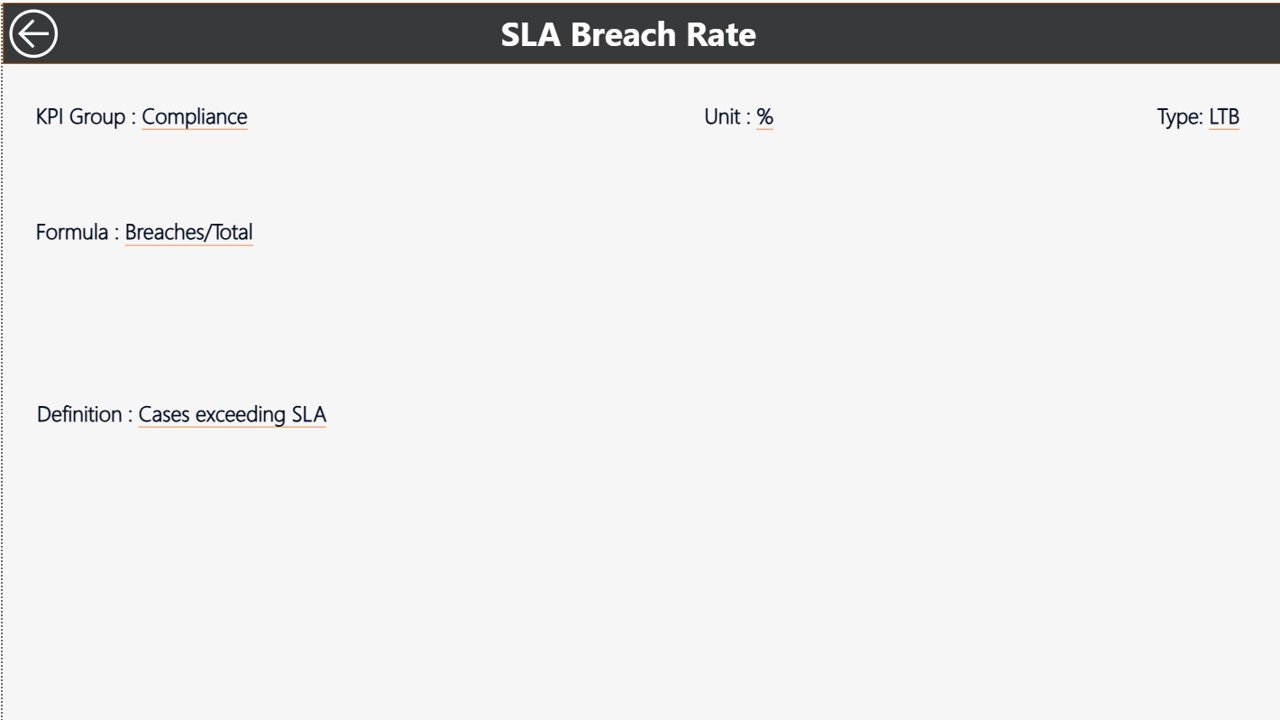
The KPI Definition Page is a drill-through page designed to provide detailed KPI context.
Key Features
-
Displays KPI Formula
-
Displays KPI Definition
-
Provides KPI clarity and consistency
This page remains hidden from normal navigation. Users can drill through from the Summary Page to view KPI details. To return, they simply click the back button at the top-left corner.
Why KPI Definitions Matter
Clear definitions ensure:
-
Consistent KPI interpretation
-
Reduced confusion across teams
-
Accurate reporting and analysis
What Is the Excel Data Source Used in This Dashboard?
This Power BI dashboard uses Excel as its data source, making data maintenance simple and flexible.
Input_Actual Sheet
In this sheet, users enter:
-
KPI Name
-
Month (first date of the month)
-
MTD Actual Value
-
YTD Actual Value
Input_Target Sheet
In this sheet, users enter:
-
KPI Name
-
Month (first date of the month)
-
MTD Target Value
-
YTD Target Value
KPI Definition Sheet
In this sheet, users enter:
-
KPI Number
-
KPI Group
-
KPI Name
-
Unit
-
Formula
-
Definition
-
Type (LTB or UTB)
Because Excel remains familiar to most users, data updates stay quick and error-free.
Click to Purchases Arbitration and Mediation KPI Dashboard in Power BI
Advantages of Arbitration and Mediation KPI Dashboard in Power BI
Using this dashboard offers several strategic benefits.
Key Advantages
-
Centralized Performance Monitoring
All arbitration and mediation KPIs stay in one dashboard. -
Interactive Analysis
Slicers and drill-through improve exploration. -
MTD and YTD Visibility
Track short-term and long-term performance easily. -
Target vs Actual Tracking
Instantly identify underperforming KPIs. -
Year-Over-Year Comparison
Measure improvement or decline clearly. -
Improved Transparency
Stakeholders gain clear performance insights. -
Excel-Driven Data Input
Simple updates without technical complexity.
How Does This Dashboard Improve Arbitration and Mediation Outcomes?
This dashboard improves outcomes by turning performance data into action.
It helps organizations:
-
Reduce case resolution time
-
Improve settlement success rates
-
Control case backlog
-
Balance arbitrator and mediator workload
-
Improve accountability and compliance
Because measurement drives improvement, this dashboard supports continuous performance optimization.
Click to Purchases Arbitration and Mediation KPI Dashboard in Power BI
Best Practices for the Arbitration and Mediation KPI Dashboard in Power BI
To get maximum value from this dashboard, follow these best practices.
1. Select Relevant KPIs
Track KPIs that directly affect dispute resolution efficiency and quality.
2. Maintain Clear KPI Definitions
Ensure every KPI includes a clear formula and explanation.
3. Update Excel Data Regularly
Timely updates ensure accurate and reliable insights.
4. Review Both MTD and YTD Metrics
Short-term and long-term views together provide better clarity.
5. Analyze Trends Consistently
Trend charts help detect recurring issues early.
6. Align KPIs with Legal Objectives
Ensure KPIs support organizational and compliance goals.
7. Take Action on Insights
Always convert dashboard insights into corrective actions.
Click to Purchases Arbitration and Mediation KPI Dashboard in Power BI
Who Should Use an Arbitration and Mediation KPI Dashboard in Power BI?
This dashboard is ideal for:
-
Arbitration Centers
-
Mediation Institutions
-
Corporate Legal Departments
-
Dispute Resolution Professionals
-
Compliance Teams
-
Legal Consultants
Because Power BI scales well, both small teams and large organizations can use it effectively.
Can Small Legal Teams Use This Dashboard?
Yes, absolutely.
Small teams benefit because this dashboard offers:
-
Simple Excel-based data entry
-
Low implementation cost
-
Strong visual insights
-
Easy scalability
As a result, even small legal teams can manage performance professionally.
Conclusion: Why You Need an Arbitration and Mediation KPI Dashboard in Power BI
An Arbitration and Mediation KPI Dashboard in Power BI provides clarity, control, and confidence in dispute resolution performance management. It transforms raw Excel data into interactive insights that support efficiency, transparency, and better decision-making.
Because it combines structured Excel inputs, powerful Power BI visuals, trend analysis, and drill-through details, this dashboard becomes an essential tool for modern arbitration and mediation management.
If your organization wants to improve how it tracks and manages arbitration and mediation performance, this Power BI dashboard offers a practical and powerful solution.
Click to Purchases Arbitration and Mediation KPI Dashboard in Power BI
Frequently Asked Questions (FAQs)
What is an Arbitration and Mediation KPI Dashboard in Power BI?
It is a Power BI dashboard that tracks and analyzes arbitration and mediation KPIs using Excel as a data source.
Can I customize KPIs in the dashboard?
Yes, you can easily add, remove, or modify KPIs in the Excel input sheets.
Does this dashboard support MTD and YTD analysis?
Yes, it supports both Month-to-Date and Year-to-Date analysis.
Do I need advanced Power BI skills to use this dashboard?
No, basic Power BI knowledge is enough to use and refresh the dashboard.
How often should I update the Excel data?
You should update data based on your reporting cycle, such as monthly.
Can this dashboard replace manual reporting?
Yes, it significantly reduces manual reporting and improves accuracy.
Click to Purchases Arbitration and Mediation KPI Dashboard in Power BI
Visit our YouTube channel to learn step-by-step video tutorials