Heritage tourism plays a powerful role in protecting culture, generating employment, and strengthening local economies. Historical monuments attract visitors daily. Cultural events increase seasonal revenue. Government funding supports conservation projects. Therefore, tourism authorities must track performance carefully.
However, many heritage tourism departments still depend on scattered spreadsheets. As a result, they miss trends. They fail to compare actual results with targets. They struggle to measure visitor growth and revenue performance properly.
So, how can heritage site managers monitor visitor numbers, ticket income, restoration costs, and performance trends in one professional system?
The answer is clear.
You need a Heritage Tourism KPI Dashboard in Power BI.
In this detailed guide, you will learn:
-
What a Heritage Tourism KPI Dashboard in Power BI is
-
Why heritage tourism authorities need it
-
Complete explanation of all 3 dashboard pages
-
Excel data structure required for the dashboard
-
Key KPIs used in heritage tourism
-
Advantages of Heritage Tourism KPI Dashboard in Power BI
-
Best practices for implementation
-
Frequently Asked Questions
Let’s explore everything step by step.
Click to Purchases Heritage Tourism KPI Dashboard in Power BI
What Is a Heritage Tourism KPI Dashboard in Power BI?
A Heritage Tourism KPI Dashboard in Power BI is a ready-to-use performance monitoring solution designed for tourism boards, cultural departments, and heritage site managers.
It helps you:
-
Track Monthly (MTD) performance
-
Monitor Year-to-Date (YTD) growth
-
Compare current performance with previous year
-
Identify KPIs meeting or missing targets
-
Analyze trends visually with interactive charts
Moreover, this dashboard connects to an Excel data source. Therefore, you can update your numbers easily without modifying the Power BI file structure.
As a result, decision-makers gain real-time visibility into tourism performance.
Why Do Heritage Tourism Organizations Need KPI Tracking?
Heritage tourism involves many moving parts. Visitor counts change seasonally. Revenue fluctuates during festivals. Maintenance costs vary. Funding approvals affect restoration projects.
Without KPI tracking:
-
Authorities cannot measure growth properly
-
Managers cannot identify declining visitor numbers
-
Financial teams cannot compare revenue against targets
-
Strategic planning becomes weak
However, when you implement a structured KPI dashboard, you gain:
-
Clear performance visibility
-
Faster decision-making
-
Better budget control
-
Improved accountability
Therefore, a Heritage Tourism KPI Dashboard in Power BI becomes essential for modern tourism management.
Click to Purchases Heritage Tourism KPI Dashboard in Power BI
Key Features of Heritage Tourism KPI Dashboard in Power BI
This dashboard includes 3 structured pages inside the Power BI Desktop file. Each page serves a specific purpose.
Let’s understand each page in detail.
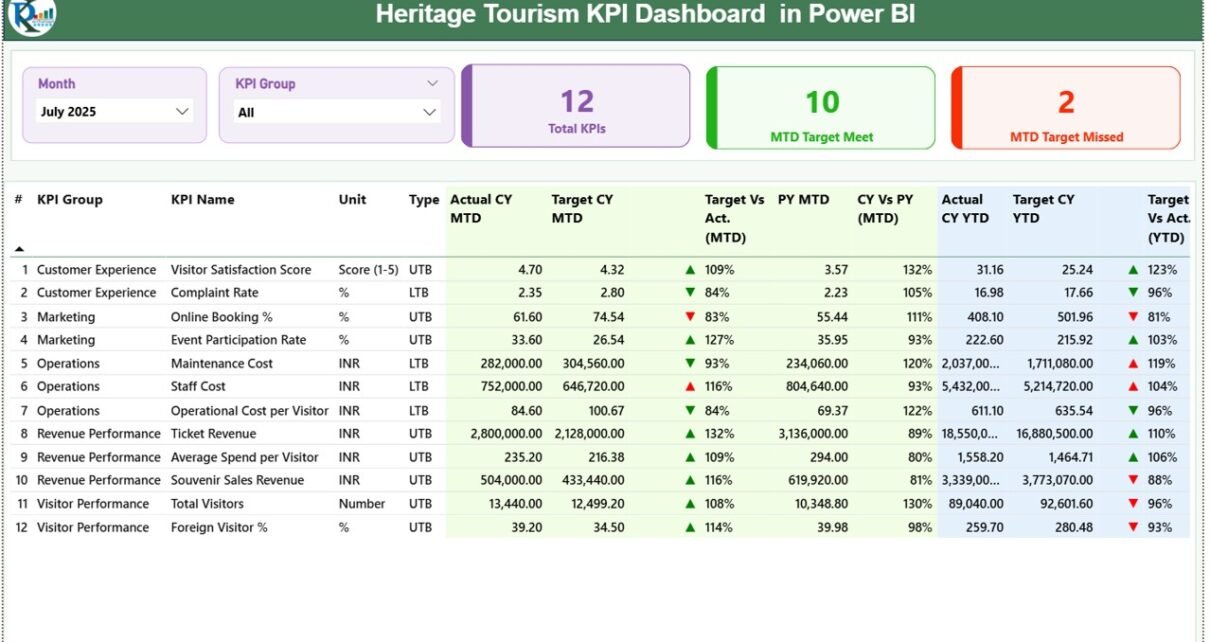
1️⃣ Summary Page – The Control Center

The Summary Page acts as the main performance hub.
Here, you can instantly understand the overall KPI status for selected months and KPI groups.
Top Section – Slicers
At the top of the dashboard, you will find:
-
Month Slicer
-
KPI Group Slicer
These slicers allow you to filter performance dynamically. Therefore, you can focus on a specific month or KPI category instantly.
KPI Cards Section
Just below the slicers, the dashboard shows 3 powerful KPI cards:
-
Total KPI Count
-
MTD Target Meet Count
-
MTD Target Missed Count
These cards immediately tell you how many KPIs perform well and how many require attention.
As a result, management can act quickly.
Detailed KPI Performance Table
Below the cards, the dashboard displays a comprehensive performance table.
This table includes:
KPI Number
Shows the sequence number of the KPI.
KPI Group
Displays the category such as:
-
Visitor Performance
-
Financial Metrics
-
Operational Metrics
-
Restoration Projects
KPI Name
Shows the actual KPI title.
Unit
Defines the measurement unit:
-
Number
-
Percentage
-
Currency
-
Days
Type (LTB / UTB)
-
UTB (Upper the Better) → Higher value indicates better performance.
-
LTB (Lower the Better) → Lower value indicates better performance.
For example:
-
Visitor Count → UTB
-
Complaint Rate → LTB
MTD Performance Columns
Actual CY MTD
Shows Current Year Month-to-Date actual value.
Target CY MTD
Shows target value for the same month.
MTD Icon (▲ / ▼)
The dashboard uses:
-
Green ▲ when target meets or exceeds
-
Red ▼ when target misses
Therefore, users quickly identify performance gaps.
Target vs Actual (MTD)
Formula used:
This percentage clearly shows performance ratio.
PY MTD (Previous Year)
Displays Month-to-Date number for the same month last year.
CY vs PY (MTD)
Formula:
This comparison shows growth trend.
YTD Performance Section
The same structure applies for Year-to-Date performance.
Actual CY YTD
Target CY YTD
YTD Icon
Target vs Actual (YTD)
PY YTD
CY vs PY (YTD)
Therefore, the dashboard provides both short-term and long-term performance insights.
Click to Purchases Heritage Tourism KPI Dashboard in Power BI
2️⃣ KPI Trend Page – Performance Visualization

The KPI Trend Page provides visual comparison using combo charts.
On this page, you will find:
-
KPI Name slicer on the left
-
Two combo charts:
-
MTD Comparison Chart
-
YTD Comparison Chart
-
Each chart displays:
-
Current Year Actual
-
Previous Year Actual
-
Target
Because of this layout, users easily identify:
-
Growth patterns
-
Seasonal fluctuations
-
Target gaps
-
Year-over-year trends
As a result, management can forecast future performance better.
Click to Purchases Heritage Tourism KPI Dashboard in Power BI
3️⃣ KPI Definition Page – Drill-Through Page

The KPI Definition page remains hidden. However, users can drill through from the Summary Page.
When you click on a KPI, the dashboard shows:
-
KPI Formula
-
KPI Definition
-
KPI Unit
-
KPI Type
Therefore, users understand the logic behind each KPI.
To return, simply click the back button at the top left.
Excel Data Structure – How to Maintain Data
The dashboard connects to an Excel file. This file contains 3 worksheets.
1️⃣ Input_Actual Sheet
Here, you must fill:
-
KPI Name
-
Month (Use first date of month)
-
MTD Value
-
YTD Value
For example:
| KPI Name | Month | MTD | YTD |
|---|---|---|---|
| Visitor Count | 01-Jan-2024 | 15,000 | 15,000 |
Make sure you enter date properly, not as text.
2️⃣ Input_Target Sheet
Here, you must enter:
-
KPI Name
-
Month (First date of month)
-
Target MTD
-
Target YTD
The dashboard automatically compares these numbers with actual values.
3️⃣ KPI Definition Sheet
Here, you define:
-
KPI Number
-
KPI Group
-
KPI Name
-
Unit
-
Formula
-
Definition
-
Type (LTB or UTB)
Therefore, the system becomes fully dynamic.
What Are Important KPIs in Heritage Tourism?
Let’s explore some essential KPIs.
Visitor Performance KPIs
-
Total Visitors
-
International Visitors
-
Repeat Visitor Rate
-
Average Stay Duration
Financial KPIs
-
Ticket Revenue
-
Donation Income
-
Event Revenue
-
Cost per Visitor
Operational KPIs
-
Maintenance Completion Rate
-
Staff Efficiency Rate
-
Complaint Resolution Time
Restoration KPIs
-
Project Completion %
-
Restoration Budget Variance
By tracking these KPIs, organizations maintain operational excellence.
Click to Purchases Heritage Tourism KPI Dashboard in Power BI
Advantages of Heritage Tourism KPI Dashboard in Power BI
Now let’s explore the major benefits.
1️⃣ Real-Time Monitoring
You can instantly track monthly and yearly performance.
2️⃣ Easy Data Management
Because the dashboard connects to Excel, users update numbers easily.
3️⃣ Interactive Filtering
Slicers allow dynamic filtering by Month and KPI Group.
4️⃣ Visual Performance Indicators
Green and red icons simplify performance understanding.
5️⃣ Year-over-Year Comparison
You can compare current results with previous year instantly.
6️⃣ Better Strategic Planning
Clear data insights help leaders plan future events and campaigns.
7️⃣ Accountability
Managers can clearly see which KPI meets or misses target.
Therefore, this dashboard improves performance transparency.
Best Practices for the Heritage Tourism KPI Dashboard in Power BI
To maximize benefits, follow these best practices.
1️⃣ Update Data Regularly
Update Excel file monthly without delay.
2️⃣ Maintain Clean Data
Avoid duplicate KPI names.
3️⃣ Use First Date of Month
Always use first date of month format for consistency.
4️⃣ Define KPI Type Correctly
Choose LTB or UTB properly.
5️⃣ Review Target Values Periodically
Adjust targets annually or quarterly.
6️⃣ Use Drill-Through Feature
Encourage managers to review KPI definitions.
7️⃣ Monitor Trends Monthly
Check trend page for unusual spikes or drops.
By following these practices, you ensure long-term dashboard success.
Click to Purchases Heritage Tourism KPI Dashboard in Power BI
How Does This Dashboard Improve Decision Making?
This dashboard simplifies complex tourism data.
Instead of reading long reports, decision-makers:
-
View performance in seconds
-
Identify weak areas immediately
-
Compare performance trends
-
Allocate resources effectively
Therefore, leadership gains confidence.
Conclusion
Heritage tourism protects culture and supports economic growth. However, without proper tracking, authorities lose performance visibility.
The Heritage Tourism KPI Dashboard in Power BI provides:
-
Structured KPI monitoring
-
MTD and YTD comparisons
-
Target tracking
-
Year-over-year analysis
-
Interactive filtering
-
Drill-through KPI definitions
Because it connects with Excel, users manage data easily. Moreover, visual icons highlight performance gaps instantly.
Therefore, if you want structured, professional, and powerful tourism performance monitoring, this dashboard becomes the perfect solution.
Frequently Asked Questions (FAQs)
1️⃣ What is the purpose of Heritage Tourism KPI Dashboard in Power BI?
It helps tourism authorities track monthly and yearly performance using interactive visual reports.
2️⃣ Can I update data without modifying Power BI file?
Yes. You can update the connected Excel file. The dashboard automatically refreshes data.
3️⃣ What does LTB and UTB mean?
LTB means Lower the Better.
UTB means Upper the Better.
4️⃣ Why should I use the first date of month?
Using the first date ensures proper time intelligence calculations inside Power BI.
5️⃣ Can I add more KPIs?
Yes. You can expand the KPI Definition sheet and update Excel data.
6️⃣ Is this dashboard suitable for government tourism departments?
Yes. Government agencies, heritage trusts, museums, and tourism boards can use it.
7️⃣ Does it support Year-over-Year comparison?
Yes. The dashboard calculates CY vs PY for both MTD and YTD automatically.
Click to Purchases Heritage Tourism KPI Dashboard in Power BI
Visit our YouTube channel to learn step-by-step video tutorials