In today’s fast-moving financial markets, commodities trading organizations must analyze large volumes of trading data every day. Traders deal with multiple exchanges, counterparties, contract types, settlements, brokerage calculations, and regional performance metrics. However, many companies still rely on scattered spreadsheets and manual reports. As a result, decision-making becomes slow, errors increase, and trading opportunities get missed.
Therefore, businesses increasingly adopt data-driven dashboards to manage trading performance efficiently. One powerful solution is the Commodities Trading Dashboard in Power BI, which transforms complex trading data into clear, interactive, and actionable insights.
In this comprehensive guide, you will learn everything about the Commodities Trading Dashboard in Power BI, including its structure, features, benefits, implementation approach, best practices, and frequently asked questions.
Click to Purchases Commodities Trading Dashboard in Power BI
What Is a Commodities Trading Dashboard in Power BI?
A Commodities Trading Dashboard in Power BI is an interactive analytics tool designed to monitor and analyze commodity trading activities using visual reports and Key Performance Indicators (KPIs).
Instead of reviewing multiple reports separately, traders and analysts can view all trading information in one centralized dashboard. Consequently, users can track trades, settlements, brokerage performance, and regional activities instantly.
Power BI enables users to:
-
Visualize trading performance in real time
-
Analyze trade quantities across exchanges
-
Monitor settlement progress
-
Evaluate broker and counterparty performance
-
Compare trading trends monthly and regionally
Because Power BI supports dynamic filtering and drill-down analysis, decision-makers gain deeper insights quickly.
Why Do Commodity Trading Companies Need a Dashboard?
Commodity markets operate under constant price fluctuations. Therefore, traders must react quickly using accurate data.
Without a dashboard:
-
Data remains scattered across systems
-
Settlement tracking becomes difficult
-
Brokerage analysis takes time
-
Risk monitoring becomes inconsistent
-
Reporting consumes valuable hours
However, when organizations implement a Power BI dashboard, they simplify analysis and improve operational transparency.
Moreover, teams collaborate better because everyone works from the same data source.
Click to Purchases Commodities Trading Dashboard in Power BI
Key Features of the Commodities Trading Dashboard in Power BI
This dashboard contains five interactive pages, each designed to analyze trading performance from a different perspective.
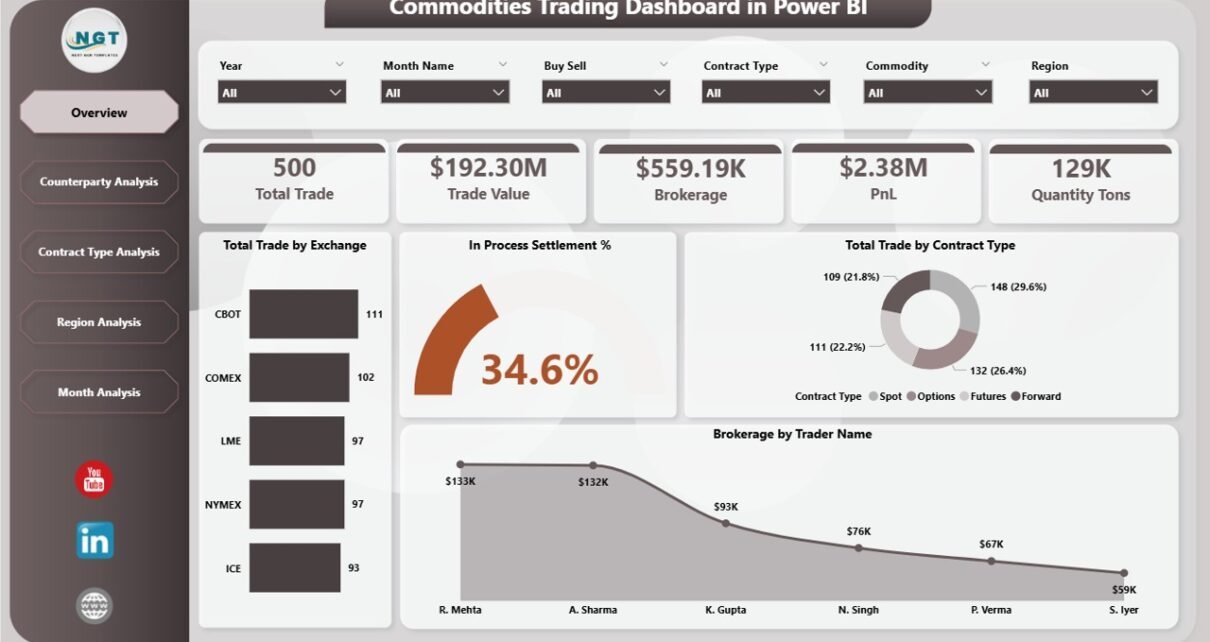
1. Overview Page – Central Trading Performance Hub
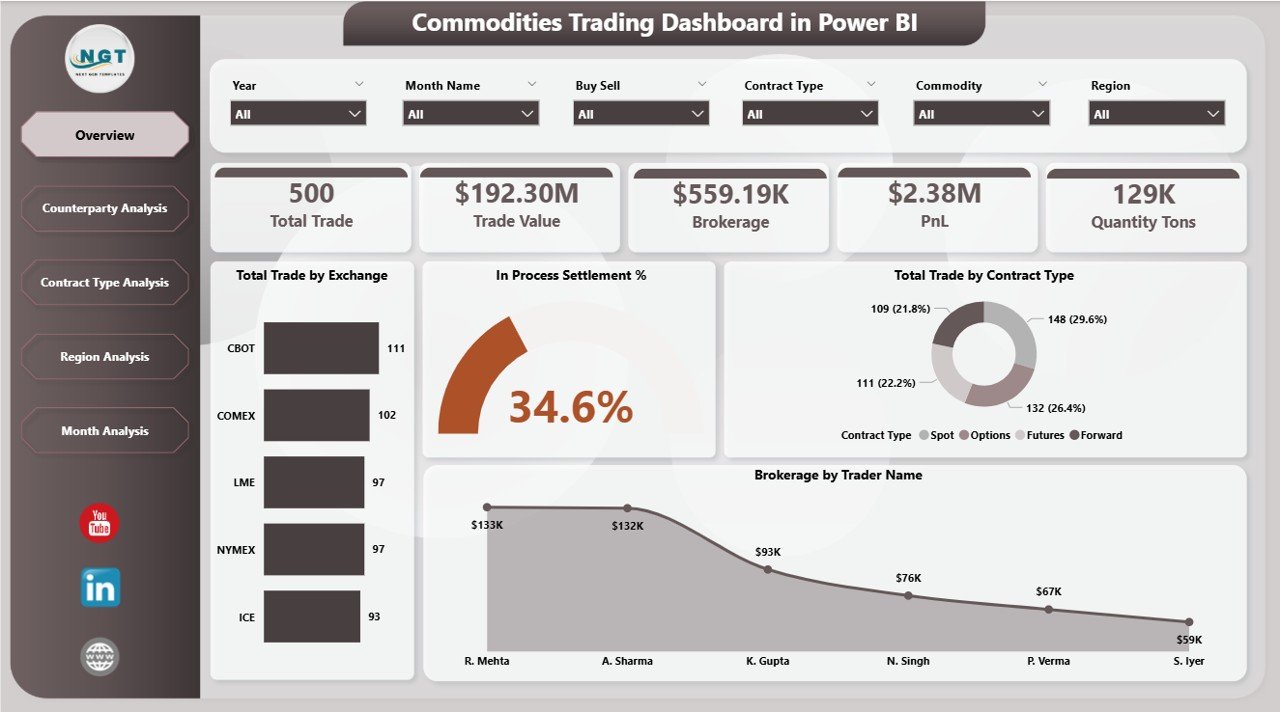
The Overview Page acts as the main control center of the dashboard. Users immediately understand trading performance through summary KPIs and visuals.
Key Metrics Displayed
-
Total Trade by Exchange
-
In-Process Settlement %
-
Total Trade by Contract Type
-
Brokerage by Trader Name
Additionally, slicers allow users to filter data dynamically. Therefore, traders can quickly analyze performance by selected conditions.
Why Is the Overview Page Important?
Because it provides instant visibility, managers can:
-
Identify trading volume trends
-
Monitor settlement efficiency
-
Evaluate trader contributions
-
Review brokerage performance quickly
As a result, decision-making becomes faster and more accurate.
2. Counterparty Analysis – Who Are You Trading With?
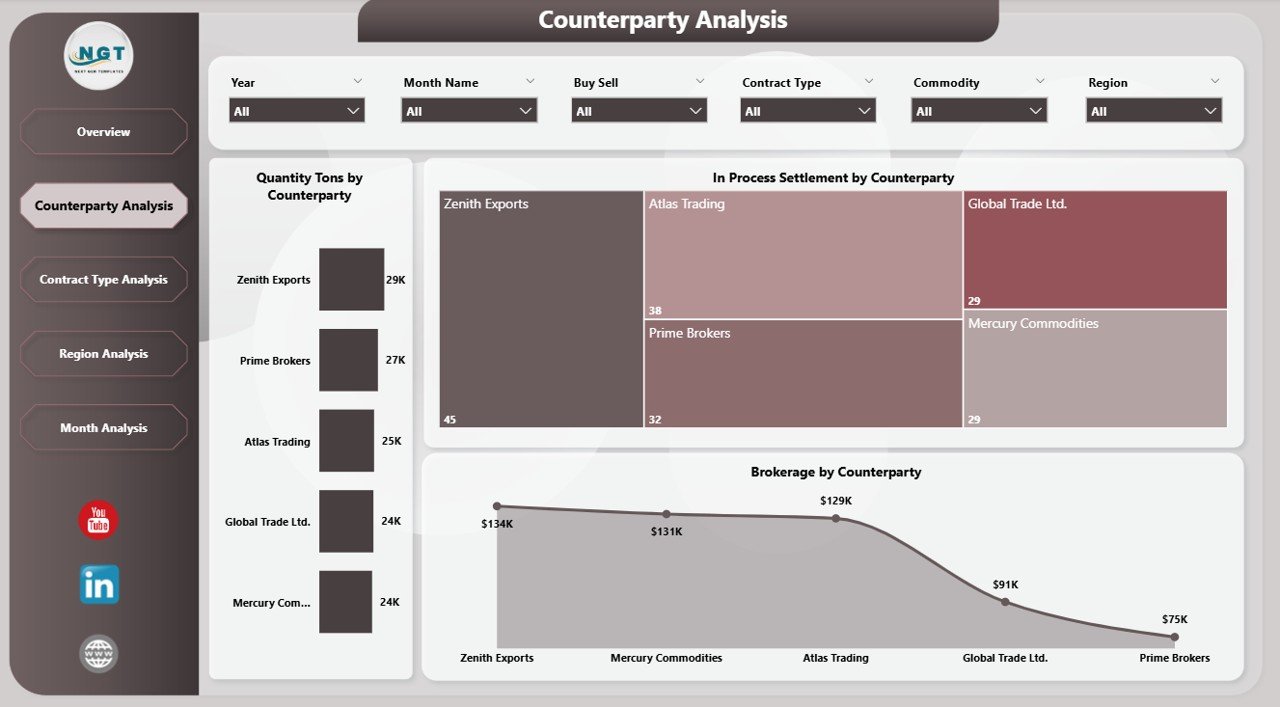
The Counterparty Analysis Page focuses on trading relationships and partner performance.
Charts Included
-
Quantity (Tons) by Counterparty
-
In-Process Settlement by Counterparty
-
Brokerage by Counterparty
This page helps organizations understand which counterparties generate the highest trading volume and which require settlement attention.
Business Benefits
-
Improve counterparty risk assessment
-
Strengthen profitable partnerships
-
Detect settlement delays early
-
Optimize brokerage expenses
Therefore, companies manage trading relationships more strategically.
Click to Purchases Commodities Trading Dashboard in Power BI
3. Contract Type Analysis – Understanding Trade Structures
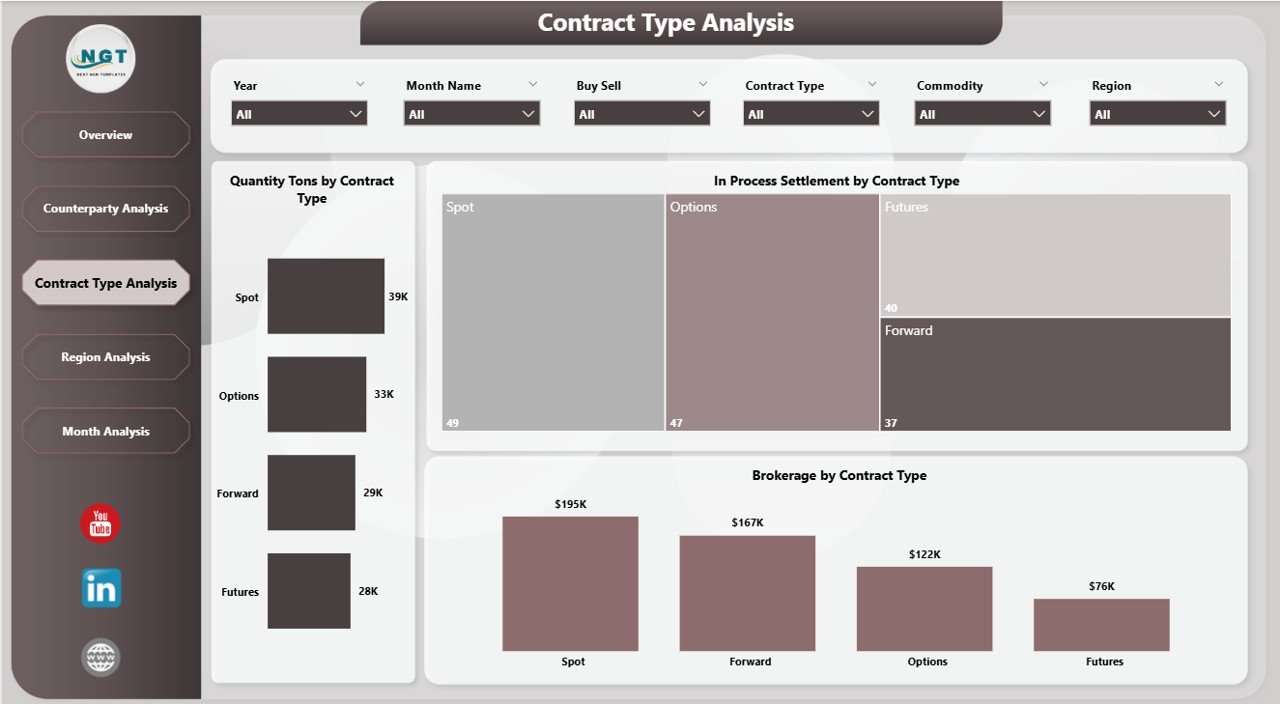
Different commodity contracts impact profitability differently. Hence, analyzing performance by contract type becomes essential.
Visualizations Available
-
Quantity Tons by Contract Type
-
In-Process Settlement by Contract Type
-
Brokerage by Contract Type
Users can instantly compare futures, spot contracts, or other trading agreements.
Why This Analysis Matters
-
Identify profitable contract structures
-
Reduce operational risks
-
Improve trading strategies
-
Optimize contract allocation
Consequently, traders align decisions with market performance data.
4. Region Analysis – Geographic Trading Insights
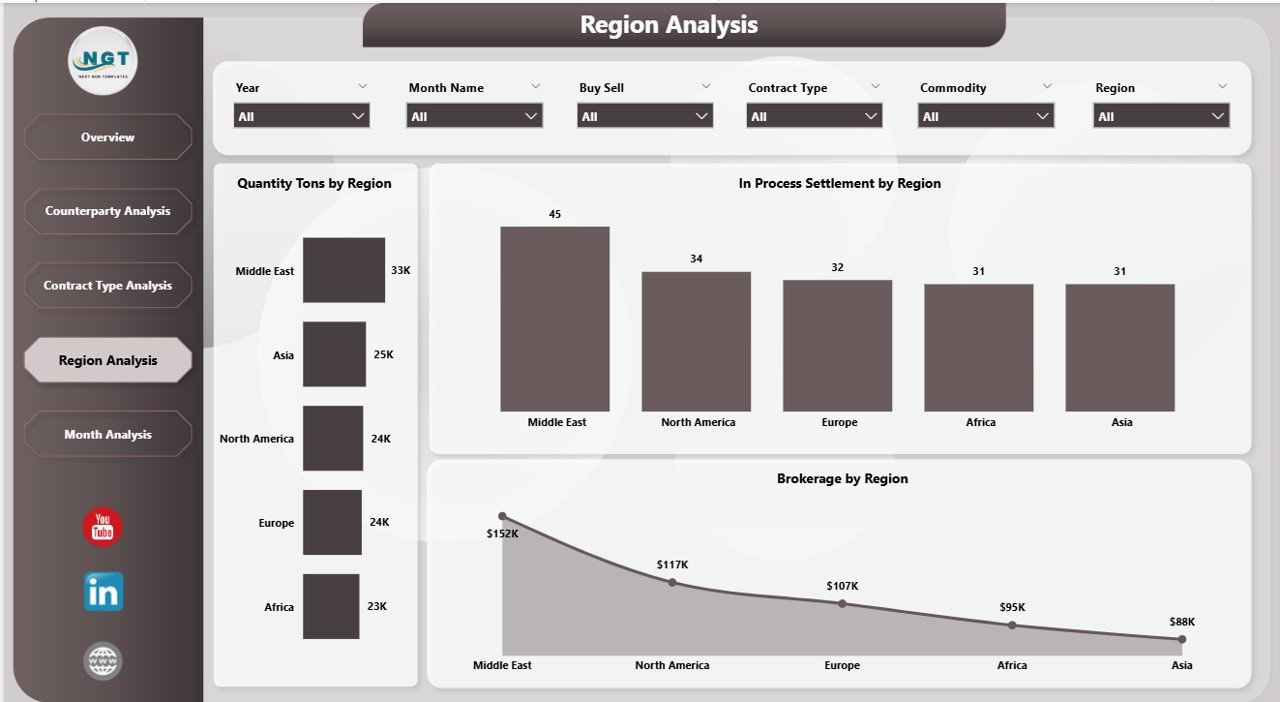
Commodity trading often spans multiple regions. Therefore, geographic performance analysis plays a critical role.
Charts Included
-
Quantity Tons by Region
-
In-Process Settlement by Region
-
Brokerage by Region
This page enables organizations to evaluate regional trading efficiency.
Key Advantages
-
Compare regional performance easily
-
Identify high-growth markets
-
Monitor settlement efficiency by region
-
Improve regional trading strategies
As markets vary geographically, this analysis helps companies adapt quickly.
5. Month Analysis – Trading Trends Over Time
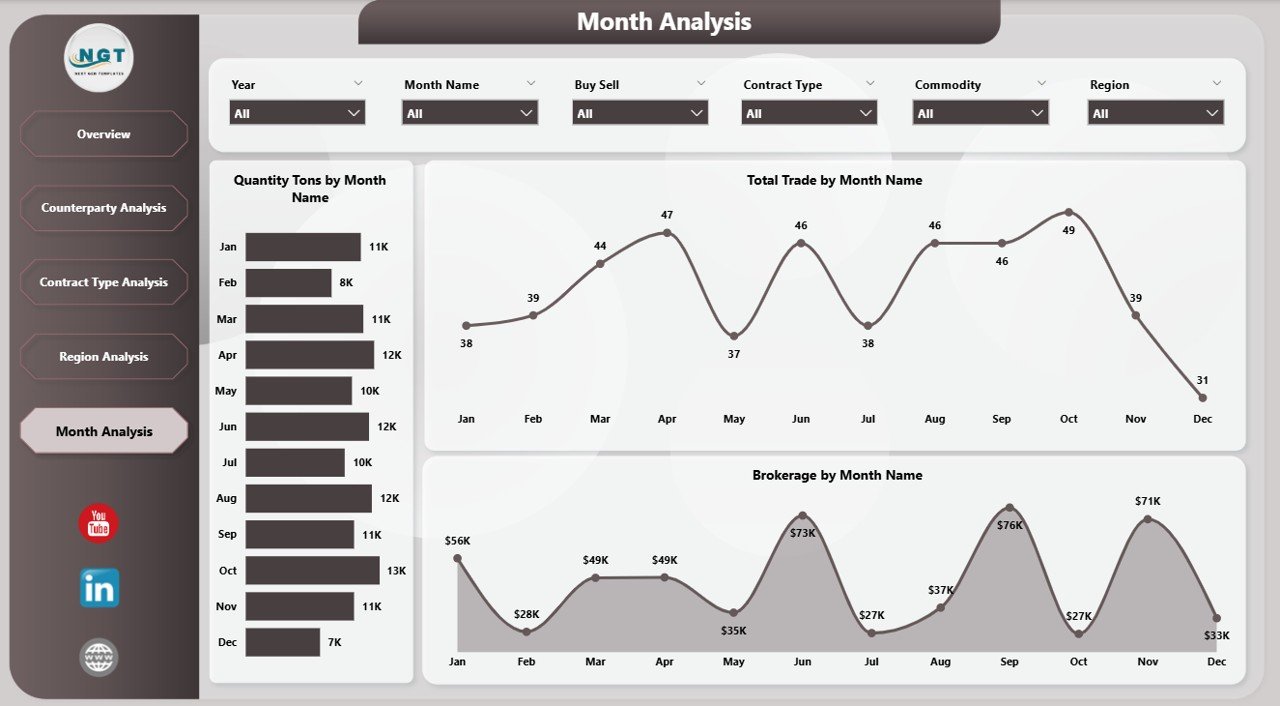
The Month Analysis Page highlights trading performance trends.
Metrics Covered
-
Quantity Tons by Month
-
Total Trade by Month
-
Brokerage by Month
Because time-based analysis reveals patterns, traders can forecast future performance more accurately.
Insights Gained
-
Seasonal trading behavior
-
Monthly performance fluctuations
-
Brokerage cost trends
-
Growth opportunities
Therefore, planning becomes more data-driven.
How Does Power BI Improve Commodities Trading Analysis?
Power BI introduces automation and visualization into trading analytics.
Key Improvements Include
-
Real-time performance monitoring
-
Interactive filtering using slicers
-
Automated calculations
-
Drill-down analysis capability
-
Easy sharing across teams
Moreover, Power BI integrates with Excel and databases, which simplifies data updates.
Advantages of Commodities Trading Dashboard in Power BI
Click to Purchases Commodities Trading Dashboard in Power BI
Implementing this dashboard offers several strategic advantages.
✅ Better Decision-Making
Managers analyze accurate data instantly instead of relying on assumptions.
✅ Faster Reporting
Automated visuals eliminate manual report preparation.
✅ Improved Settlement Tracking
Teams monitor in-process settlements continuously.
✅ Enhanced Risk Management
Users quickly identify unusual trading patterns.
✅ Increased Transparency
All stakeholders access the same performance metrics.
✅ Cost Optimization
Brokerage analysis highlights cost improvement areas.
How to Implement a Commodities Trading Dashboard?
Step 1: Collect Trading Data
Gather data from trading systems, brokers, and exchanges.
Step 2: Structure the Dataset
Organize columns such as:
-
Trade Date
-
Exchange
-
Counterparty
-
Contract Type
-
Quantity
-
Brokerage
-
Region
-
Settlement Status
Step 3: Import Data into Power BI
Load the dataset using Power BI Desktop.
Step 4: Create Data Relationships
Connect tables properly for accurate analysis.
Step 5: Build Visualizations
Create charts, cards, and slicers.
Step 6: Publish Dashboard
Share reports securely through Power BI Service.
What KPIs Should You Track in Commodity Trading?
Organizations should monitor key performance indicators such as:
-
Total Trades Executed
-
Trade Quantity (Tons)
-
Settlement Completion Rate
-
Brokerage Cost
-
Trade Volume by Exchange
-
Counterparty Performance
-
Monthly Trading Trends
Tracking these KPIs ensures consistent performance monitoring.
Best Practices for the Commodities Trading Dashboard in Power BI
Click to Purchases Commodities Trading Dashboard in Power BI
To achieve maximum value, organizations should follow proven practices.
✔ Keep Data Clean and Structured
Accurate dashboards depend on reliable data.
✔ Use Standard KPI Definitions
Maintain consistency across reports.
✔ Apply Interactive Filters
Allow users to explore data easily.
✔ Update Data Regularly
Frequent updates maintain dashboard relevance.
✔ Focus on Business Questions
Design visuals that answer real trading problems.
✔ Avoid Overcrowded Visuals
Simple layouts improve readability.
✔ Monitor Performance Regularly
Review dashboard insights daily or weekly.
Common Challenges in Commodity Trading Analytics (And Solutions)
Challenge 1: Data Fragmentation
Solution: Integrate all sources into Power BI.
Challenge 2: Settlement Delays
Solution: Track settlement KPIs visually.
Challenge 3: Manual Reporting Errors
Solution: Automate calculations using Power BI measures.
Challenge 4: Limited Visibility
Solution: Use centralized dashboards.
Who Can Benefit from This Dashboard?
This dashboard serves multiple roles:
-
Commodity Traders
-
Trading Analysts
-
Risk Managers
-
Brokerage Firms
-
Financial Controllers
-
Trading Operations Teams
Because each role views performance differently, interactive filters allow customized analysis.
Future of Commodity Trading Analytics
As markets evolve, analytics tools continue improving.
Organizations increasingly adopt:
-
Real-time market data integration
-
AI-based trading insights
-
Predictive analytics models
-
Automated risk monitoring
Therefore, dashboards will become even more intelligent and proactive.
Conclusion
The Commodities Trading Dashboard in Power BI provides a modern solution for managing complex trading operations. Instead of analyzing disconnected reports, organizations gain a unified view of trading performance, settlements, brokerage costs, and regional activity.
Moreover, interactive visuals simplify analysis, while automation saves time and reduces errors. As a result, traders make faster decisions, improve profitability, and manage risks more effectively.
In today’s competitive commodity markets, companies that rely on data-driven dashboards gain a strong advantage. Therefore, implementing a Power BI trading dashboard represents not just a reporting upgrade but a strategic transformation.
Frequently Asked Questions (FAQs)
1. What is a commodities trading dashboard?
A commodities trading dashboard is a visual analytics tool that monitors trading activities, settlements, and performance metrics in one interface.
2. Why should traders use Power BI?
Power BI provides interactive visuals, automation, and real-time insights that improve trading decisions.
3. Can beginners use this dashboard?
Yes. The dashboard uses user-friendly visuals and filters, so beginners can analyze data easily.
4. What data is required for the dashboard?
You need trade details, quantities, counterparties, contract types, brokerage values, and settlement information.
5. How often should the dashboard be updated?
Organizations should update data daily or weekly depending on trading volume.
6. Does Power BI support large trading datasets?
Yes. Power BI handles large datasets efficiently using optimized data models.
7. Can this dashboard help reduce trading risks?
Yes. Visual insights help identify unusual patterns and settlement delays quickly.
Visit our YouTube channel to learn step-by-step video tutorials