Electric utility companies manage complex assets every single day. They maintain substations, transformers, feeders, smart meters, and transmission lines. However, without clear performance tracking, teams lose control over downtime, service quality, and maintenance costs.
Therefore, utilities need a centralized, interactive, and real-time monitoring system. The Electric Utility Maintenance KPI Dashboard in Power BI solves this challenge. It gives maintenance managers, plant heads, and executives a complete performance view in one place.
Moreover, this ready-to-use dashboard captures data from Excel and transforms it into powerful visuals inside Microsoft Power BI. As a result, decision-makers gain instant insights and take action faster.
Click to Purchases Electric Utility Maintenance KPI Dashboard in Power BI
In this detailed guide, you will learn:
-
What an Electric Utility Maintenance KPI Dashboard in Power BI is
-
Why electric utilities need structured KPI tracking
-
Detailed explanation of all dashboard pages
-
Excel data structure used in the solution
-
Advantages of this dashboard
-
Best practices for implementation
-
Frequently asked questions
Let’s dive in.
What Is an Electric Utility Maintenance KPI Dashboard in Power BI?
An Electric Utility Maintenance KPI Dashboard in Power BI is an interactive performance monitoring tool designed to track maintenance-related Key Performance Indicators (KPIs) for electric utility companies.
Instead of reviewing scattered spreadsheets and static reports, teams can:
-
Monitor Month-to-Date (MTD) performance
-
Track Year-to-Date (YTD) progress
-
Compare Actual vs Target values
-
Analyze Current Year vs Previous Year performance
-
Review KPI formulas and definitions
-
Identify performance gaps instantly
Because Power BI updates visuals dynamically, users can filter by month or KPI group and instantly see updated numbers. Consequently, the entire reporting process becomes simple, accurate, and fast.
Why Do Electric Utilities Need a Maintenance KPI Dashboard?
Click to Purchases Electric Utility Maintenance KPI Dashboard in Power BI
Electric utility maintenance involves high-value assets and strict service standards. Even a small delay in maintenance can cause power outages, safety risks, or regulatory penalties.
However, many utilities still depend on manual reports. As a result, they face several issues:
-
Delayed decision-making
-
Inconsistent KPI tracking
-
Poor visibility into underperforming assets
-
Difficulty comparing historical performance
-
Limited accountability
Therefore, utilities must adopt a structured digital dashboard. A Power BI dashboard provides automation, accuracy, and visual clarity. Furthermore, it supports long-term strategic planning.
What Are the Key Features of the Electric Utility Maintenance KPI Dashboard in Power BI?
This dashboard contains three structured pages inside Power BI Desktop. Each page plays a specific role in performance monitoring.
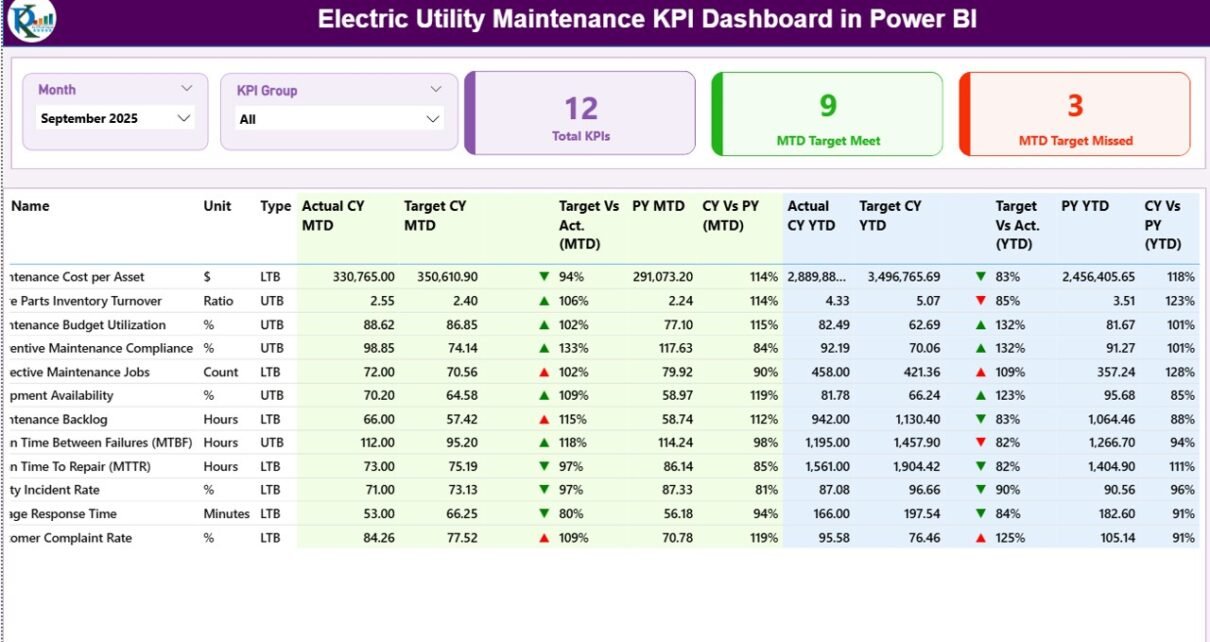
1️⃣ Summary Page – Your Main Control Center
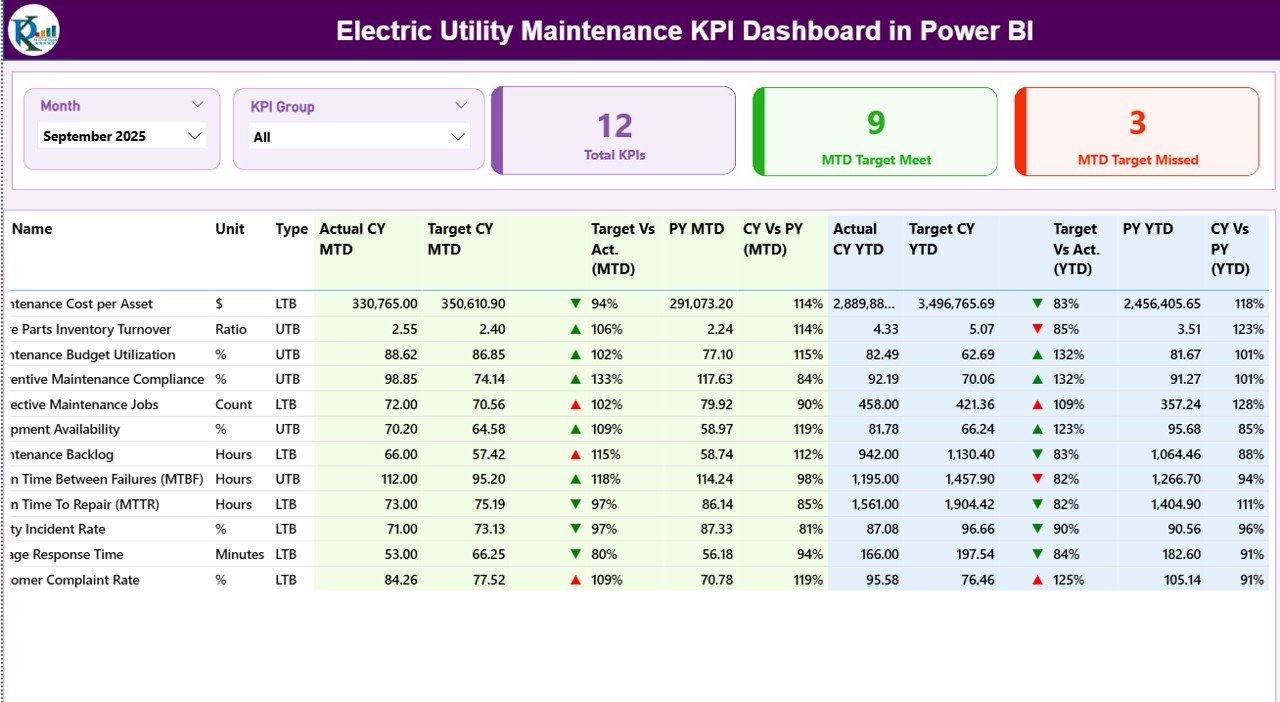
The Summary Page acts as the heart of the dashboard. It provides a complete overview of all KPIs in one screen.
What Does the Top Section Show?
At the top, you will find:
-
Month Slicer – Select any month to update the entire dashboard
-
KPI Group Slicer – Filter KPIs by maintenance category
-
3 KPI Cards:
-
Total KPI Count
-
MTD Target Meet Count
-
MTD Target Missed Count
-
Because these elements respond instantly, managers can quickly assess performance.
What Information Appears in the Detailed Table?
Below the cards, you will see a structured KPI table containing:
-
KPI Number – Sequential number of the KPI
-
KPI Group – Category of the KPI
-
KPI Name – Name of the performance indicator
-
Unit – Measurement unit (Hours, %, Count, etc.)
-
Type – LTB (Lower the Better) or UTB (Upper the Better)
This classification helps users understand whether higher or lower values indicate better performance.
How Does MTD Performance Tracking Work?
Click to Purchases Electric Utility Maintenance KPI Dashboard in Power BI
The dashboard shows:
-
Actual CY MTD – Current Year Month-to-Date Actual
-
Target CY MTD – Current Year MTD Target
-
MTD Icon – ▲ (Green) or ▼ (Red) indicator
-
Target vs Actual (MTD) – Percentage comparison
-
PY MTD – Previous Year MTD
-
CY vs PY (MTD) – Growth percentage
The formula used:
-
Target vs Actual = Actual / Target
-
CY vs PY = Current Year / Previous Year
Therefore, users instantly know whether the KPI meets expectations.
How Does YTD Performance Tracking Work?
Similarly, the dashboard displays:
-
Actual CY YTD
-
Target CY YTD
-
YTD Icon
-
Target vs Actual (YTD)
-
PY YTD
-
CY vs PY (YTD)
Because YTD values show cumulative performance, managers can track long-term progress.
2️⃣ KPI Trend Page – Visual Performance Analysis
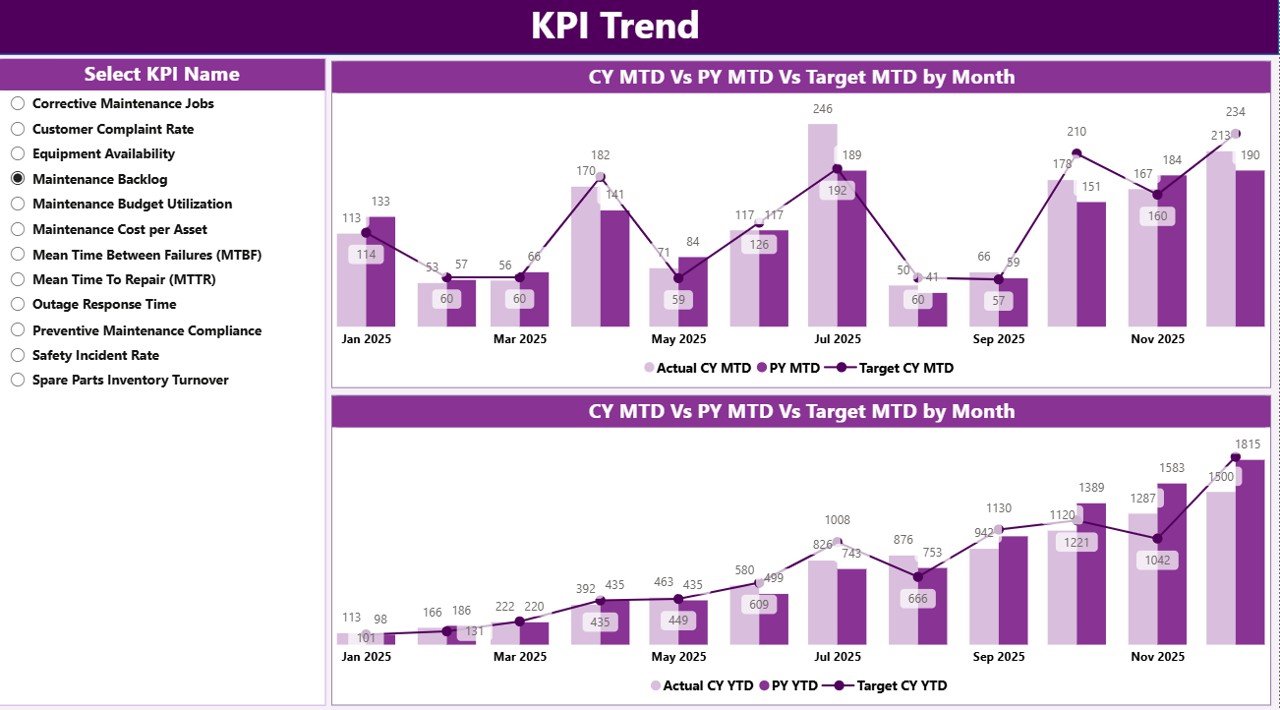
The KPI Trend Page provides deeper insights.
What Does This Page Include?
-
2 Combo Charts
-
MTD Trend (Actual, Target, PY)
-
YTD Trend (Actual, Target, PY)
-
-
KPI Name Slicer on the Left
When users select a KPI, both charts update automatically.
Consequently, managers can:
-
Identify seasonal trends
-
Spot declining performance
-
Compare performance year-over-year
-
Analyze maintenance effectiveness
Because combo charts combine bars and lines, they provide both clarity and comparison.
3️⃣ KPI Definition Page – Drill-Through Insights
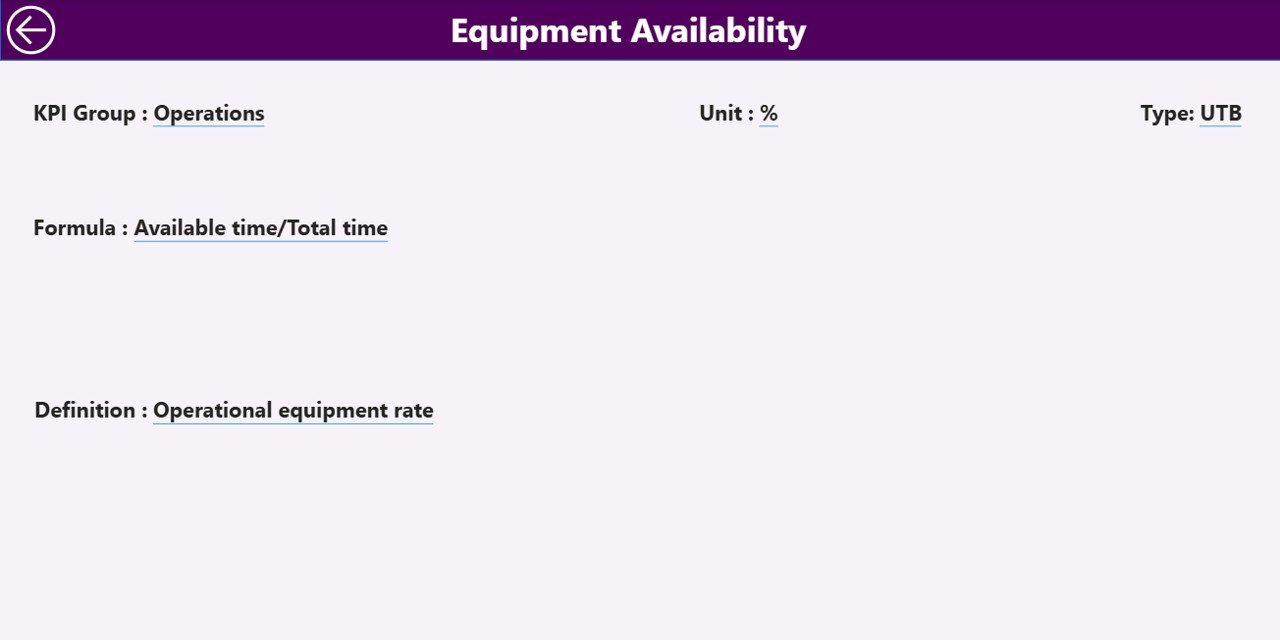
This page remains hidden by default. However, users can drill through from the Summary page.
What Information Does It Show?
-
KPI Formula
-
KPI Definition
-
KPI Type
-
KPI Group
-
Measurement Unit
This feature improves transparency. Moreover, it ensures that every stakeholder understands how the KPI works.
To return to the main page, users simply click the back button in the top-left corner.
What Excel Data Structure Powers This Dashboard?
Click to Purchases Electric Utility Maintenance KPI Dashboard in Power BI
The dashboard uses Excel as a data source. This design keeps data entry simple and controlled.
1️⃣ Input_Actual Sheet
Fill the following columns:
-
KPI Name
-
Month (First date of the month)
-
MTD Number
-
YTD Number
Because the system uses structured data, Power BI refreshes automatically.
2️⃣ Input_Target Sheet
Enter:
-
KPI Name
-
Month
-
MTD Target
-
YTD Target
Targets help measure performance against goals.
3️⃣ KPI Definition Sheet
Fill:
-
KPI Number
-
KPI Group
-
KPI Name
-
Unit
-
Formula
-
Definition
-
Type (LTB or UTB)
This structured format ensures consistency.
What KPIs Can You Track in Electric Utility Maintenance?
You can track:
-
Preventive Maintenance Compliance %
-
Corrective Maintenance Response Time
-
Equipment Downtime Hours
-
SAIDI (System Average Interruption Duration Index)
-
SAIFI (System Average Interruption Frequency Index)
-
Maintenance Cost per Asset
-
Transformer Failure Rate
-
Mean Time to Repair (MTTR)
Because the dashboard supports both LTB and UTB metrics, it adapts to all maintenance KPIs.
Advantages of Electric Utility Maintenance KPI Dashboard in Power BI
Click to Purchases Electric Utility Maintenance KPI Dashboard in Power BI
Now let’s explore the major benefits.
1️⃣ Centralized Monitoring
You see all KPIs in one interactive dashboard. Therefore, you avoid switching between files.
2️⃣ Faster Decision-Making
Real-time visuals help you act immediately. Consequently, you reduce downtime.
3️⃣ Better Accountability
Target vs Actual comparisons increase responsibility across teams.
4️⃣ Historical Comparison
Year-over-year analysis reveals growth patterns and recurring issues.
5️⃣ Visual Clarity
Icons and color indicators simplify interpretation.
6️⃣ Improved Maintenance Planning
YTD tracking supports long-term strategy.
7️⃣ Scalable System
You can add new KPIs without changing the structure.
How Does This Dashboard Improve Maintenance Performance?
The dashboard improves performance because it:
-
Highlights underperforming KPIs immediately
-
Encourages preventive maintenance
-
Reduces reactive repairs
-
Supports budget control
-
Improves regulatory compliance
Furthermore, trend analysis helps predict equipment failure.
Best Practices for the Electric Utility Maintenance KPI Dashboard in Power BI
To maximize results, follow these best practices.
1️⃣ Maintain Clean Data
Always enter the first date of the month. This ensures accurate time intelligence.
2️⃣ Define Clear KPI Ownership
Assign responsibility for each KPI.
3️⃣ Update Data Monthly
Regular updates maintain reliability.
4️⃣ Review Trends, Not Just Numbers
Focus on patterns rather than single-month results.
5️⃣ Use Drill-Through for Clarity
Encourage teams to review KPI definitions.
6️⃣ Align KPIs with Business Goals
Choose KPIs that support reliability and safety.
7️⃣ Train Your Team
Ensure that managers understand slicers and filters.
Who Can Use This Dashboard?
-
Maintenance Managers
-
Utility Operations Heads
-
Asset Management Teams
-
Reliability Engineers
-
Utility Executives
Because the interface remains simple, both technical and non-technical users can operate it.
How Does Power BI Enhance Utility Reporting?
Microsoft Power BI provides:
-
Interactive filtering
-
Dynamic visuals
-
Automated refresh
-
Drill-through capability
-
Data modeling features
Therefore, utilities gain professional-grade reporting without complex systems.
Conclusion
Electric utilities operate in a demanding environment. They must maintain reliability, reduce downtime, control costs, and meet regulatory standards. However, manual reporting limits growth and accuracy.
The Electric Utility Maintenance KPI Dashboard in Power BI transforms maintenance tracking into a structured, interactive, and powerful system. It combines Excel data input with dynamic Power BI visuals. As a result, managers gain clarity, speed, and control.
If you want better maintenance performance, stronger accountability, and smarter decisions, this dashboard delivers exactly that.
Frequently Asked Questions (FAQs)
1️⃣ What is an Electric Utility Maintenance KPI Dashboard in Power BI?
It is an interactive Power BI dashboard that tracks maintenance KPIs using Excel data.
2️⃣ Can I customize the KPIs?
Yes. You can add, remove, or modify KPIs easily.
3️⃣ Does it support both MTD and YTD analysis?
Yes. The dashboard shows MTD and YTD comparisons against targets and previous year.
4️⃣ What does LTB and UTB mean?
LTB means Lower the Better. UTB means Upper the Better.
5️⃣ Do I need advanced Power BI skills?
No. The dashboard remains ready to use. You only need to update Excel data.
6️⃣ Can I track reliability indices like SAIDI and SAIFI?
Yes. You can include those KPIs in the system.
7️⃣ How often should I update the dashboard?
You should update it monthly for best results.
Visit our YouTube channel to learn step-by-step video tutorials