The fintech industry moves at lightning speed. Every second, companies process thousands of transactions, approve loans, calculate interest, manage risks, and analyze customer behavior. However, without structured reporting, fintech teams struggle to monitor revenue, risk exposure, customer growth, and profitability in one place.
Therefore, fintech companies need a centralized, interactive, and real-time analytics solution. A Fintech Dashboard in Power BI solves this challenge completely. It transforms raw financial data into actionable insights. As a result, decision-makers track revenue streams, monitor lending portfolios, control risks, and improve profit margins with confidence.
In this detailed guide, you will learn:
- What a Fintech Dashboard in Power BI is
- Why fintech companies need it
- Detailed explanation of all 5 dashboard pages
- Advantages of using this dashboard
- Best practices for implementation
- Frequently Asked Questions with answers
Click to buy Fintech Dashboard in Power BI
What Is a Fintech Dashboard in Power BI?
A Fintech Dashboard in Power BI is an interactive financial performance monitoring system built inside Microsoft Power BI. It collects data from Excel, databases, or financial systems and converts it into dynamic visual reports.
Instead of reviewing multiple spreadsheets, managers analyze:
- Fee revenue
- Interest revenue
- Total revenue
- Processing costs
- Gross profit
- Loan portfolio performance
- Risk scores
- Customer acquisition metrics
Moreover, Power BI allows users to apply slicers (filters) for deeper analysis. Therefore, teams quickly identify performance trends, revenue leaks, and risk patterns.
Why Do Fintech Companies Need a Dashboard?
Fintech businesses handle multiple financial streams at once. They manage lending products, payment channels, customer acquisition campaigns, fraud detection systems, and merchant partnerships.
However, when teams rely on scattered reports, they face:
- Delayed decision-making
- Poor revenue tracking
- Inconsistent profit margin monitoring
- Limited visibility into risk exposure
- Difficulty measuring customer acquisition cost (CAC)
Therefore, companies need a structured analytics framework. A Power BI dashboard centralizes all performance metrics. As a result, leadership gains clarity, speed, and control.
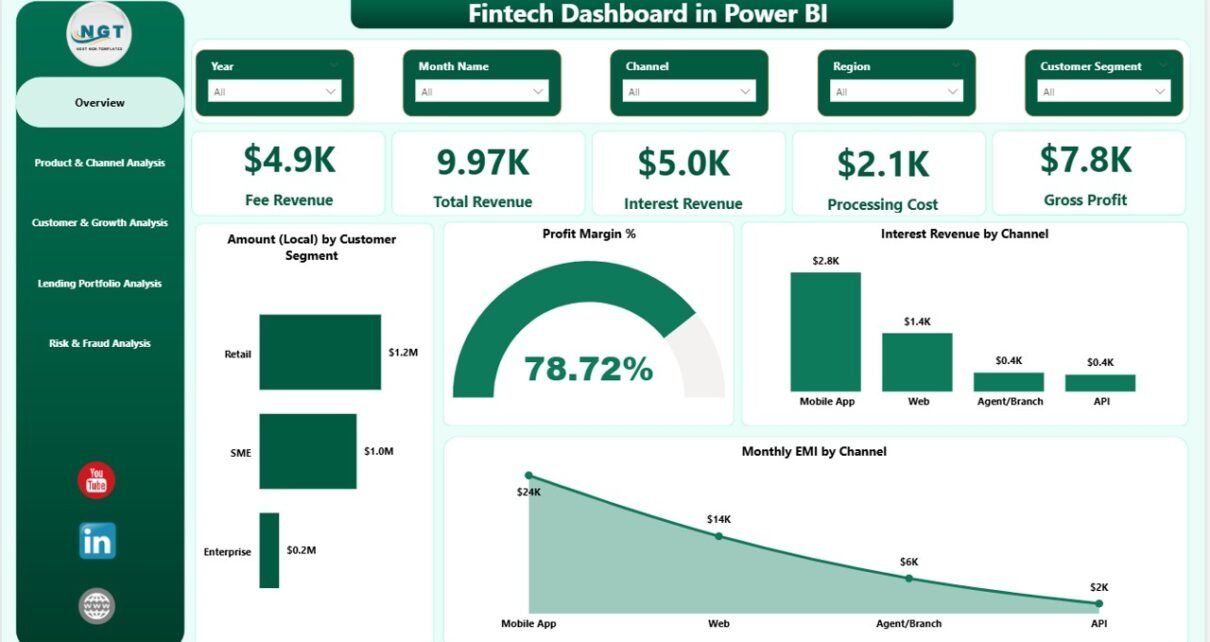
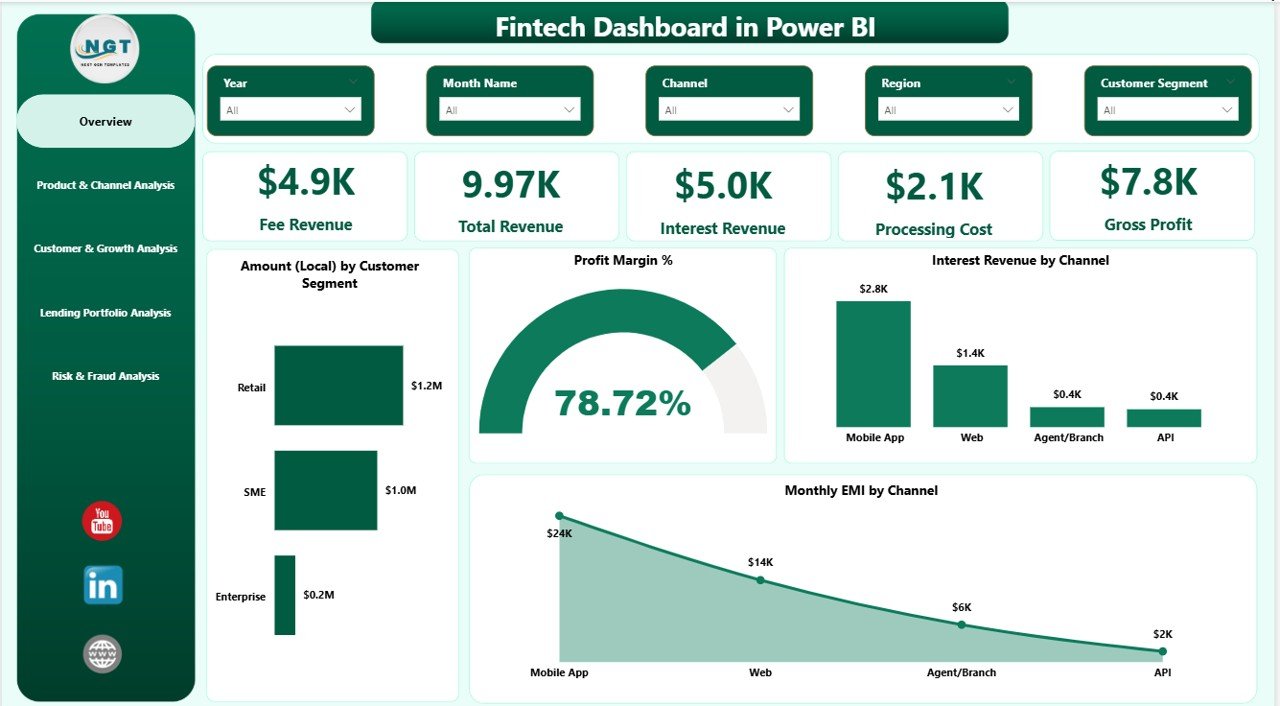
Overview Page – The Command Center
The Overview Page works as the main control panel of the dashboard. Here, decision-makers get an instant snapshot of financial health.
KPI Cards on the Overview Page
The page includes 5 powerful KPI cards:
- Fee Revenue
- Total Revenue
- Interest Revenue
- Processing Cost
- Gross Cost
These KPI cards provide quick financial clarity. Therefore, executives immediately understand profitability.
Charts on the Overview Page
The Overview page includes 4 interactive charts:
- Amount (Local) by Customer Segment
- Profit Margin %
- Interest Revenue by Channel
- Monthly EMI by Channel
Because these visuals update dynamically, managers quickly analyze trends. Moreover, slicers allow users to filter by time, segment, or channel.
Click to buy Fintech Dashboard in Power BI
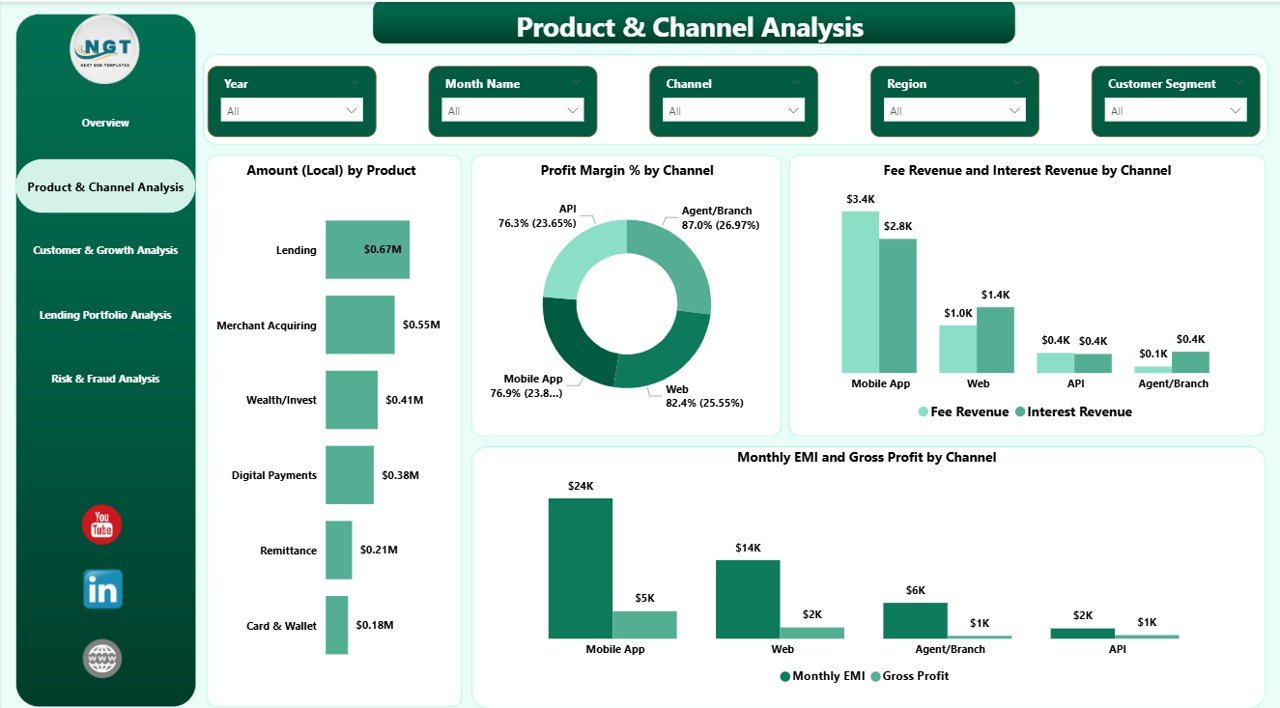
Product & Channel Analysis – Where Does Revenue Come From?
Revenue diversification plays a crucial role in fintech success. Therefore, this page focuses on product and channel performance.
Charts Included
- Amount (Local) by Product
- Profit Margin % by Channel
- Fee Revenue and Interest Revenue by Channel
- Monthly EMI and Gross Profit by Channel
With these visuals, managers understand which products generate maximum returns. Additionally, they identify low-performing channels.
As a result, teams optimize product strategy and channel investments.
Click to buy Fintech Dashboard in Power BI
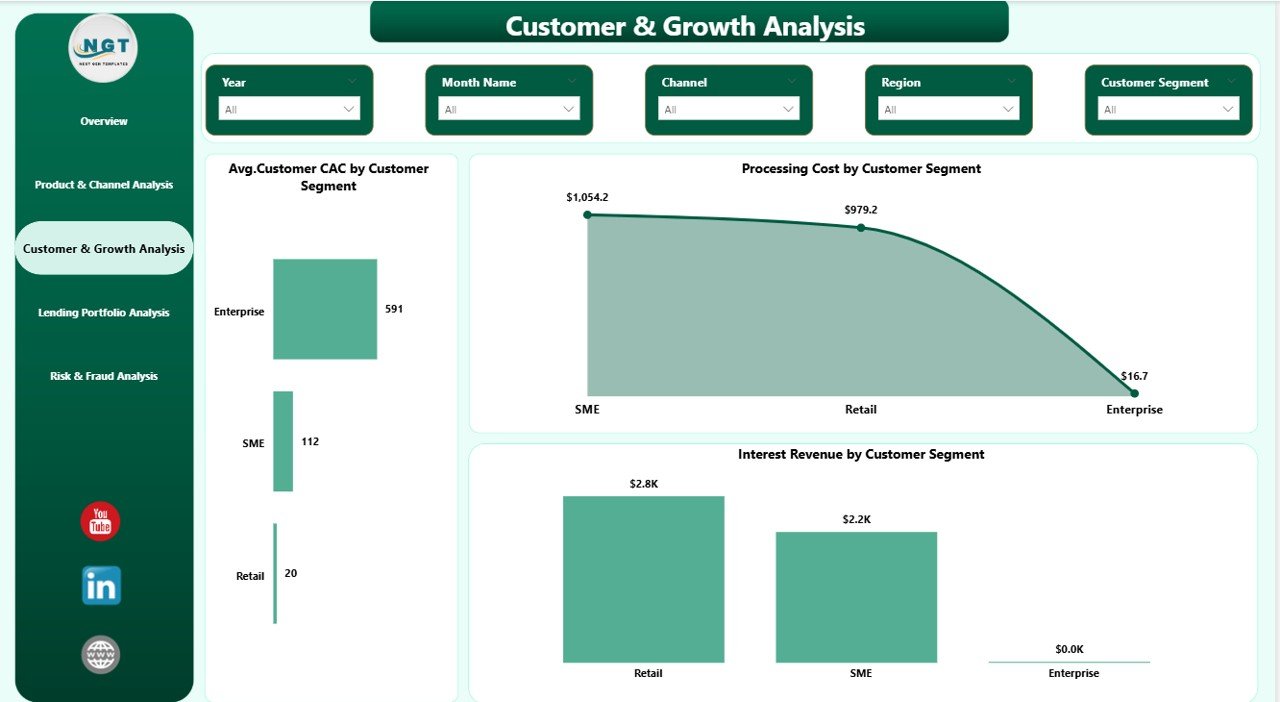
Customer & Growth Analysis – Are Customers Profitable?
Customer growth drives fintech expansion. However, acquisition costs often reduce profit margins.
Therefore, this page analyzes customer economics.
Charts Included
- Average Customer CAC by Customer Segment
- Processing Cost by Customer Segment
- Interest Revenue by Customer Segment
With these insights, companies measure:
- Customer acquisition efficiency
- Segment profitability
- Cost control performance
Because this page highlights growth vs. cost balance, marketing and finance teams align their strategies better.
Click to buy Fintech Dashboard in Power BI
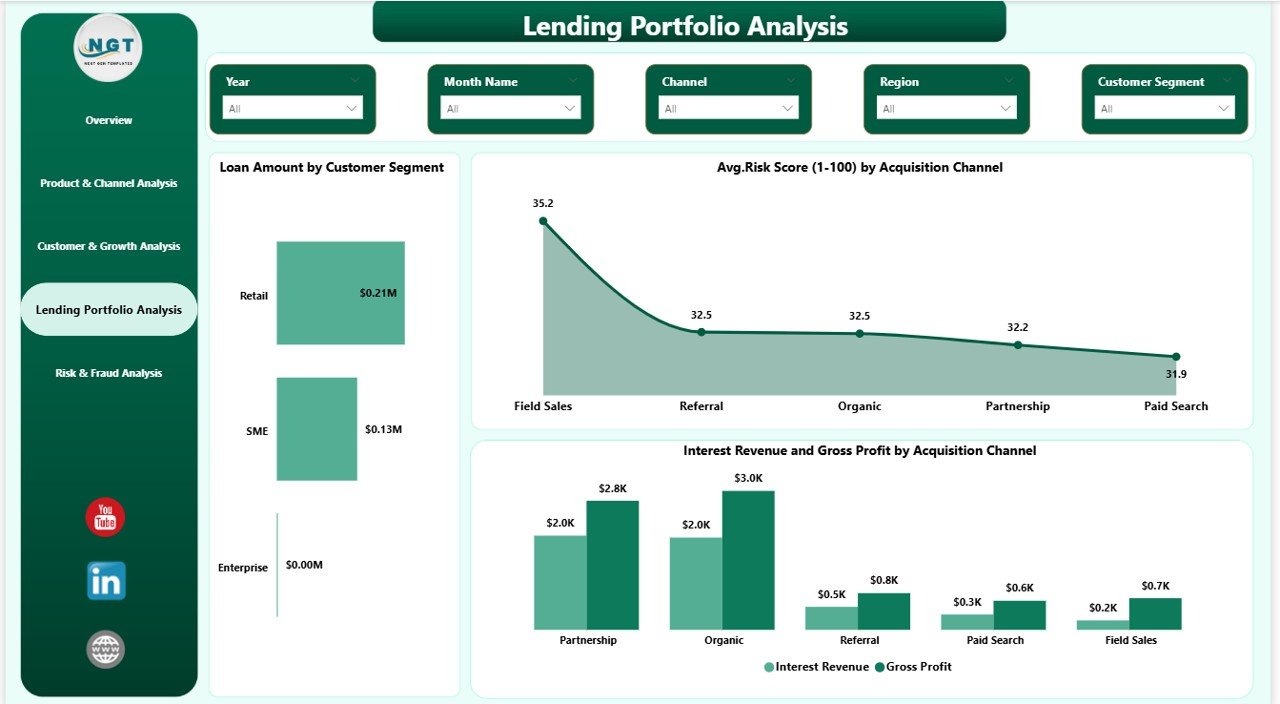
Lending Portfolio Analysis – How Strong Is the Loan Book?
Lending forms the backbone of most fintech platforms. Therefore, portfolio monitoring becomes critical.
Charts Included
- Loan Amount by Customer Segment
- Average Risk Score (1–100) by Acquisition Channel
- Interest Revenue and Gross Profit by Acquisition Channel
This page helps companies:
- Monitor exposure by segment
- Evaluate channel risk quality
- Analyze profitability vs. risk
As a result, lending teams reduce bad debt risk and improve portfolio stability.
Click to buy Fintech Dashboard in Power BI
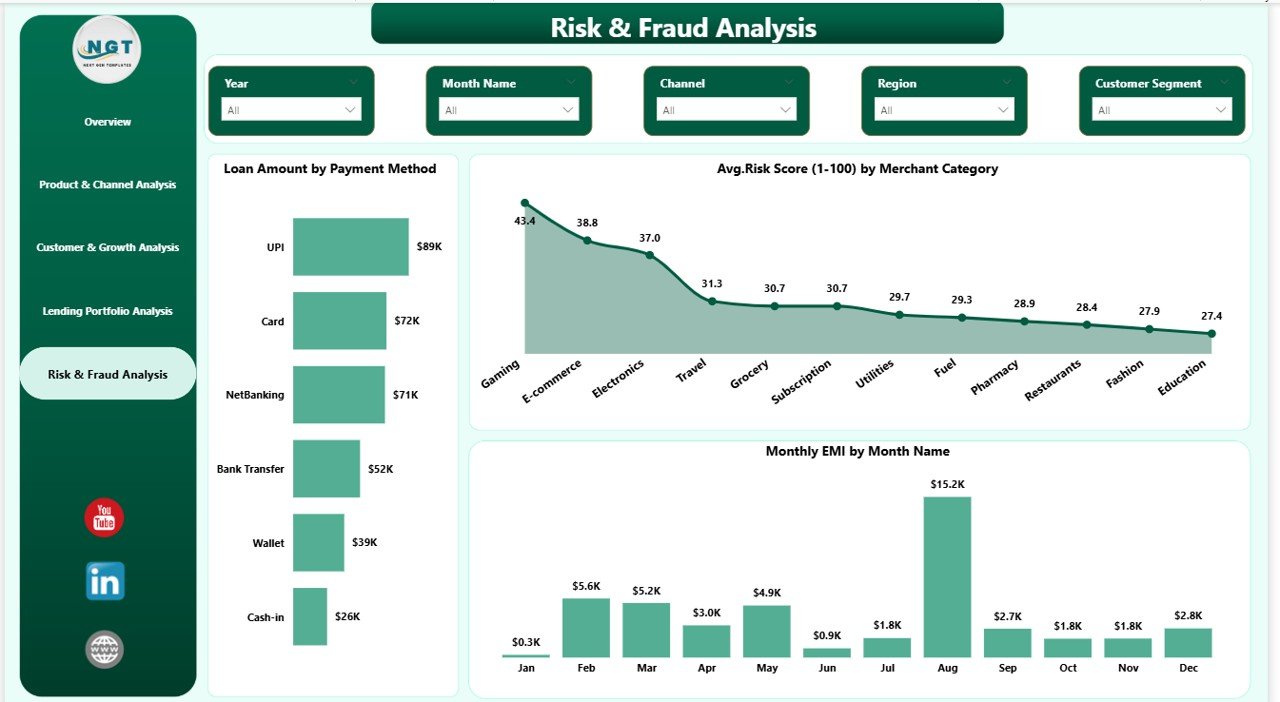
Risk & Fraud Analysis – Can You Detect Problems Early?
Risk management protects fintech sustainability. Therefore, this final page focuses on fraud and risk indicators.
Charts Included
- Loan Amount by Payment Method
- Average Risk Score (1–100) by Merchant Category
- Monthly EMI by Month Name
With this analysis, teams:
- Detect high-risk merchant categories
- Monitor payment method exposure
- Track EMI repayment trends
Because fraud detection improves financial safety, this page adds strong protective value.
Click to buy Fintech Dashboard in Power BI
What Insights Can You Generate from This Dashboard?
This dashboard helps fintech companies answer key business questions:
- Which customer segment generates the highest profit?
- Which acquisition channel brings high-risk customers?
- Are processing costs increasing month over month?
- Which product offers the best profit margin?
- Is EMI collection stable?
Therefore, leaders take data-driven decisions instead of assumptions.
Advantages of Fintech Dashboard in Power BI
A structured fintech dashboard delivers powerful benefits.
Real-Time Financial Visibility
Managers track revenue, cost, and profit instantly.
Centralized Data Control
Instead of multiple reports, teams use one dashboard.
Better Risk Monitoring
Companies detect high-risk segments early.
Improved Profitability Analysis
Decision-makers evaluate product and channel margins clearly.
Faster Decision-Making
Interactive slicers and visuals provide quick insights.
Data-Driven Growth Strategy
Marketing and finance teams align through analytics.
How Does Power BI Improve Fintech Reporting?
Power BI enhances fintech reporting through:
Interactive slicers
Drill-down analysis
Dynamic filtering
Automated calculations
Visual performance comparison
- Moreover, Power BI handles large datasets efficiently. Therefore, even fast-growing fintech firms maintain performance control.
Best Practices for the Fintech Dashboard in Power BI
To maximize results, follow these best practices:
Define Clear KPIs
Before building the dashboard, define revenue, cost, risk, and growth metrics clearly.
Maintain Clean Data
Use structured Excel or database tables. Avoid duplicate records.
Update Data Regularly
Schedule monthly or weekly updates.
Use Consistent Risk Scoring
Keep risk score logic consistent across channels.
Monitor Profit Margin Trends
Compare month-over-month changes.
Focus on Actionable Insights
Do not overload visuals. Keep analysis simple and focused.
Review Portfolio Health Monthly
Track loan exposure and default signals consistently.
Who Can Benefit from This Dashboard?
This dashboard supports:
- Fintech Founders
- CFOs and Finance Managers
- Lending Managers
- Risk Analysts
- Fraud Detection Teams
- Marketing Teams
- Business Analysts
Because the dashboard centralizes analytics, every department benefits.
How to Implement the Fintech Dashboard Successfully?
Follow these simple steps:
- Collect structured financial data.
- Import data into Power BI.
- Create calculated measures (Revenue, Margin, Risk Score).
- Build the 5-page dashboard structure.
- Test slicer performance.
- Validate data accuracy.
- Train teams to use the dashboard.
After implementation, monitor adoption regularly.
How Does This Dashboard Improve Profitability?
The dashboard improves profitability because it:
- Identifies low-margin products
- Detects high processing costs
- Highlights high-risk channels
- Monitors customer acquisition cost
- Tracks EMI collection patterns
Therefore, companies reduce waste and increase returns.
Future Scope of Fintech Analytics
Fintech analytics continues to evolve. In the future, companies may integrate:
- AI-driven risk prediction
- Automated fraud alerts
- Real-time transaction dashboards
- Predictive loan default models
- Customer behavior forecasting
However, a strong Power BI foundation prepares fintech firms for these advanced solutions.
Conclusion
The fintech industry demands precision, speed, and clarity. Without structured analytics, companies struggle to track revenue, manage risks, and optimize growth.
However, a Fintech Dashboard in Power BI brings complete visibility. It centralizes financial metrics, analyzes lending portfolios, monitors risk exposure, and tracks customer profitability.
Moreover, its five structured pages provide detailed insights into:
- Revenue performance
- Product analysis
- Customer growth
- Lending portfolio
- Risk and fraud patterns
Therefore, fintech companies that adopt this dashboard gain competitive advantage, stronger financial control, and faster decision-making power.
Frequently Asked Questions with Answers
- What is a Fintech Dashboard in Power BI?
A Fintech Dashboard in Power BI is an interactive reporting system that tracks financial, lending, and risk KPIs in one centralized platform.
- Why should fintech companies use Power BI?
Power BI offers dynamic filtering, automated calculations, and strong visualization capabilities. Therefore, it improves decision-making speed.
- Can this dashboard track risk scores?
Yes. The dashboard includes average risk score analysis by acquisition channel and merchant category.
- Does the dashboard monitor profitability?
Yes. It tracks fee revenue, interest revenue, processing costs, gross profit, and profit margin percentage.
- Who should use this dashboard?
Fintech founders, CFOs, risk analysts, lending managers, and marketing teams can use it effectively.
- Can I customize this dashboard?
Yes. You can modify KPIs, slicers, and visuals based on your business model.
- How often should I update the data?
You should update data monthly or weekly for accurate performance tracking.
Click to buy Fintech Dashboard in Power BI
Visit our YouTube channel to learn step-by-step video tutorials
Watch the step-by-step video tutorial: