Home>Blogs>Dashboard>Bridge Construction KPI Dashboard in Excel>Bridge Construction KPI Dashboard in Excel-4
Bridge Construction KPI Dashboard in Excel-4
06
Mar 2026
0Comments Off on Bridge Construction KPI Dashboard in Excel-4
PK
Meet PK, the founder of PK-AnExcelExpert.com! With over 15 years of experience in Data Visualization, Excel Automation, and dashboard creation. PK is a Microsoft Certified Professional who has a passion for all things in Excel. PK loves to explore new and innovative ways to use Excel and is always eager to share his knowledge with others. With an eye for detail and a commitment to excellence, PK has become a go-to expert in the world of Excel. Whether you're looking to create stunning visualizations or streamline your workflow with automation, PK has the skills and expertise to help you succeed. Join the many satisfied clients who have benefited from PK's services and see how he can take your Excel skills to the next level!
https://www.pk-anexcelexpert.com
Related Articles
Credit Union Dashboard in Excel
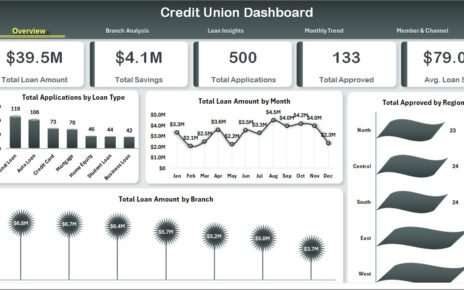
The Credit Union Dashboard in Excel tracks 5 portfolio KPIs across 5 interactive pages, with 19 pivot-driven charts and multiple
Education Services Dashboard in Power BI
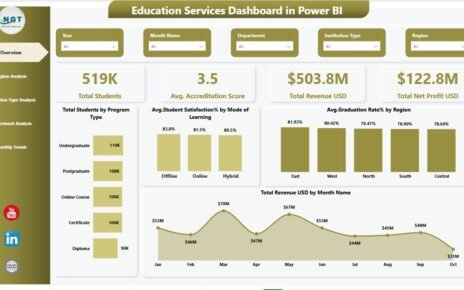
Educational institutions generate massive amounts of data every day. Schools, universities, training centers, and education service providers continuously track student
Vocational Training Dashboard in Excel
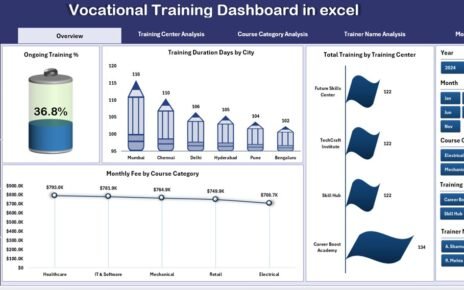
Vocational training plays a vital role in building job-ready skills across industries. Training institutes, skill development centers, NGOs, and corporate


