Airports operate as complex infrastructure hubs that connect cities, countries, and global trade routes. Every day, thousands of passengers, aircraft, and cargo shipments pass through airport facilities. Therefore, airport authorities must constantly monitor operational efficiency, infrastructure performance, safety standards, and service quality.
However, many airport management teams still rely on scattered reports, disconnected spreadsheets, and manual analysis to track performance. As a result, decision-makers struggle to identify performance gaps, monitor infrastructure utilization, and evaluate operational efficiency in real time.
Therefore, airports increasingly adopt structured performance monitoring tools to track key operational metrics.
One highly effective solution is the Airport Infrastructure KPI Dashboard in Excel. This interactive Excel dashboard helps airport authorities monitor key infrastructure metrics, analyze operational performance, compare targets with actual performance, and make data-driven decisions.
Instead of reviewing multiple reports, airport managers can monitor all important KPIs from a single centralized Excel dashboard.
In this detailed guide, you will learn:
-
What an Airport Infrastructure KPI Dashboard in Excel is
-
Why airports need a KPI dashboard
-
Key features of the Excel dashboard
-
Important airport infrastructure KPIs
-
Advantages of using the dashboard
-
Best practices for implementation
-
Practical use cases for airport authorities
Let us explore everything step by step.
Click to Purchases Airport Infrastructure KPI Dashboard in Excel
What is an Airport Infrastructure KPI Dashboard in Excel?
An Airport Infrastructure KPI Dashboard in Excel is a structured Excel-based performance monitoring tool that tracks and visualizes key performance indicators related to airport infrastructure and operations.
Airports manage a wide range of infrastructure assets such as:
-
Runways
-
Taxiways
-
Terminals
-
Baggage systems
-
Aircraft gates
-
Passenger facilities
-
Cargo handling infrastructure
-
Maintenance infrastructure
Therefore, airport management must continuously monitor performance metrics to ensure smooth operations.
The KPI dashboard helps airport authorities:
-
Track infrastructure performance
-
Monitor operational efficiency
-
Compare actual performance with targets
-
Analyze performance trends
-
Identify operational bottlenecks
-
Improve decision making
Excel dashboards provide a flexible and cost-effective solution because most organizations already use Microsoft Excel.
As a result, airport managers can monitor performance without implementing expensive software systems.
Click to Purchases Airport Infrastructure KPI Dashboard in Excel
Why Do Airports Need an Infrastructure KPI Dashboard?
Airport infrastructure management requires continuous monitoring of operations and facilities. However, manual monitoring often causes delays and errors.
Therefore, a KPI dashboard becomes essential.
Key reasons airports need a KPI dashboard
1. Monitor infrastructure performance
Airport authorities must track runway utilization, terminal capacity, and gate occupancy. A KPI dashboard helps managers monitor these metrics easily.
2. Improve operational efficiency
When management teams track operational KPIs regularly, they can identify inefficiencies quickly.
3. Support data-driven decision making
The dashboard provides real-time performance insights. As a result, decision makers can take corrective actions faster.
4. Track progress against targets
Airport management sets operational targets every year. The dashboard compares Actual vs Target performance, which helps managers evaluate progress.
5. Analyze historical trends
The dashboard also compares performance with the previous year. Therefore, managers can identify improvement areas.
Click to Purchases Airport Infrastructure KPI Dashboard in Excel
Key Features of Airport Infrastructure KPI Dashboard in Excel
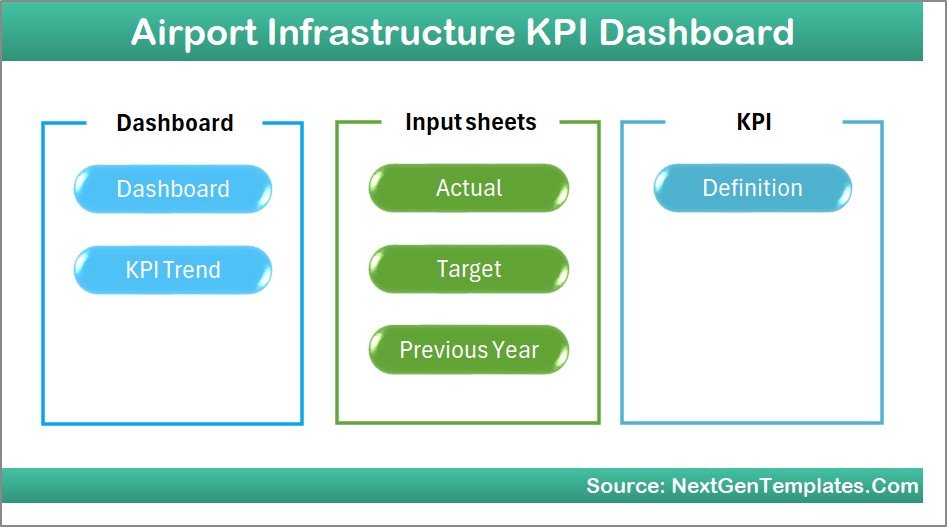
The Airport Infrastructure KPI Dashboard in Excel provides a ready-to-use performance tracking system. It includes multiple interactive worksheets that help users monitor KPIs effectively.
The dashboard contains 7 worksheets designed to track and analyze airport infrastructure performance.
1. Home Sheet
The Home sheet acts as the navigation hub of the dashboard.
It allows users to access different sections quickly.
Key features
-
Central index sheet
-
Six navigation buttons
-
Quick access to all dashboard pages
-
User-friendly layout
As a result, users can easily navigate through the dashboard without searching for individual sheets.
Click to Purchases Airport Infrastructure KPI Dashboard in Excel
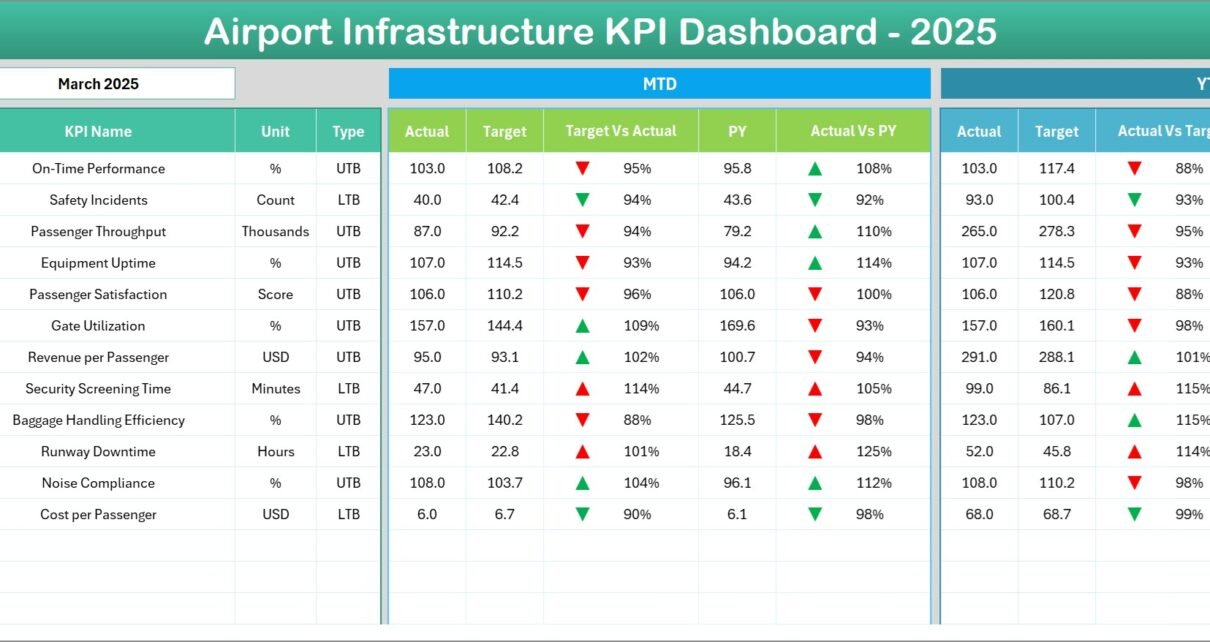
2. Dashboard Sheet (Main KPI Dashboard)
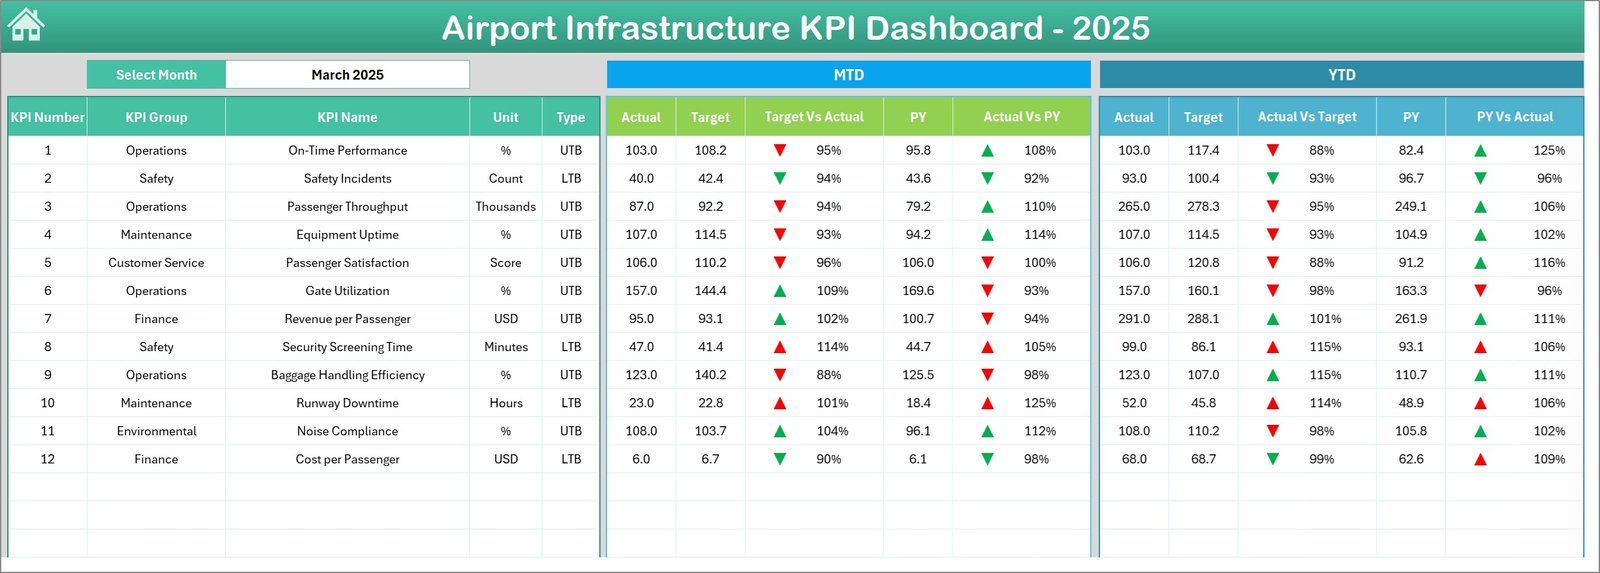
The Dashboard sheet displays the main performance overview of all KPIs.
This sheet provides a high-level summary of infrastructure performance metrics.
Interactive Month Selection
On cell D3, users can select the Month from a drop-down menu.
Once the user selects a month, the entire dashboard updates automatically.
KPI Performance Metrics Displayed
The dashboard shows the following values:
MTD (Month-to-Date)
-
Actual performance
-
Target value
-
Previous year value
YTD (Year-to-Date)
-
Actual performance
-
Target value
-
Previous year value
Performance Comparison
The dashboard also displays:
-
Target vs Actual comparison
-
Previous Year vs Actual comparison
Conditional Formatting Indicators
The dashboard uses up and down arrows to show performance status.
For example:
-
🔼 Green arrow → KPI performance improved
-
🔽 Red arrow → KPI performance declined
Therefore, managers can instantly identify strong and weak performance areas.
Click to Purchases Airport Infrastructure KPI Dashboard in Excel
3. KPI Trend Sheet
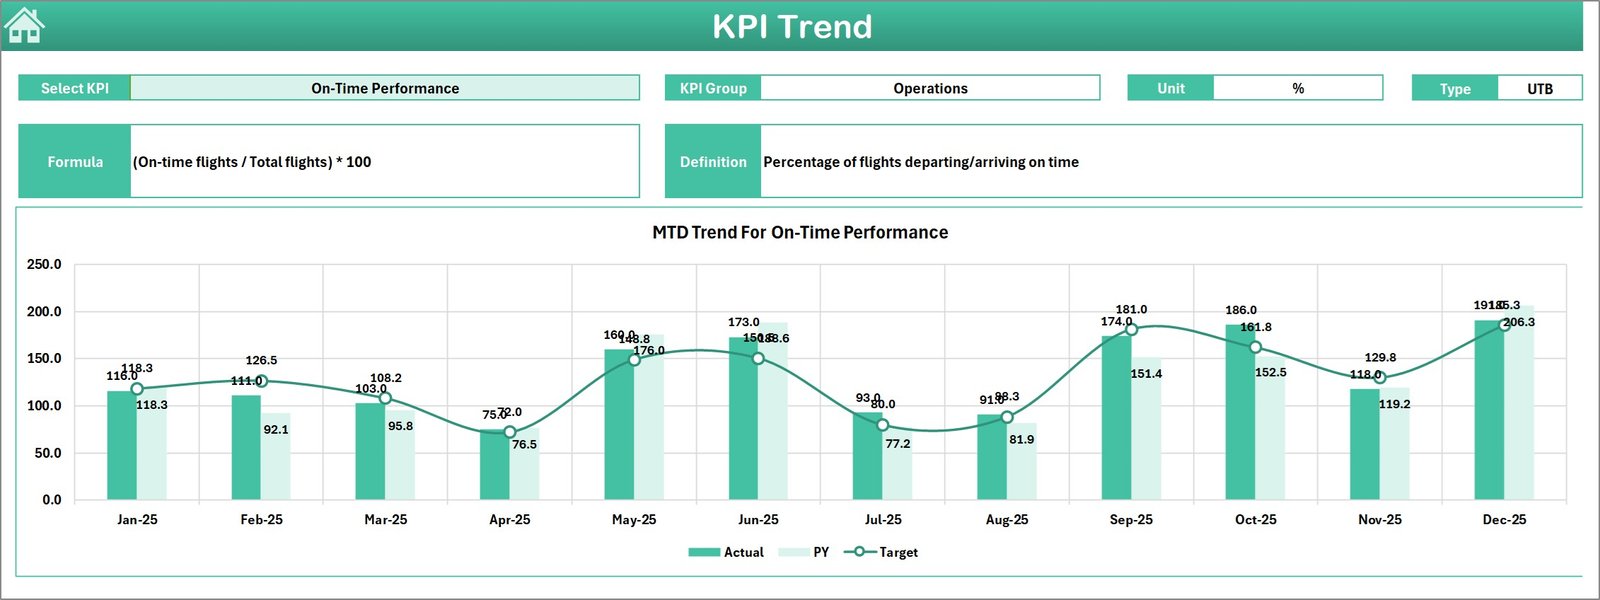
The KPI Trend sheet allows users to analyze the performance trend of a specific KPI.
KPI Selection
Users can select a KPI Name from the drop-down list in cell C3.
Once selected, the sheet displays detailed KPI information.
KPI Information Displayed
The sheet displays the following details:
-
KPI Group
-
KPI Unit
-
KPI Type
-
KPI Formula
-
KPI Definition
KPI Types
The dashboard categorizes KPIs as:
-
Upper the Better (higher values indicate better performance)
-
Lower the Better (lower values indicate better performance)
Trend Analysis Charts
The sheet also shows two trend charts:
-
MTD Trend Chart
-
YTD Trend Chart
Each chart compares:
-
Actual performance
-
Target values
-
Previous year performance
Therefore, airport managers can easily analyze performance changes over time.
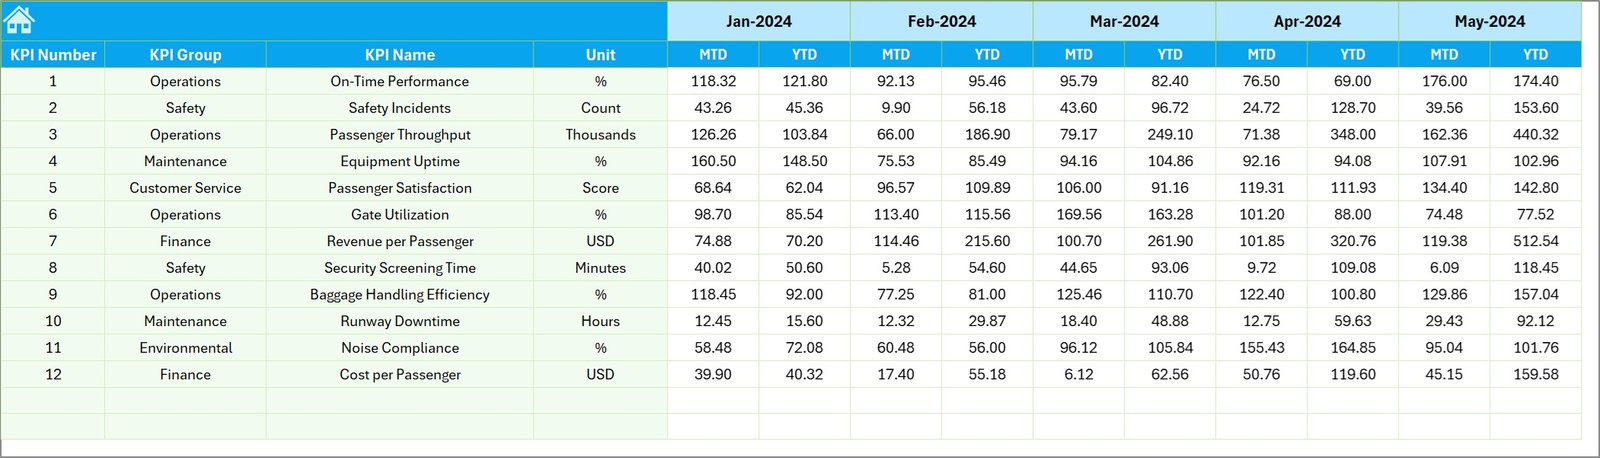
4. Actual Numbers Input Sheet
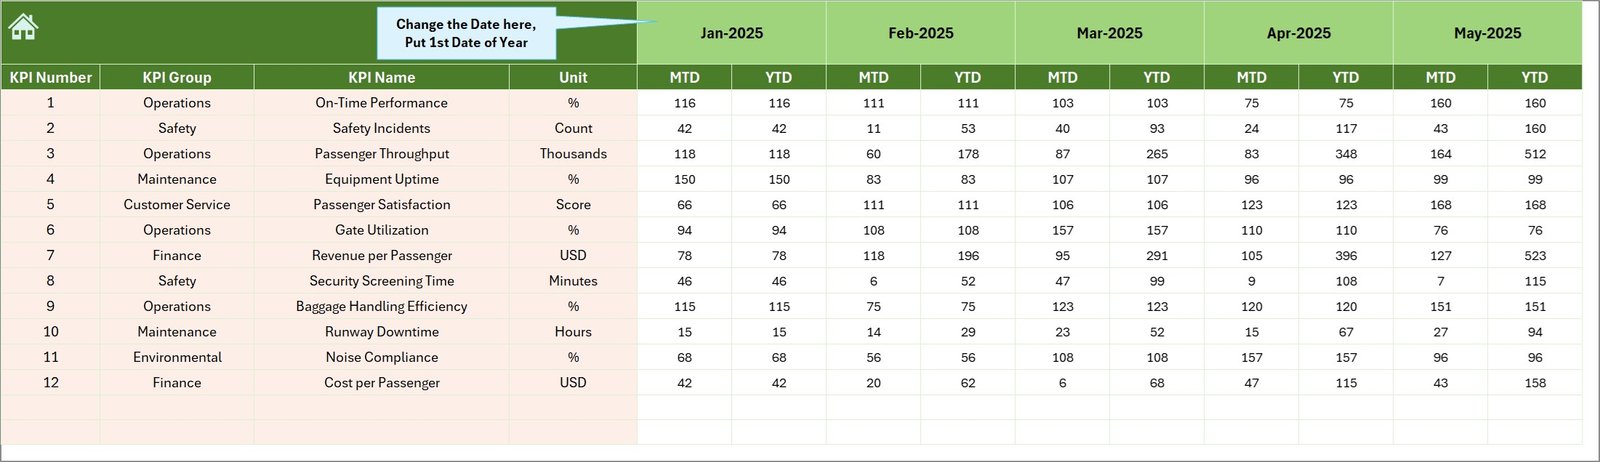
The Actual Numbers Input sheet captures the real operational performance data.
Users must enter monthly data in this sheet.
Key Features
-
Data input sheet
-
Monthly data entry structure
-
MTD and YTD performance entry
Users can change the starting month using cell E1.
Once users enter the first month of the year, the dashboard automatically adjusts the timeline.
Click to Purchases Airport Infrastructure KPI Dashboard in Excel
5. Target Sheet
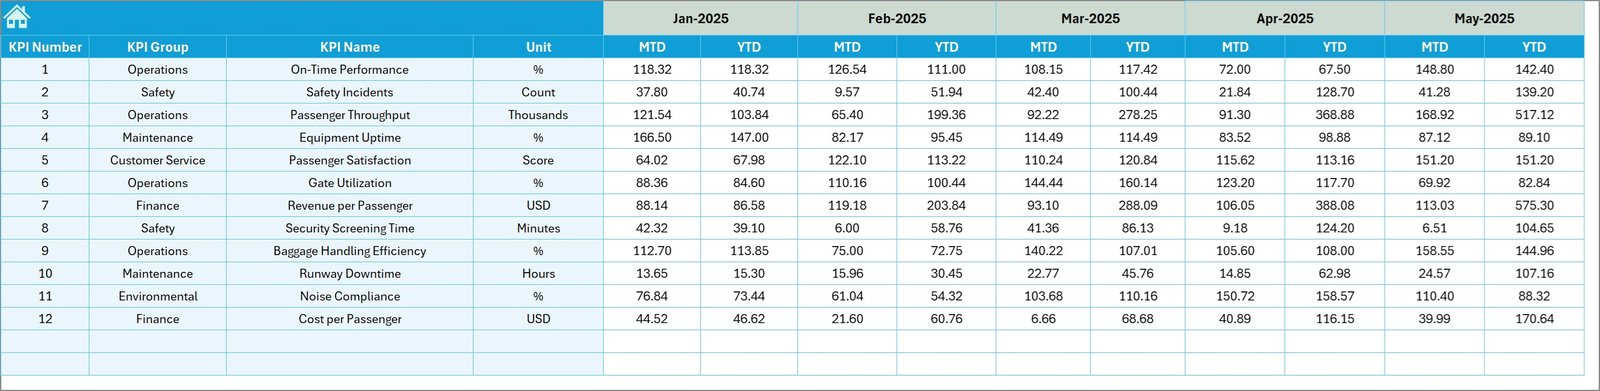
The Target sheet stores performance targets for each KPI.
Airport authorities usually define operational targets at the beginning of the year.
Therefore, users must enter target values for:
-
MTD targets
-
YTD targets
The dashboard then compares these targets with actual performance.
6. Previous Year Numbers Sheet
The Previous Year Numbers sheet stores historical performance data.
Users must enter previous year data similar to current year data.
This sheet enables:
-
Historical comparison
-
Trend analysis
-
Performance benchmarking
As a result, airport management can measure improvement year over year.
Click to Purchases Airport Infrastructure KPI Dashboard in Excel
7. KPI Definition Sheet
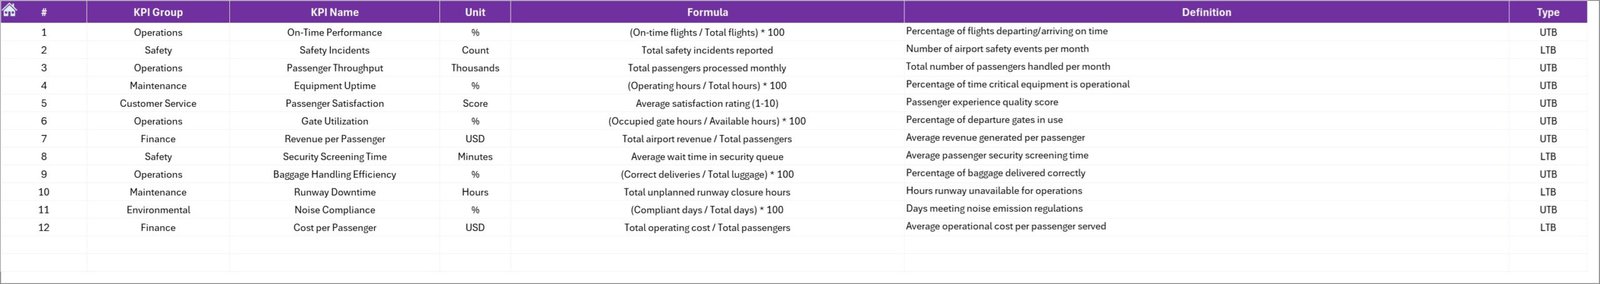
The KPI Definition sheet acts as the KPI master data sheet.
This sheet defines each KPI clearly.
Information stored in this sheet
-
KPI Name
-
KPI Group
-
Unit of measurement
-
KPI Formula
-
KPI Definition
Because this information exists in one place, users can maintain KPI consistency across the dashboard.
Important KPIs for Airport Infrastructure
Airports track many infrastructure performance metrics. Some commonly used KPIs include:
Infrastructure Utilization KPIs
-
Runway utilization rate
-
Gate occupancy rate
-
Terminal capacity utilization
-
Aircraft parking utilization
Operational Efficiency KPIs
-
Aircraft turnaround time
-
Average taxi time
-
Baggage handling time
-
Passenger processing time
Safety KPIs
-
Safety incidents
-
Runway incursions
-
Equipment failure rate
-
Maintenance response time
Service Quality KPIs
-
Passenger satisfaction score
-
Security screening wait time
-
Baggage delivery time
Financial KPIs
-
Infrastructure maintenance cost
-
Terminal operating cost
-
Energy consumption cost
Monitoring these KPIs helps airport authorities maintain operational efficiency.
Click to Purchases Airport Infrastructure KPI Dashboard in Excel
Advantages of Airport Infrastructure KPI Dashboard in Excel
Using a structured Excel dashboard provides many operational benefits.
📊 Centralized KPI Monitoring
The dashboard consolidates all performance metrics in one place. Therefore, management teams can monitor KPIs quickly.
📈 Real-Time Performance Tracking
Managers can track monthly and yearly performance instantly.
🎯 Target vs Actual Monitoring
The dashboard highlights performance gaps between targets and actual results.
📉 Historical Comparison
Previous year comparison helps management evaluate progress.
⚡ Faster Decision Making
Since data appears visually, managers can identify problems faster.
💻 Easy Implementation
Most organizations already use Excel. Therefore, the dashboard requires no additional software.
📊 Data Visualization
Charts and conditional formatting make the data easier to understand.
Click to Purchases Airport Infrastructure KPI Dashboard in Excel
Best Practices for the Airport Infrastructure KPI Dashboard
To maximize the value of the dashboard, organizations should follow some best practices.
Define clear KPIs
First, airport authorities must define KPIs clearly. Each KPI must have a clear formula and definition.
Maintain accurate data
Data accuracy plays a critical role in dashboard reliability. Therefore, teams must verify input data regularly.
Update data regularly
Users should update actual performance data every month.
Align KPIs with strategic goals
KPIs should reflect the strategic goals of airport infrastructure management.
Use trend analysis
Trend analysis helps management detect long-term patterns.
Train users
Organizations should train staff members on how to use the dashboard effectively.
Click to Purchases Airport Infrastructure KPI Dashboard in Excel
Practical Use Cases of Airport Infrastructure KPI Dashboard
Airport authorities can use this dashboard in multiple operational scenarios.
Airport Operations Management
Operations managers can monitor infrastructure utilization daily.
Infrastructure Maintenance Planning
Maintenance teams can analyze equipment performance and schedule repairs.
Government Reporting
Airports often report performance metrics to government agencies.
Strategic Planning
Airport authorities can analyze long-term trends and plan infrastructure expansion.
Budget Planning
Finance teams can track infrastructure costs and optimize budgets.
How Does the Dashboard Improve Airport Management?
The dashboard significantly improves airport management efficiency.
First, it simplifies performance tracking.
Second, it improves transparency.
Third, it supports proactive decision making.
When airport managers monitor KPIs regularly, they can detect problems early.
For example:
-
Delays in baggage handling
-
Underutilized airport gates
-
Increasing runway congestion
Therefore, management teams can take corrective action before issues escalate.
Future of Airport Infrastructure Analytics
Airports increasingly adopt data analytics to improve operations.
In the future, infrastructure dashboards will integrate with:
-
IoT sensors
-
Smart airport systems
-
Real-time flight data
-
Predictive maintenance systems
-
Artificial intelligence
However, Excel dashboards will continue to play an important role because they provide simple and flexible analytics solutions.
Conclusion
Airport infrastructure management requires accurate monitoring of operational performance. However, manual tracking systems often create delays and confusion.
The Airport Infrastructure KPI Dashboard in Excel provides a structured and efficient solution for monitoring airport performance.
This dashboard helps airport authorities:
-
Track operational KPIs
-
Compare actual vs target performance
-
Analyze historical trends
-
Improve decision making
Because the dashboard uses Excel, organizations can implement it easily without expensive software.
Therefore, airport management teams can gain better visibility into infrastructure performance and improve overall operational efficiency.
Click to Purchases Airport Infrastructure KPI Dashboard in Excel
Frequently Asked Questions (FAQs)
What is an Airport Infrastructure KPI Dashboard?
An Airport Infrastructure KPI Dashboard is an Excel-based tool that tracks key performance indicators related to airport infrastructure and operations.
Why should airports use KPI dashboards?
Airports should use KPI dashboards to monitor operational efficiency, track infrastructure utilization, and support data-driven decision making.
Can Excel handle airport infrastructure analytics?
Yes. Excel provides powerful tools such as pivot tables, charts, formulas, and conditional formatting that support performance monitoring dashboards.
What types of KPIs are included in airport dashboards?
Airport dashboards usually include KPIs related to infrastructure utilization, operational efficiency, safety performance, service quality, and financial performance.
How often should airport KPI dashboards be updated?
Organizations should update KPI dashboards monthly or weekly depending on operational requirements.
Click to Purchases Airport Infrastructure KPI Dashboard in Excel
Visit our YouTube channel to learn step-by-step video tutorials