Wholesale businesses work in a fast-moving environment. Every day, teams handle large orders, manage customer accounts, track delivery performance, monitor margins, and control stock flow. Because of this, managers need clear numbers to measure performance. However, many wholesale businesses still depend on scattered spreadsheets, manual reports, and separate files. As a result, decision-making becomes slow and performance gaps stay hidden for too long.
That is exactly why a Wholesale KPI Scorecard in Excel becomes so useful.
A well-designed KPI scorecard helps wholesale companies track their most important numbers in one place. Instead of jumping between multiple reports, decision-makers can quickly compare actual results with targets, review month-to-date and year-to-date performance, and spot areas that need attention. In addition, Excel makes the process simple, flexible, and affordable for many businesses.
In this article, you will learn what a Wholesale KPI Scorecard in Excel is, why wholesale companies need it, what features it includes, which KPIs matter most, and how to use it effectively. You will also find the advantages, opportunities for improvement, best practices, and frequently asked questions with answers at the end.
Click to buy Wholesale KPI Scorecard in Excel
What Is a Wholesale KPI Scorecard in Excel?
A Wholesale KPI Scorecard in Excel is a structured reporting tool that helps businesses track, compare, and analyze key performance indicators related to wholesale operations. It brings all important performance metrics into one dashboard-style workbook so that managers can review progress quickly and take action faster.
In simple words, it tells you whether your wholesale business is moving in the right direction.
For example, a wholesale company may want to track:
- Total sales
- Gross margin
- Order fulfillment rate
- Average order value
- Inventory turnover
- Customer retention
- Delivery performance
- Return rate
- Outstanding receivables
- Sales growth
Instead of checking these figures one by one, the scorecard shows them together in a clean and organized format. Therefore, managers can easily compare actual vs target, review MTD and YTD numbers, and understand business trends clearly.
Why Do Wholesale Businesses Need KPI Tracking?
Wholesale businesses deal with many moving parts. They serve multiple customers, manage bulk products, coordinate with suppliers, and control large transaction volumes. So, if they do not track performance properly, even small issues can grow into big losses.
Here is why KPI tracking matters in wholesale:
- It helps managers measure business performance clearly.
- It shows where targets are being met or missed.
- It improves planning and decision-making.
- It highlights sales, stock, and service issues early.
- It supports accountability across departments.
- It helps teams focus on goals that matter most.
For instance, if your sales look strong but your profit margin is falling, the scorecard reveals that issue quickly. Similarly, if delivery performance drops while customer complaints rise, managers can connect both issues and act immediately.
Because of this, KPI tracking does not just report numbers. It supports better business control.
Why Use Excel for a Wholesale KPI Scorecard?
Many businesses choose Excel because it is practical, familiar, and flexible. While advanced BI tools have their place, Excel remains one of the most popular platforms for scorecards, especially for small and mid-sized wholesale companies.
Excel offers several benefits:
- It is easy to use and widely available.
- It supports formulas, charts, drop-downs, and formatting.
- It allows quick updates when new data comes in.
- It works well for monthly and yearly reviews.
- It can handle structured KPI definitions and input data.
- It provides a cost-effective solution without complex setup.
Moreover, Excel lets businesses customize the scorecard based on their own KPIs, targets, and reporting style. So, instead of depending on a rigid system, teams can build a scorecard that fits their exact wholesale operations.
What Are the Key Features of the Wholesale KPI Scorecard in Excel?
This ready-to-use template includes 4 worksheets, and each sheet serves a clear purpose. Together, they create a complete KPI management system for wholesale businesses.
What Does the Scorecard Sheet Show?
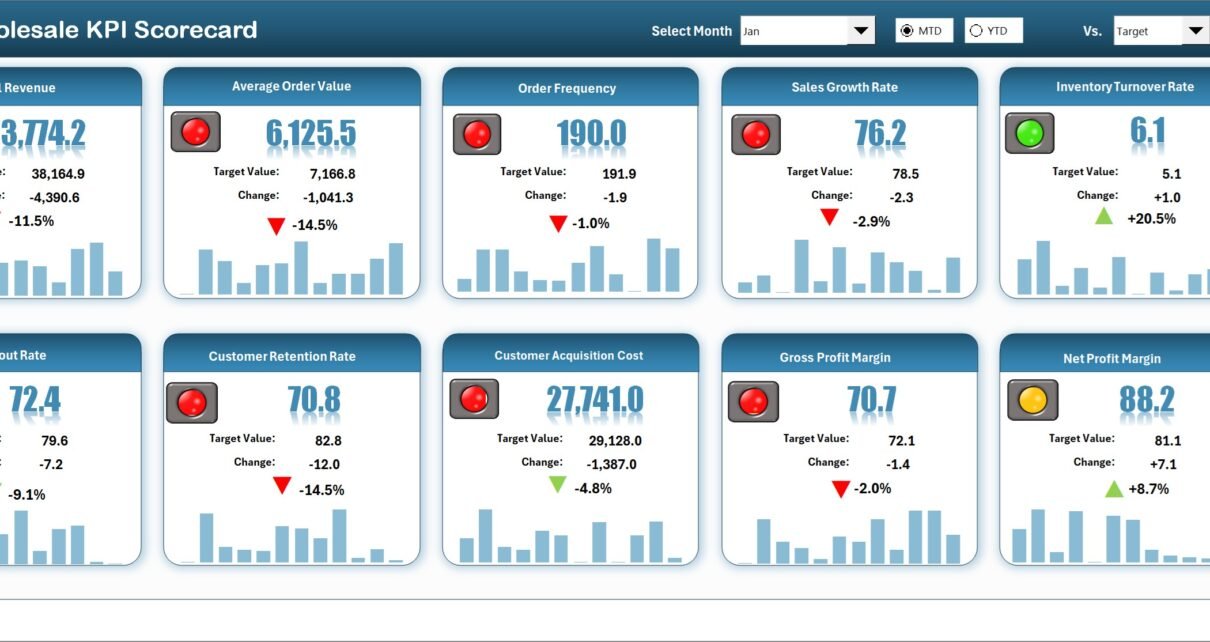
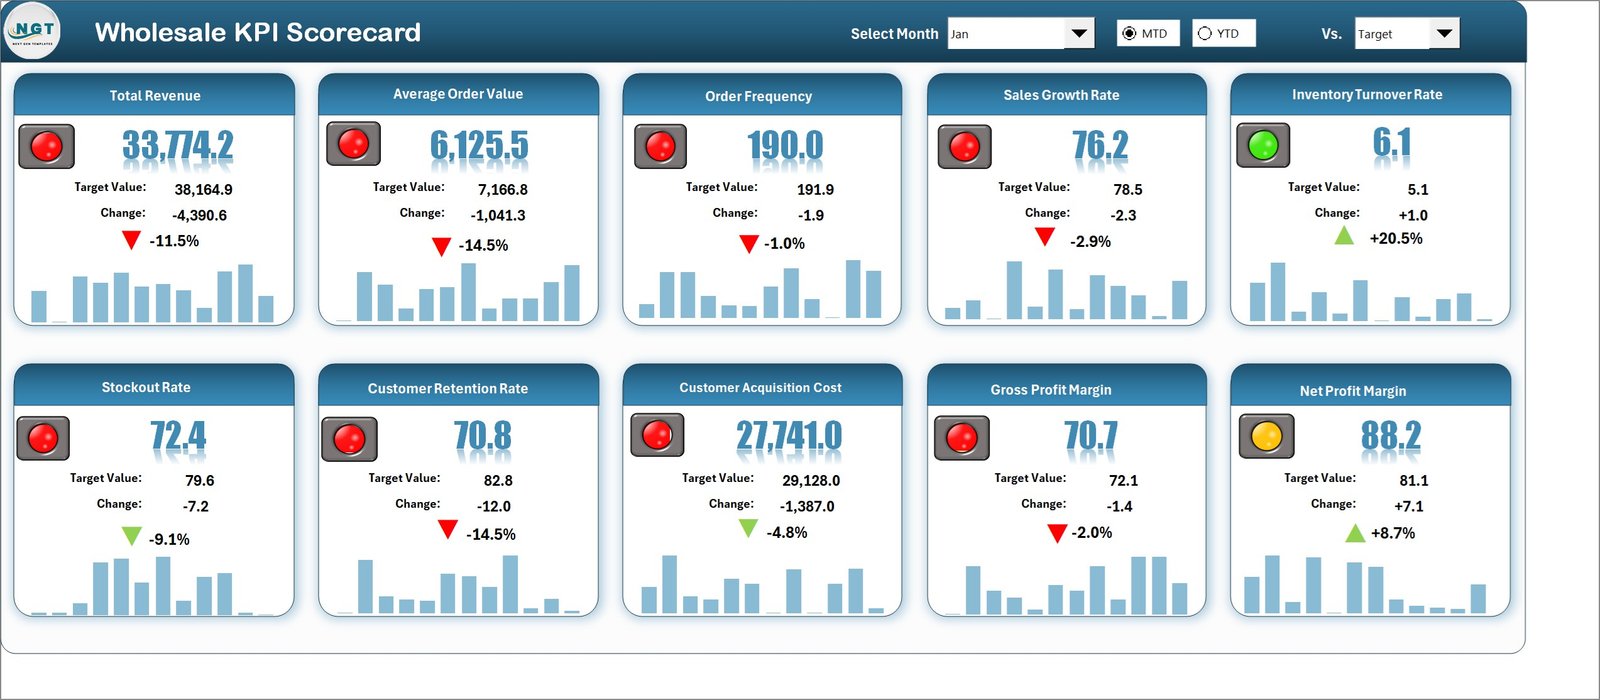
The Scorecard Sheet is the main interface of the workbook. This is where users can view KPI performance in a summary format.
Key features of the Scorecard Sheet:
- Dropdown Menus: Users can select the month and choose between MTD (Month-to-Date) and YTD (Year-to-Date) analysis.
- Actual vs Target Values: The sheet compares actual performance against planned targets.
- Visual Indicators: Color-coded formatting or status signals quickly show strong and weak performance.
- Comprehensive KPI Overview: Users can see all relevant KPI details together.
- 10 KPIs in One View: The scorecard displays 10 KPIs on a single screen for quick review.
Because of this layout, managers can instantly understand which KPIs perform well and which ones need attention. Instead of reading long reports, they can review a complete performance summary in just a few moments.
Click to buy Wholesale KPI Scorecard in Excel
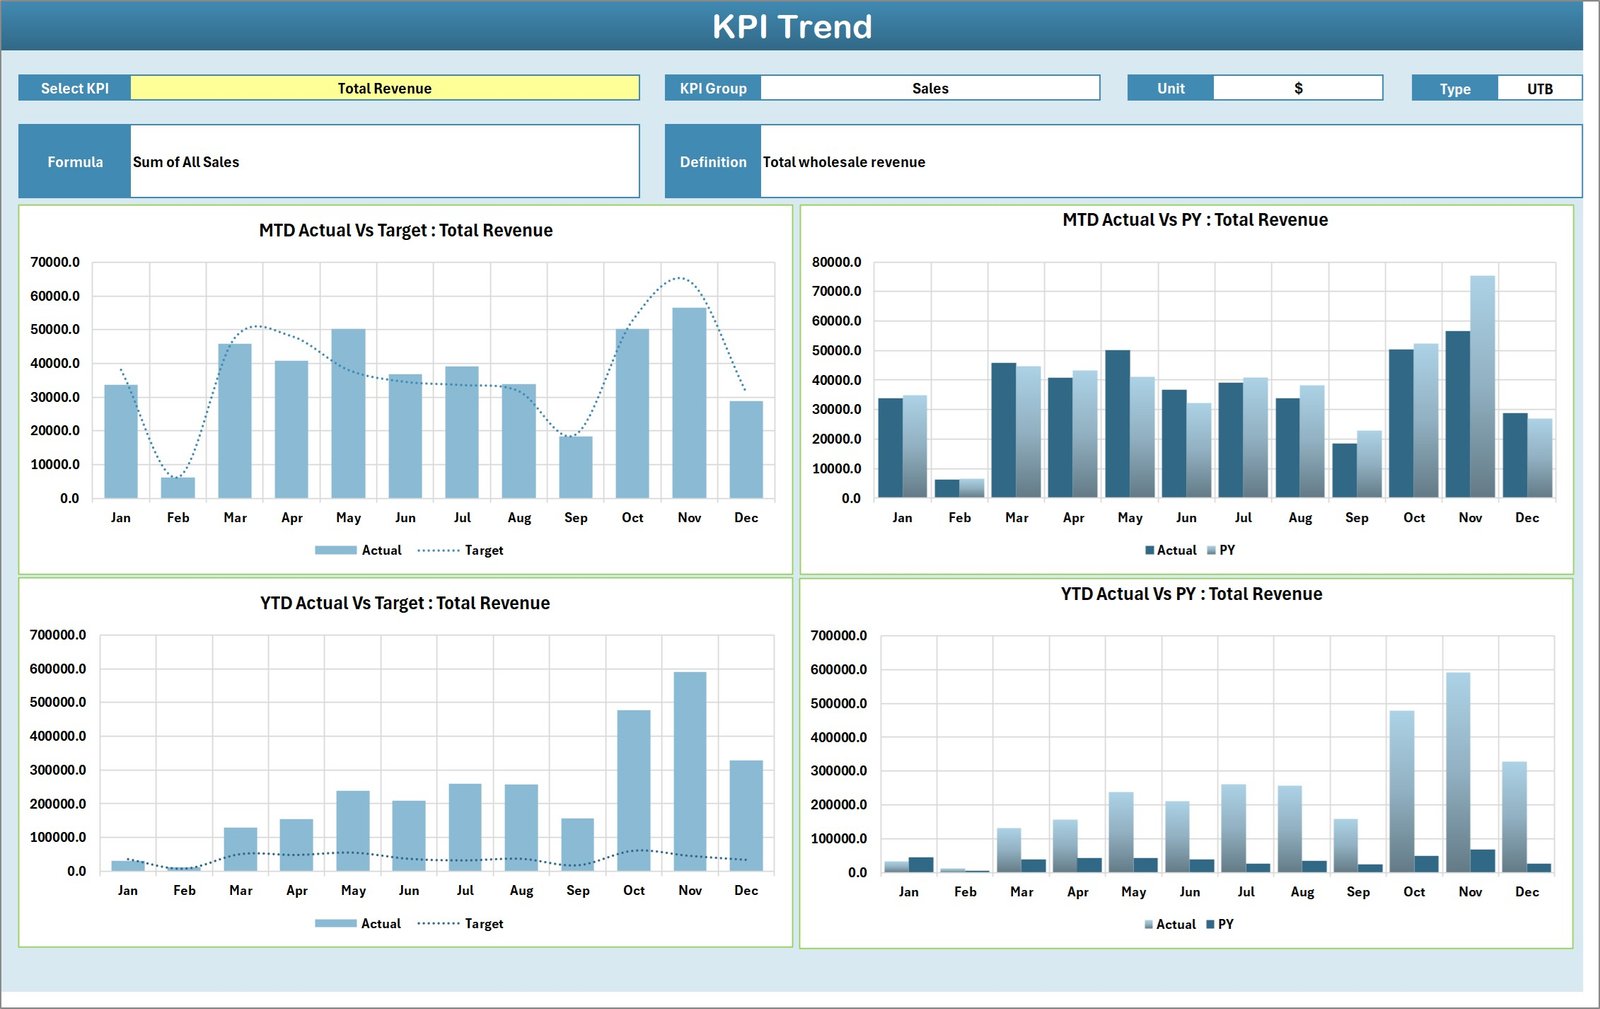
What Happens in the KPI Trend Sheet?
The KPI Trend Sheet gives users a deeper view of each KPI over time. While the Scorecard Sheet provides a summary, this sheet supports detailed trend analysis.
Key features of the KPI Trend Sheet:
- Select the KPI name from the dropdown in cell C3
- View the KPI Group
- View the Unit of KPI
- View the Type of KPI such as:
- Lower the Better
- Upper the Better
- View the Formula of the KPI
- View the Definition of the KPI
- Analyze MTD and YTD trend charts
- Compare Actual, Target, and Previous Year (PY) values
This sheet becomes very useful when managers want to understand why a KPI changed. For example, if gross margin drops or order fulfillment weakens, the trend chart helps users review past movement and compare it with targets and previous year numbers.
Therefore, this sheet supports stronger analysis and better planning.
Click to buy Wholesale KPI Scorecard in Excel
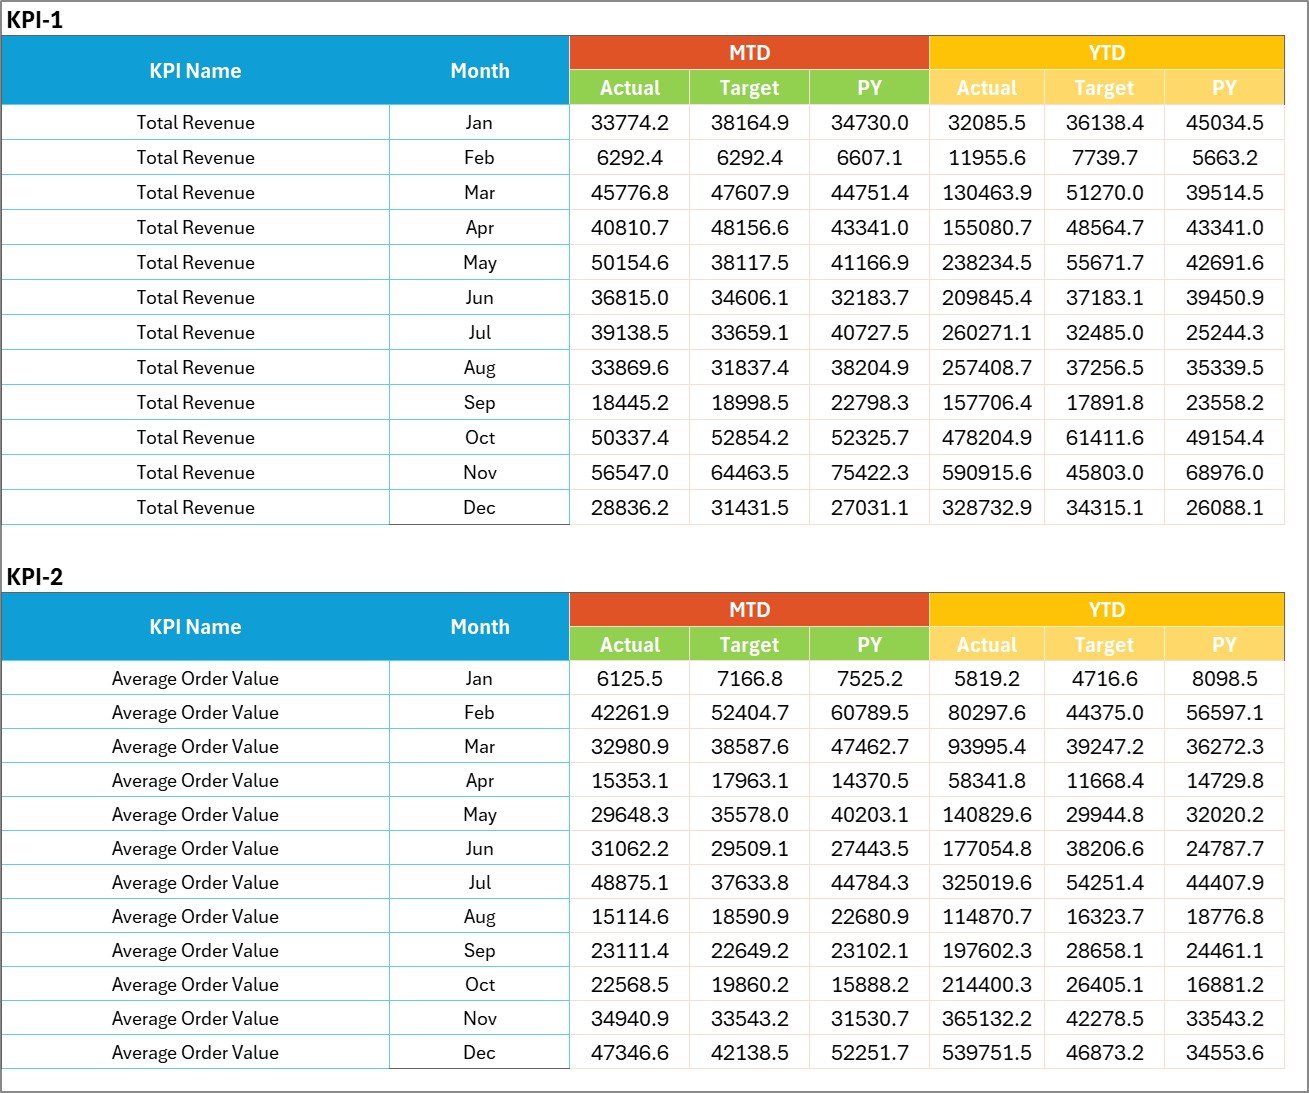
Why Is the Input Data Sheet Important?
The Input Data Sheet is the backbone of the scorecard. This is where users enter KPI values and keep the workbook updated.
Main purposes of the Input Data Sheet:
- Record actual KPI values
- Enter target values
- Maintain period-wise data
- Update the scorecard when new results arrive
- Keep the entire workbook current and accurate
Since the dashboard depends on the quality of entered data, this sheet plays a critical role. If the data stays organized and accurate, the scorecard remains trustworthy. On the other hand, poor data entry creates poor analysis.
So, regular updates in this sheet help maintain the value of the KPI scorecard.
Click to buy Wholesale KPI Scorecard in Excel
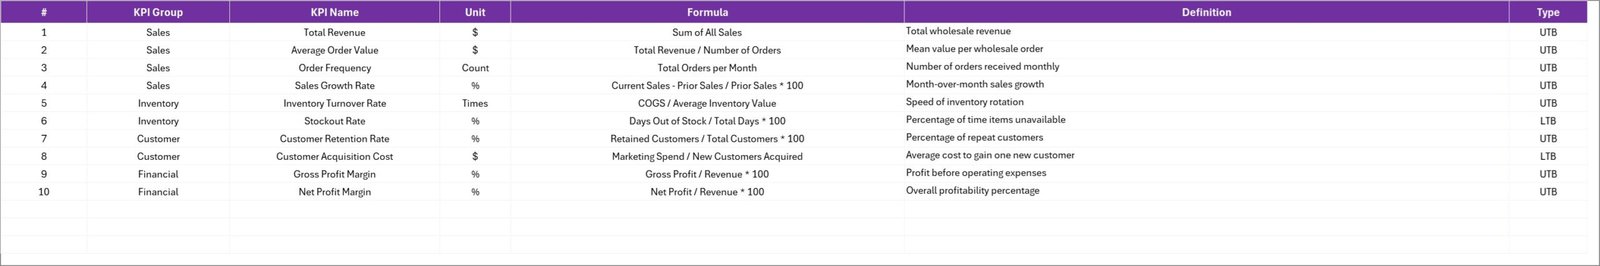
What Does the KPI Definition Sheet Include?
The KPI Definition Sheet works as the reference library of the workbook. It stores the master information related to each KPI.
This sheet includes:
- KPI Name
- KPI Group
- Unit
- Formula
- KPI Definition
This sheet improves consistency. For example, every user can understand what a KPI means, how it is calculated, and how it should be interpreted. As a result, confusion reduces and reporting becomes more reliable across the team.
Click to buy Wholesale KPI Scorecard in Excel
Which KPIs Can You Track in a Wholesale KPI Scorecard?
Wholesale businesses can track different KPIs depending on their products, customers, and business model. However, some KPIs remain useful for most companies.
Common wholesale KPIs include:
- Total Sales Revenue
- Sales Growth %
- Gross Profit Margin %
- Net Profit Margin %
- Average Order Value
- Order Fulfillment Rate %
- On-Time Delivery %
- Inventory Turnover Ratio
- Return Rate %
- Customer Retention Rate %
- New Customers Acquired
- Outstanding Receivables
- Days Sales Outstanding
- Order Accuracy %
- Backorder Rate %
- Stock Availability %
- Sales per Customer
- Sales per Product Category
- Target Achievement %
- Previous Year Comparison %
For example, a wholesale distributor may track inventory turnover closely, while another may focus more on delivery performance and receivables. Therefore, the scorecard should align with the business goals.
How Does a Wholesale KPI Scorecard Improve Decision-Making?
A KPI scorecard improves decision-making because it converts raw data into clear business signals. Managers do not need to guess what is happening. Instead, they can see real performance against targets.
It helps managers:
- identify weak areas quickly
- measure progress month by month
- compare trends over time
- set better targets
- improve team accountability
- respond faster to business issues
For instance, if customer retention falls while sales acquisition rises, managers may realize they win new customers but fail to keep existing ones. Similarly, if sales grow but receivables also rise sharply, the company may face cash flow pressure.
Because of this, the scorecard supports smarter, faster, and more informed action.
How Can Wholesale Teams Use This Excel Scorecard Daily or Monthly?
This scorecard can support both daily review and monthly management reporting. While some KPIs may update weekly or monthly, many businesses use the scorecard during routine performance meetings.
Typical usage process:
- Enter the latest KPI data in the Input Data Sheet.
- Update target values if needed.
- Review the Scorecard Sheet for quick performance status.
- Use the dropdown to switch between MTD and YTD views.
- Check the KPI Trend Sheet for deeper trend analysis.
- Review the KPI Definition Sheet when clarification is needed.
- Discuss missed targets and action plans in review meetings.
This workflow keeps reporting simple and practical. In addition, it encourages teams to focus on action instead of only reporting numbers.
What Makes This Wholesale KPI Scorecard Template Practical?
This template is practical because it combines simplicity with useful analysis. It does not overload users with too many pages or unnecessary complexity. Instead, it focuses on what managers need most.
Practical strengths of the template:
- clear layout
- easy navigation
- structured data entry
- direct actual vs target comparison
- trend visibility
- KPI definitions for clarity
- one-view summary of 10 KPIs
- MTD and YTD analysis support
Therefore, it works well for business owners, sales managers, operations managers, finance teams, and reporting analysts.
Advantages of Wholesale KPI Scorecard in Excel
A good KPI scorecard gives wholesale businesses much more than a simple report. It creates visibility, improves control, and supports better business planning.
Advantages of Wholesale KPI Scorecard in Excel
- Centralized performance tracking: It brings important wholesale KPIs into one structured file.
- Easy actual vs target review: Managers can quickly compare planned and actual results.
- Better visibility: Color indicators and organized layouts highlight strong and weak areas instantly.
- Improved trend analysis: MTD, YTD, and previous year comparisons help users understand performance movement.
- Faster decision-making: Teams can act early when they notice missed targets or falling trends.
- Cost-effective solution: Excel offers a practical reporting platform without expensive software.
- Flexible design: Businesses can customize KPIs, formulas, and data structures based on their own needs.
- Simple to maintain: Users can update the Input Data Sheet as new figures become available.
- Better accountability: Each KPI creates focus for different departments and business functions.
- Useful for review meetings: Managers can use the scorecard during weekly, monthly, or quarterly discussions.
Opportunities for Improvement in a Wholesale KPI Scorecard
Even a good scorecard can become stronger with regular improvement. As the business grows, reporting needs may also change. Therefore, teams should review the scorecard from time to time and improve it where needed.
Opportunities for Improvement
- Add more business-specific KPIs: Include KPIs for logistics, customer service, product category, or regional performance.
- Improve automation: Use formulas, structured tables, and dynamic ranges to reduce manual work.
- Add department-level views: Create separate sections for sales, inventory, finance, and operations.
- Include commentary fields: Allow users to note reasons for missed targets or unusual trends.
- Track action plans: Add a follow-up column for corrective steps and responsibilities.
- Expand historical analysis: Store longer time-series data for stronger year-over-year comparison.
- Improve visual design: Use cleaner formatting, icons, and better chart presentation.
- Add drill-down analysis: Link high-level KPIs to detailed transaction or category-level data.
- Strengthen data validation: Reduce input errors with controlled entry fields and validation rules.
- Create print-friendly reports: Design summary sections for presentations and management review packs.
Best Practices for the Wholesale KPI Scorecard in Excel
Using a KPI scorecard effectively requires more than just entering numbers. Teams need a clear process, accurate definitions, and regular review discipline. Otherwise, the scorecard becomes just another spreadsheet.
Best Practices for the Wholesale KPI Scorecard in Excel
- Define each KPI clearly: Always mention the KPI name, formula, unit, and definition.
- Track only useful KPIs: Focus on indicators that directly support wholesale business goals.
- Update data regularly: Keep the Input Data Sheet current to maintain reliable analysis.
- Review MTD and YTD together: This gives both short-term and long-term performance visibility.
- Use realistic targets: Set targets that challenge the team but remain achievable.
- Compare with previous year data: PY comparison helps users understand improvement or decline better.
- Keep formatting simple: Clear visuals help users understand results faster.
- Use consistent formulas: Avoid changing KPI logic from one period to another.
- Validate input data: Check entries before final reporting to avoid wrong decisions.
- Discuss KPIs in meetings: Use the scorecard as a management tool, not just a reporting file.
- Assign ownership: Every KPI should have a responsible team or manager.
- Review and improve the template: Adjust the scorecard as business needs evolve.
How Can You Get the Most Value from This Template?
To get the best results, businesses should not treat the scorecard as a static file. Instead, they should use it actively in planning, monitoring, and problem-solving.
You can get more value by:
- linking KPI reviews with monthly business meetings
- using trend charts to investigate performance drops
- setting action plans for missed targets
- reviewing target-setting methods every quarter
- training users on KPI meaning and interpretation
- customizing the workbook based on product lines or business units
When teams use the scorecard in this way, it becomes a business control tool rather than only a reporting sheet.
Why Is a Wholesale KPI Scorecard Important for Growth?
Growth in wholesale does not depend only on increasing sales. It also depends on efficiency, margin control, service quality, customer retention, and cash flow discipline. Therefore, a wholesale business needs balanced visibility across many areas.
A KPI scorecard helps create that visibility.
It allows leaders to monitor performance in a structured way. It highlights weak spots before they grow into large problems. It supports target-based management. Most importantly, it helps businesses move from reactive management to proactive management.
So, whether you run a small distribution company or a large wholesale operation, this scorecard can support stronger control and better growth decisions.
Conclusion
A Wholesale KPI Scorecard in Excel is a practical and powerful tool for tracking business performance. It gives wholesale companies a simple way to monitor their most important KPIs, compare actual values with targets, and analyze MTD, YTD, and previous year trends.
This ready-to-use template becomes even more valuable because it includes four structured worksheets: the Scorecard Sheet, KPI Trend Sheet, Input Data Sheet, and KPI Definition Sheet. Together, these sheets help users review performance, analyze trends, enter data, and maintain KPI clarity.
Moreover, Excel makes the scorecard flexible, affordable, and easy to update. Therefore, businesses can use it to improve visibility, speed up decisions, and keep teams aligned with goals.
If you want a simple but effective way to monitor wholesale performance, this Excel KPI scorecard offers an excellent solution.
Frequently Asked Questions with Answers
What is a Wholesale KPI Scorecard in Excel?
A Wholesale KPI Scorecard in Excel is a structured workbook that helps businesses track key wholesale performance indicators such as sales, margins, fulfillment, delivery, and customer performance in one place.
Why should wholesale businesses use a KPI scorecard?
Wholesale businesses should use a KPI scorecard because it helps them monitor targets, spot performance issues quickly, improve reporting, and make better decisions based on clear data.
What are MTD and YTD in the scorecard?
MTD means Month-to-Date, and YTD means Year-to-Date. These views help users track short-term and long-term performance within the same workbook.
How many worksheets are included in this template?
This template includes 4 worksheets:
- Scorecard Sheet
- KPI Trend Sheet
- Input Data Sheet
- KPI Definition Sheet
What does the Scorecard Sheet do?
The Scorecard Sheet shows the main KPI summary. It allows users to select the month and view MTD or YTD performance while comparing actual values against targets.
What is the purpose of the KPI Trend Sheet?
The KPI Trend Sheet helps users analyze one selected KPI in detail. It shows KPI information and displays trend charts for Actual, Target, and Previous Year values.
Can I customize the KPIs in this Excel template?
Yes, you can customize the KPI names, groups, formulas, definitions, units, and target values based on your wholesale business needs.
Is this template suitable for small businesses?
Yes, this template works well for small and medium wholesale businesses because Excel is easy to use, affordable, and flexible.
What type of KPIs can I track in this scorecard?
You can track many wholesale KPIs such as sales revenue, gross margin, average order value, fulfillment rate, return rate, inventory turnover, and customer retention rate.
How often should I update the Wholesale KPI Scorecard?
You should update the scorecard regularly based on your reporting cycle. Many businesses update it weekly or monthly so they can keep performance analysis current.
Visit our YouTube channel to learn step-by-step video tutorials
Watch the step-by-step video tutorial:
Click to buy Wholesale KPI Scorecard in Excel