In today’s competitive automotive industry, manufacturers must track production efficiency, quality, costs, and operational performance in real time. However, many organizations still rely on scattered spreadsheets and disconnected reports. As a result, decision-making becomes slow, inaccurate, and inefficient.API Development Dashboard in Power BI
Therefore, companies now adopt advanced analytics tools like Power BI to centralize data and gain actionable insights. That’s exactly where the API Development Dashboard in Power BI becomes a powerful solution. 🚀
This dashboard helps manufacturers monitor KPIs, analyze production trends, control costs, and improve operational efficiency—all in one place.API Development Dashboard in Power BI
In this detailed guide, you will learn everything about this dashboard, including its features, structure, benefits, best practices, and frequently asked questions.API Development Dashboard in Power BI
Click to buy API Development Dashboard in Power BI
What is an API Development Dashboard in Power BI?
An API Development Dashboard in Power BI is an interactive reporting tool designed to track and analyze manufacturing performance using real-time data.
It helps you monitor:
- Production output and efficiency
- Quality performance and defect rates
- Cost analysis and resource utilization
- Department-wise and team-wise performance
- Monthly trends and KPI comparisons
Instead of managing multiple reports, you can centralize all your manufacturing data into a single dashboard. As a result, you gain better visibility, faster insights, and improved decision-making.
Why Do Automotive Manufacturers Need a Power BI Dashboard?
Manufacturing operations generate large volumes of data every day. However, without proper visualization, this data becomes difficult to use.
Here’s why this dashboard is essential:
- It simplifies complex data into easy-to-read visuals
- Itenables faster decision-making
- It identifies inefficiencies and bottlenecks
- It helps control costs and improve profitability
- It provides real-time performance monitoring
Moreover, it allows managers, engineers, and executives to make informed decisions based on accurate data.
Key Features of Automotive Parts Manufacturing Dashboard in Power BI
This dashboard includes 5 powerful pages, each designed to provide deep insights into manufacturing operations.
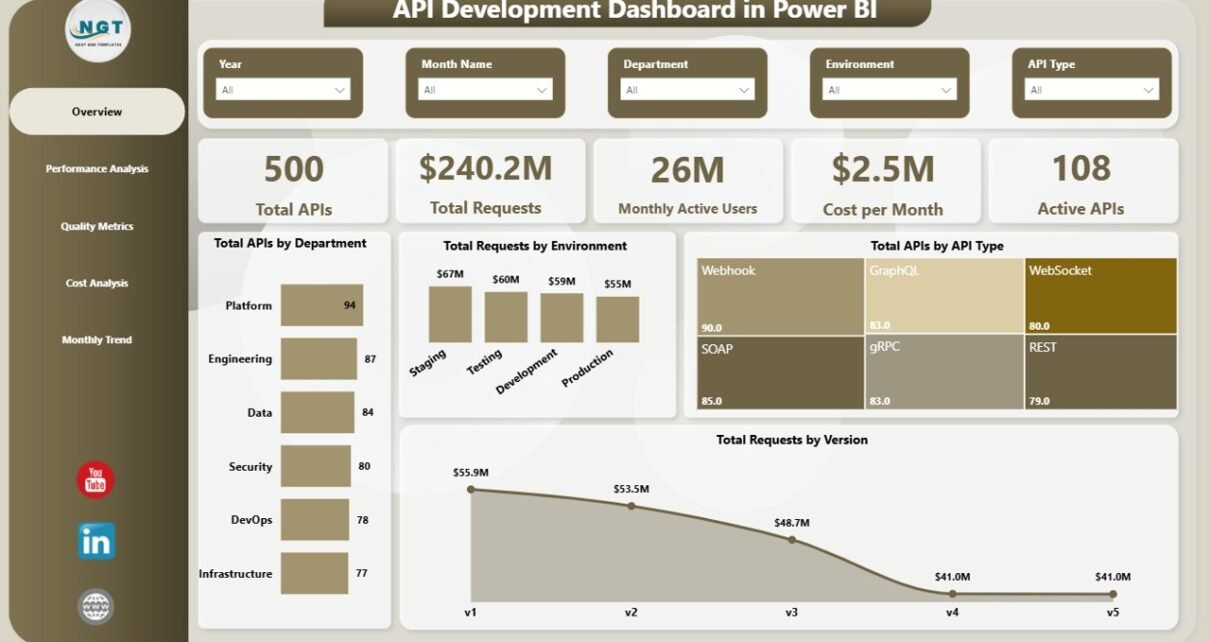
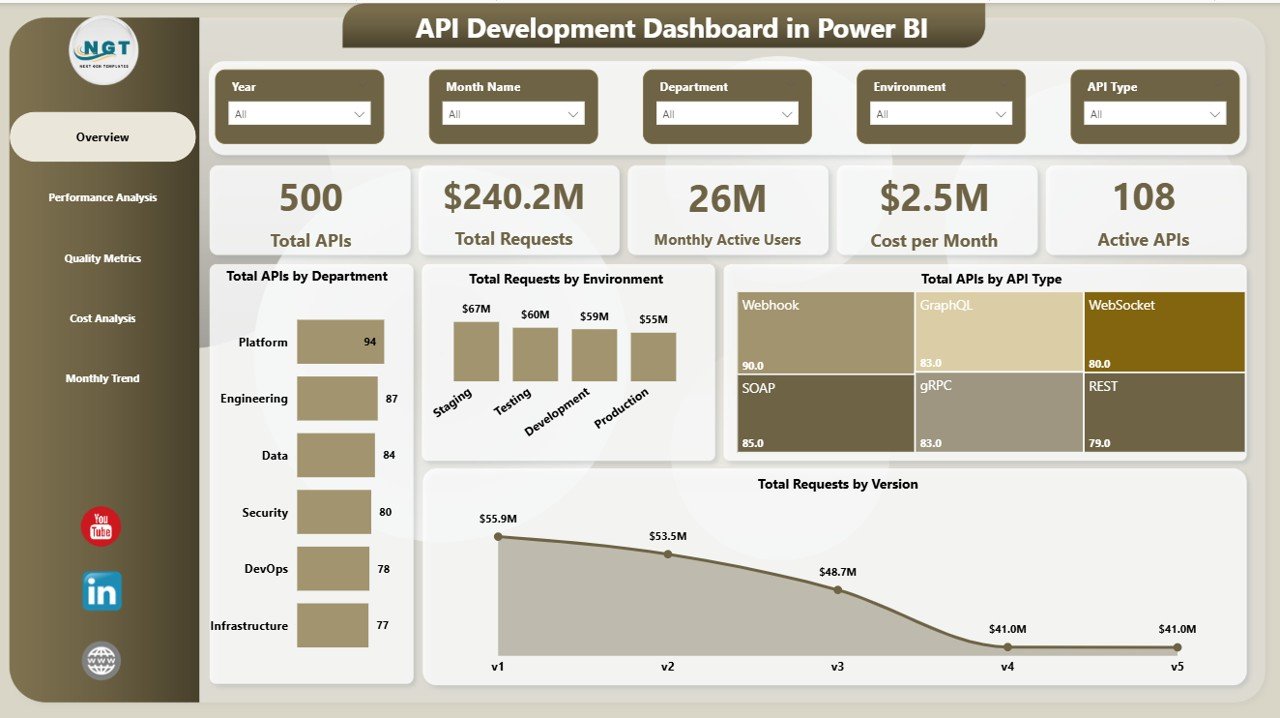
Overview Page – Quick Snapshot of Performance
The Overview Page acts as the main control panel of the dashboard.
KPI Cards:
- Total APIs (Production Units / Components)
- Total Requests (Production Volume)
- Monthly Active Users (Operational Activity)
- Cost per Month
- Active APIs (Active Production Lines)
Charts:
- Total APIs by Department
- Total Requests by Environment
- Total APIs by API Type
- Total Requests by Version
Benefits:
- Get a quick summary of key performance indicators
- Monitor overall production health instantly
- Identify high-performing departments
Click to buy Automotive Parts Manufacturing Dashboard in Power BI
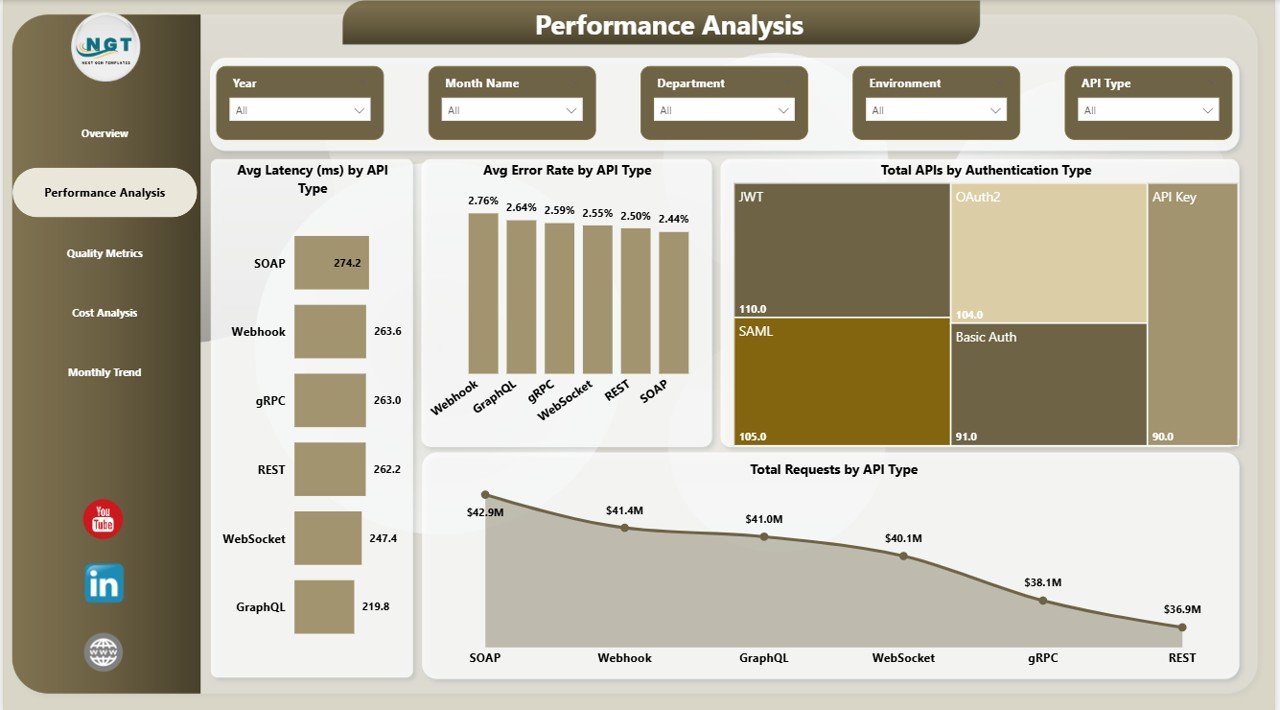
Performance Analysis – How Efficient is Your Production?
The Performance Analysis Page focuses on operational efficiency.
Charts:
- Average Latency (ms) by API Type (Production Cycle Time)
- Average Error Rate by API Type (Defect Rate)
- Total APIs by Authentication Type (Process Type)
- Total Requests by API Type
Insights You Get:
- Identify delays in production processes
- Monitor defect rates across production types
- Analyze performance differences between systems
Click to buy Automotive Parts Manufacturing Dashboard in Power BI
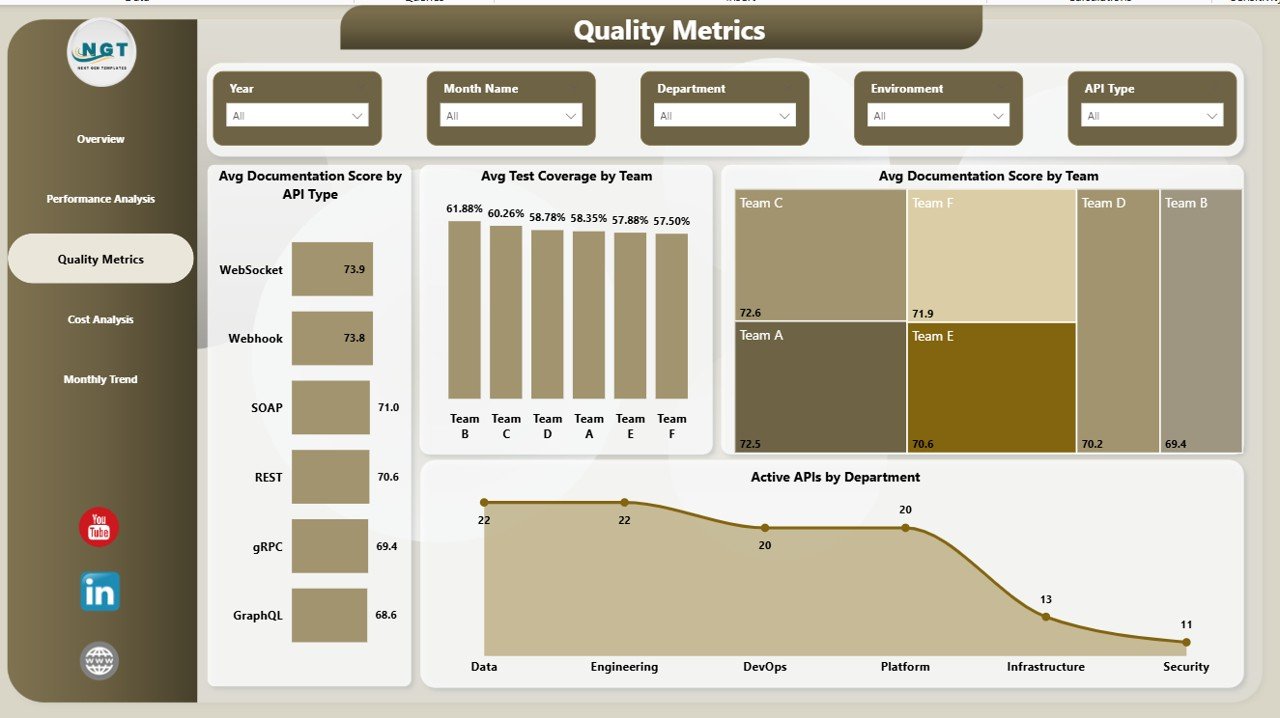
Quality Metrics – Are You Maintaining High Standards?
Quality plays a critical role in automotive manufacturing.
Charts:
- Average Documentation Score by API Type
- Average Test Coverage by Type
- Average Documentation Score by Team
- Active APIs by Department
Why It Matters:
- Ensure compliance with quality standards
- Track testing and documentation performance
- Improve product reliability
Click to buy Automotive Parts Manufacturing Dashboard in Power BI
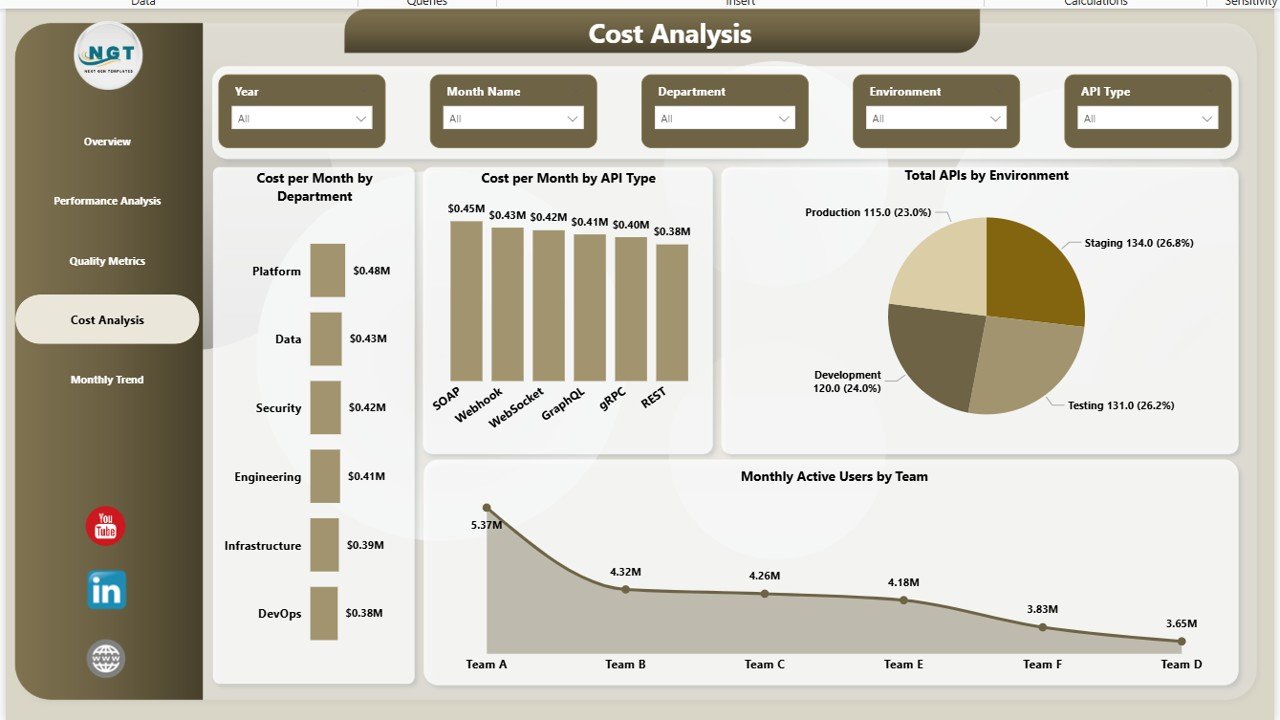
Cost Analysis – Where is Your Money Going?
The Cost Analysis Page helps you control and optimize manufacturing expenses.
Charts:
- Cost per Month by Department
- Cost per Month by Category
- Total APIs by Environment
- Monthly Active Users by Team
Key Benefits:
- Identify high-cost areas
- Optimize resource allocation
- Improve profitability
Click to buy Automotive Parts Manufacturing Dashboard in Power BI
Month Analysis – Track Trends Over Time
The Month Analysis Page provides time-based insights.
Charts:
- Cost per Month by Month Name
- Active APIs by Month Name
- Total APIs by Month Name
- Monthly Active Users by Month Name
Insights:
- Analyze seasonal trends
- Compare monthly performance
- Forecast future production

Click to buy Automotive Parts Manufacturing Dashboard in Power BI
How Does This Dashboard Improve Manufacturing Performance?
This dashboard transforms raw data into actionable insights.API Development Dashboard in Power BI
Here’s how it helps:
- Improves production efficiency
- Reduces downtime and delays
- Enhances product quality
- Optimizes costs
- Supports data-driven decisions
Moreover, it allowClick to buy Automotive Parts Manufacturing Dashboard in Power BIs teams to quickly identify issues and take corrective actions.
Advantages of API Development Dashboard in Power BI
Using this dashboard provides multiple advantages:
Centralized Data Management
- Store all manufacturing data in one place
- Avoid scattered spreadsheets
Real-Time Insights
- Monitor performance instantly
- React quickly to issues
Better Decision-Making
- Use data-driven strategies
- Reduce guesswork
Improved Productivity
- Identify inefficiencies
- Optimize workflows
Cost ack expenses accurately
- Reduce unnecessary spending
Enhanced Quality Control
- Monitor defect rates
- Improve product reliability
Opportunities for Improvement in This Dashboard
Although this dashboard is powerful, you can still improve it further:
Add Predictive Analytics
- Use forecasting models
- Predict demand and production
Integrate IoT Data
- Connect machine sensors
- Track real-time equipment performance
Enable Drill-Through Features
- Analyze data at deeper levels
- Improve root cause analysis
Automate Data Refresh
- Ensure real-time updates
- Reduce manual effort
Best Practices for the Automotive Parts Manufacturing Dashboard in Power BI
To get the best results, follow these best practices:
Use Clean and Structured Data
- Maintain consistent formats
- Remove duplicate entries
Define Clear KPIs
- Focus on measurable metrics
- Align KPIs with business goals
Use Interactive Filters (Slicers)
- Enable easy navigation
- Allow users to explore data
Keep the Dashboard Simple
- Avoid clutter
- Use clear visuals
Update Data Regularly
- Ensure accurate insights
- Maintain data freshness
Use Conditional Formatting
- Highlight key trends
- Make insights more visible
Who Can Benefit from This Dashboard?
This dashboard is useful for:
- Manufacturing Managers
- Production Engineers
- Quality Control Teams
- Operations Managers
- Business Analysts
- Automotive Industry Executives
Moreover, small and large manufacturers can both use it to improve performance.
How to Use the Automotive Dashboard Effectively?
Follow these steps:
- Import your manufacturing data into Power BI
- Connect data sources (ERP, Excel, IoT systems)
- Use slicers to filter data
- Analyze KPIs and trends
- Identify issues and take action
As a result, you will improve efficiency and decision-making.
Future of Automotive Manufacturing Dashboards
The future of dashboards looks exciting.
Trends to Watch:
- AI-powered analytics
- Predictive maintenance
- Real-time IoT integration
- Cloud-based reporting
Therefore, companies that adopt these technologies will gain a competitive advantage.
Conclusion
The API Development Dashboard in Power BIis a powerful tool that transforms raw data into meaningful insights. It helps manufacturers monitor performance, control costs, improve quality, and make better decisions.
Moreover, it simplifies complex data and provides a clear view of operations. As a result, organizations can increase efficiency, reduce waste, and boost profitability.API Development Dashboard in Power BI
If you want to take your manufacturing operations to the next level, this dashboard is a must-have solution. 🚀
Frequently Asked Questions (FAQs)
- What is a manufacturing dashboard in Power BI?
A manufacturing dashboard in Power BI is a visual tool that helps track production, quality, and cost-related KPIs in real time.
- How does this dashboard improve efficiency?
It identifies bottlenecks, tracks performance, and provides insights for faster decision-making.
- Can I customize this dashboard?
Yes, you can customize KPIs, charts, and data sources based on your business needs.
- Is Power BI suitable for manufacturing analytics?
Yes, Power BI is highly effective for manufacturing analytics due to its visualization and real-time capabilities.
- What data is required for this dashboard?
You need production data, cost data, quality metrics, and operational KPIs.
- Can small manufacturers use this dashboard?
Yes, both small and large manufacturers can benefit from it.
- How often should I update the dashboard?
You should update it regularly or use automated refresh for real-time insights.
Visit our YouTube channel to learn step-by-step video tutorials
Watch the step-by-step video tutorial:
Click to buy Automotive Parts Manufacturing Dashboard in Power BI