In today’s fast-growing beauty industry, salon owners must track performance, manage costs, and understand customer trends quickly. However, many salons still rely on scattered spreadsheets and manual reports. As a result, they struggle to make timely decisions.
That’s exactly where the Beauty Salons Dashboard in Power BI becomes a game-changing solution. 🚀
This powerful and ready-to-use dashboard helps you monitor revenue, control costs, analyze performance, and improve profitability—all in one place.
In this complete guide, you will learn everything about this dashboard, including its features, structure, advantages, best practices, and FAQs.
Click to Purchases Beauty Salons Dashboard in Power BI
🤔 What is a Beauty Salons Dashboard in Power BI?
A Beauty Salons Dashboard in Power BI is an interactive data visualization tool designed to track and analyze salon operations.
Instead of managing multiple Excel sheets, you can centralize all your salon data into one smart dashboard. Therefore, you gain better visibility and faster insights.
With this dashboard, you can easily monitor:
-
Revenue and profit margins
-
Product and operating costs
-
Appointment trends
-
Branch performance
-
Referral sources
-
Monthly business growth
As a result, you can make smarter and faster business decisions.
💡 Why Do Beauty Salons Need a Dashboard?
Running a salon involves many moving parts. For example, you must manage staff, services, appointments, inventory, and customer satisfaction.
However, when data stays scattered, problems arise:
-
You cannot track real-time performance
-
You miss profit opportunities
-
You struggle to control costs
-
You delay important decisions
Therefore, a Power BI dashboard solves these problems by providing real-time insights and centralized reporting.
📊 Key Features of Beauty Salons Dashboard in Power BI
This dashboard comes with 5 powerful and interactive pages. Each page focuses on a specific business area.
Click to Purchases Beauty Salons Dashboard in Power BI
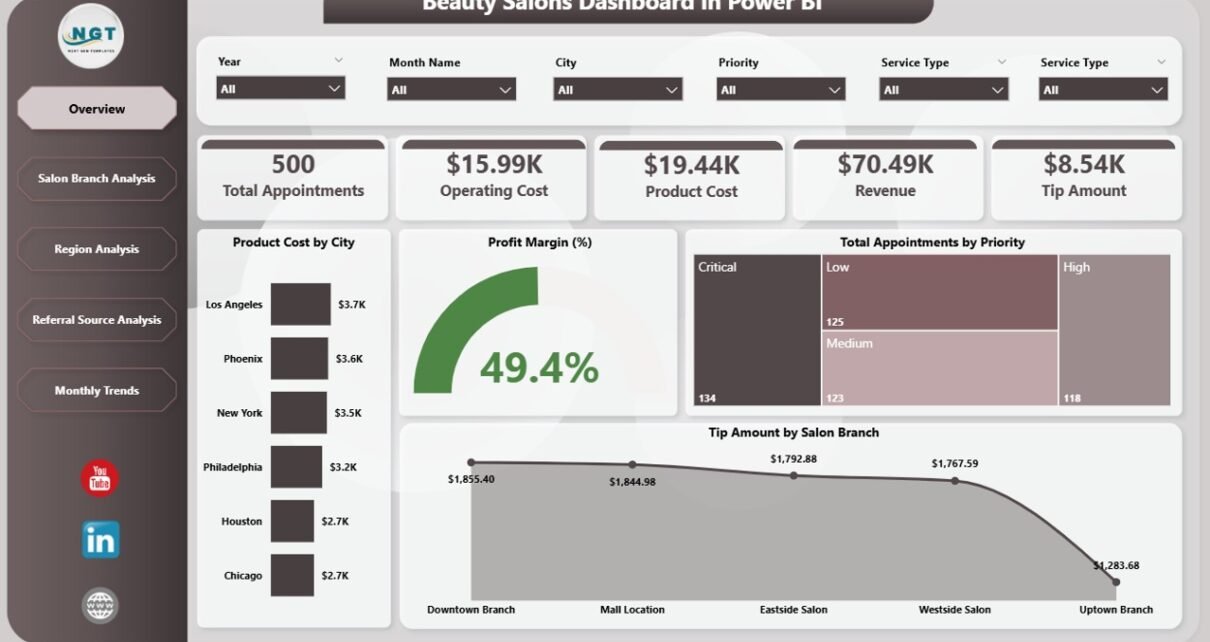
🏠 1. Overview Page – Get a Complete Business Snapshot
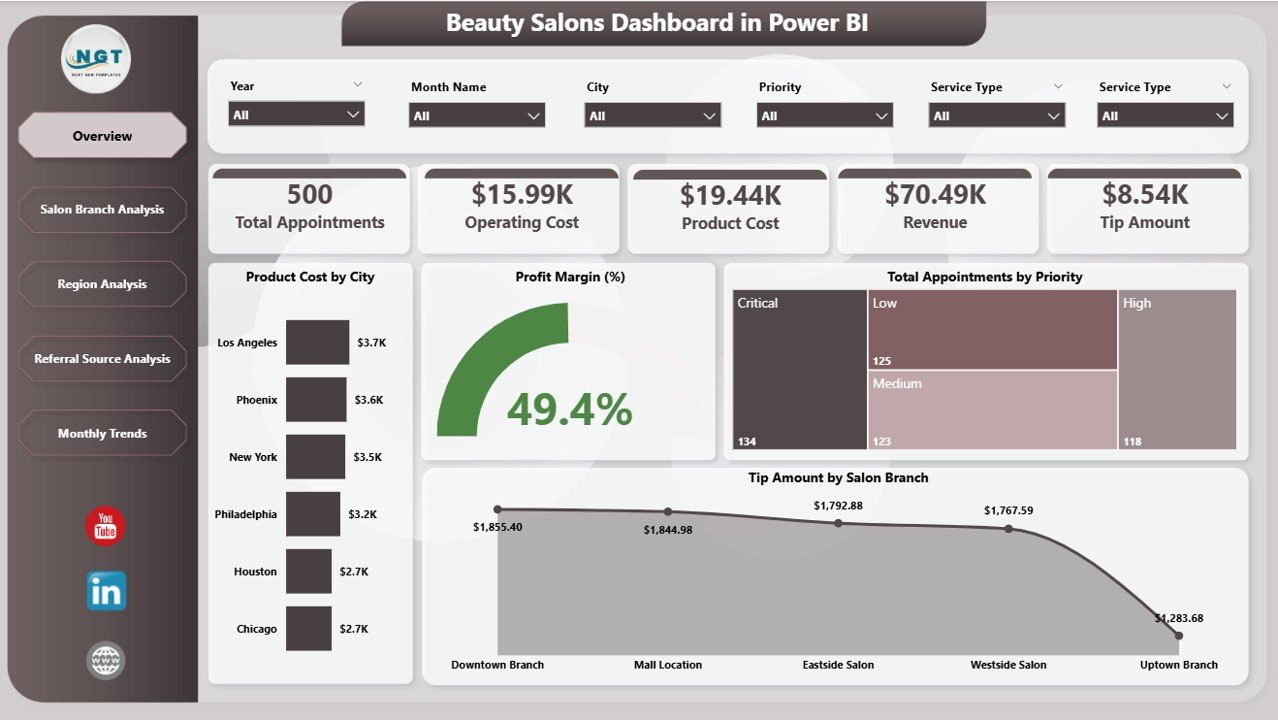
The Overview Page acts as the main dashboard where you can quickly understand overall performance.
Key Highlights:
-
KPI Cards:
-
Total Appointments
-
Product Cost
-
Profit Margin %
-
Tip Amount
-
Revenue Overview
-
Charts Included:
-
Product Cost by City
-
Profit Margin % by City
-
Total Appointments by Priority
-
Tip Amount by Salon Branch
👉 Therefore, this page helps you monitor your salon at a glance.
🏢 2. Salon Branch Analysis – Which Branch Performs Best?
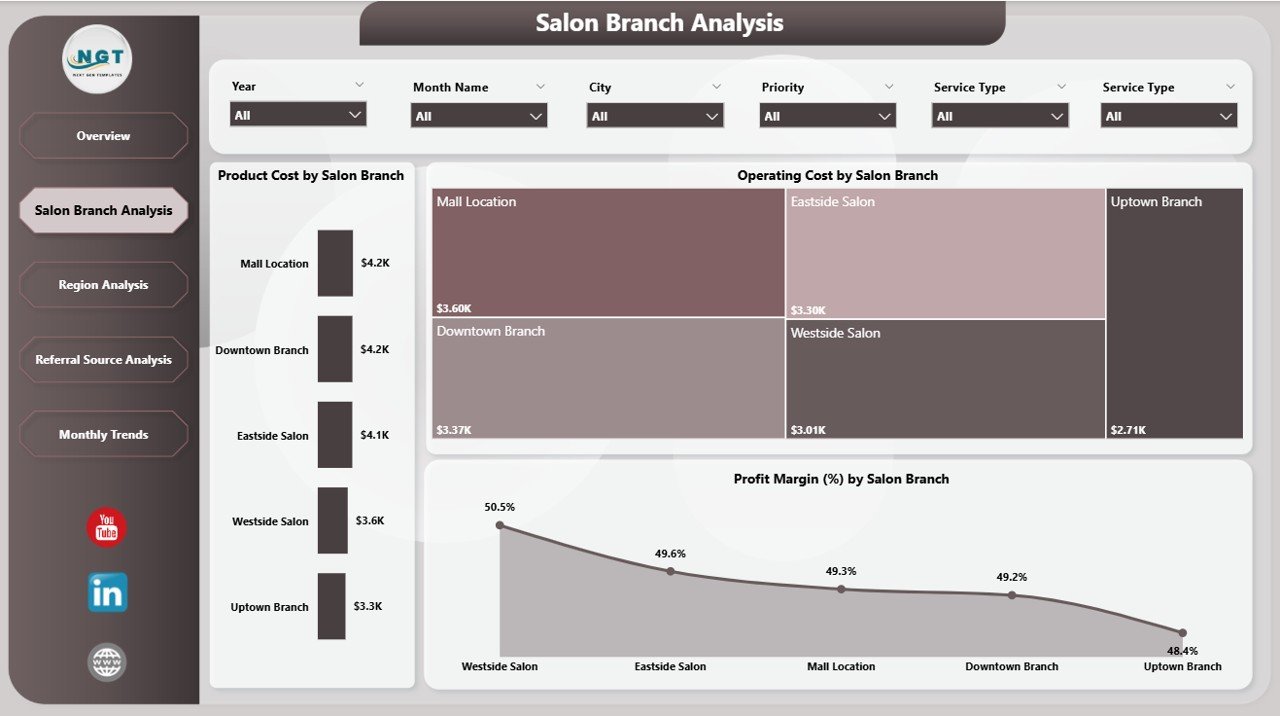
This page helps you compare performance across different salon branches.
Charts Included:
-
Product Cost by Salon Branch
-
Profit Margin % by Salon Branch
-
Operating Cost by Salon Branch
👉 As a result, you can identify top-performing and underperforming branches easily.
🌍 3. Region Analysis – Understand Regional Trends
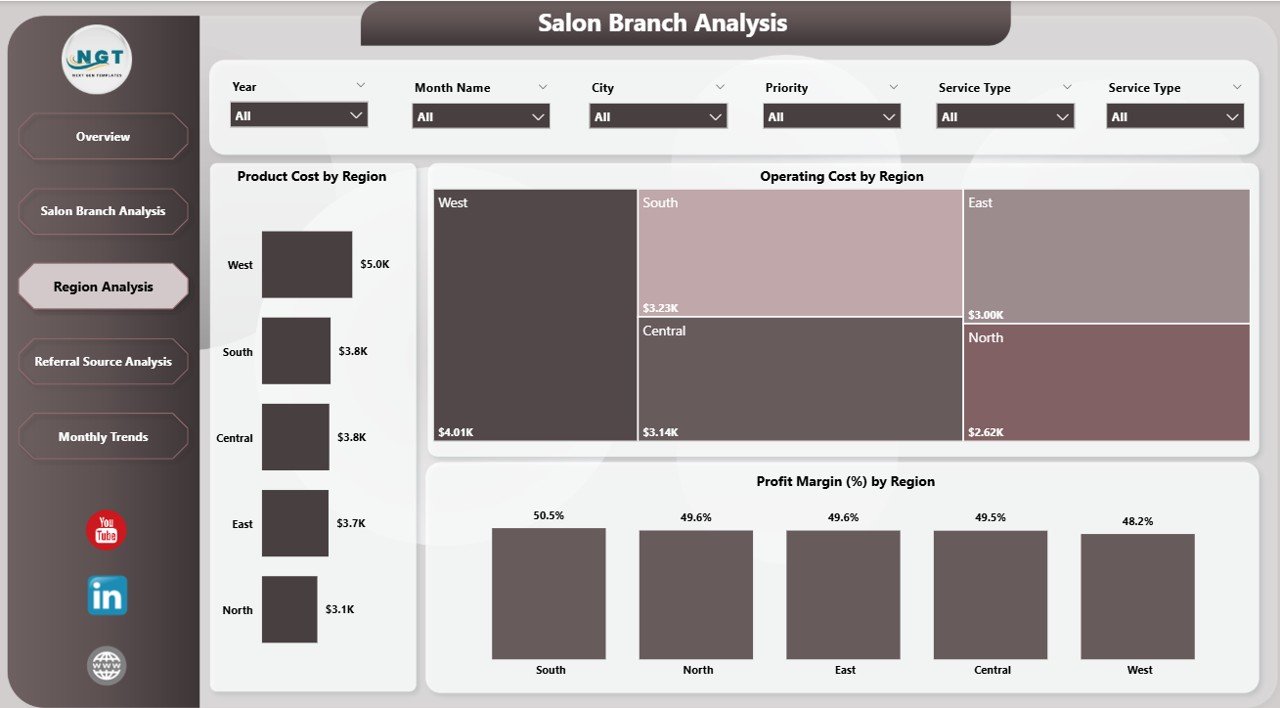
The Region Analysis Page provides insights based on geographic locations.
Charts Included:
-
Product Cost by Region
-
Profit Margin % by Region
-
Operating Cost by Region
👉 Therefore, you can optimize operations based on regional performance.
Click to Purchases Beauty Salons Dashboard in Power BI
📣 4. Referral Source Analysis – Where Are Your Clients Coming From?
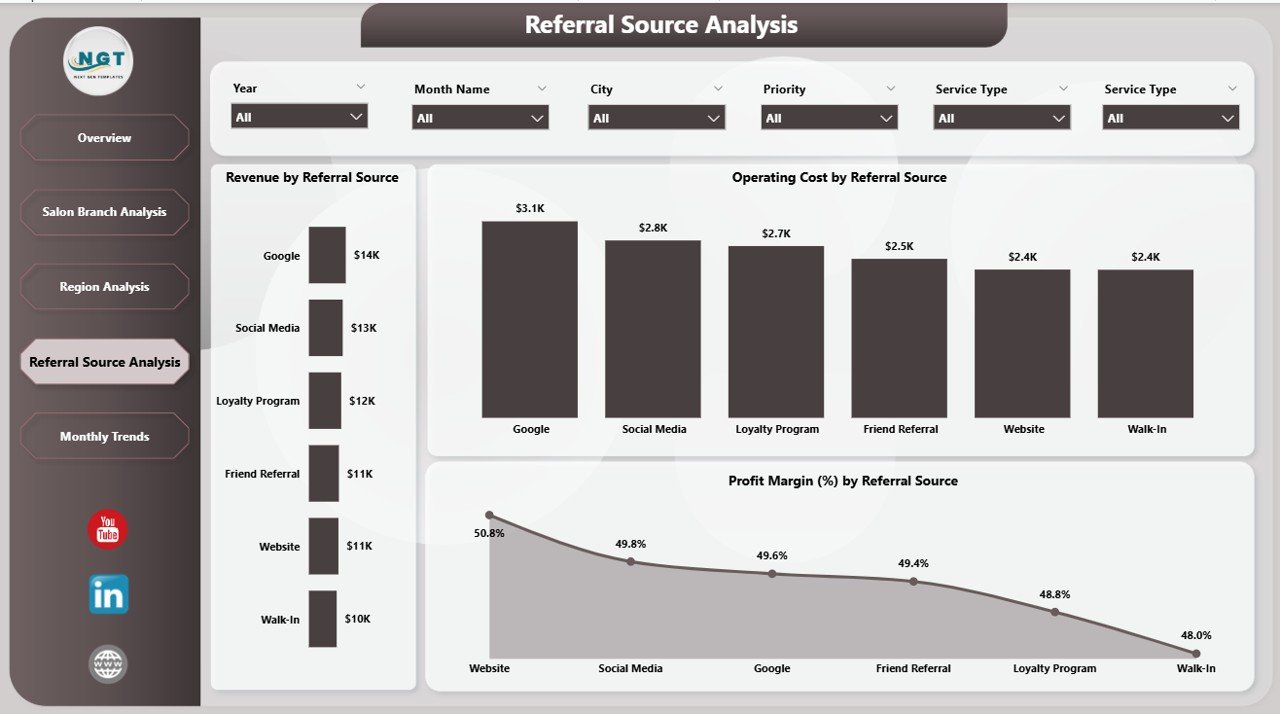
This page focuses on customer acquisition and marketing performance.
Charts Included:
-
Revenue by Referral Source
-
Operating Cost by Referral Source
-
Profit Margin % by Referral Source
👉 As a result, you can invest more in high-performing marketing channels.
📅 5. Month Analysis – Track Monthly Growth
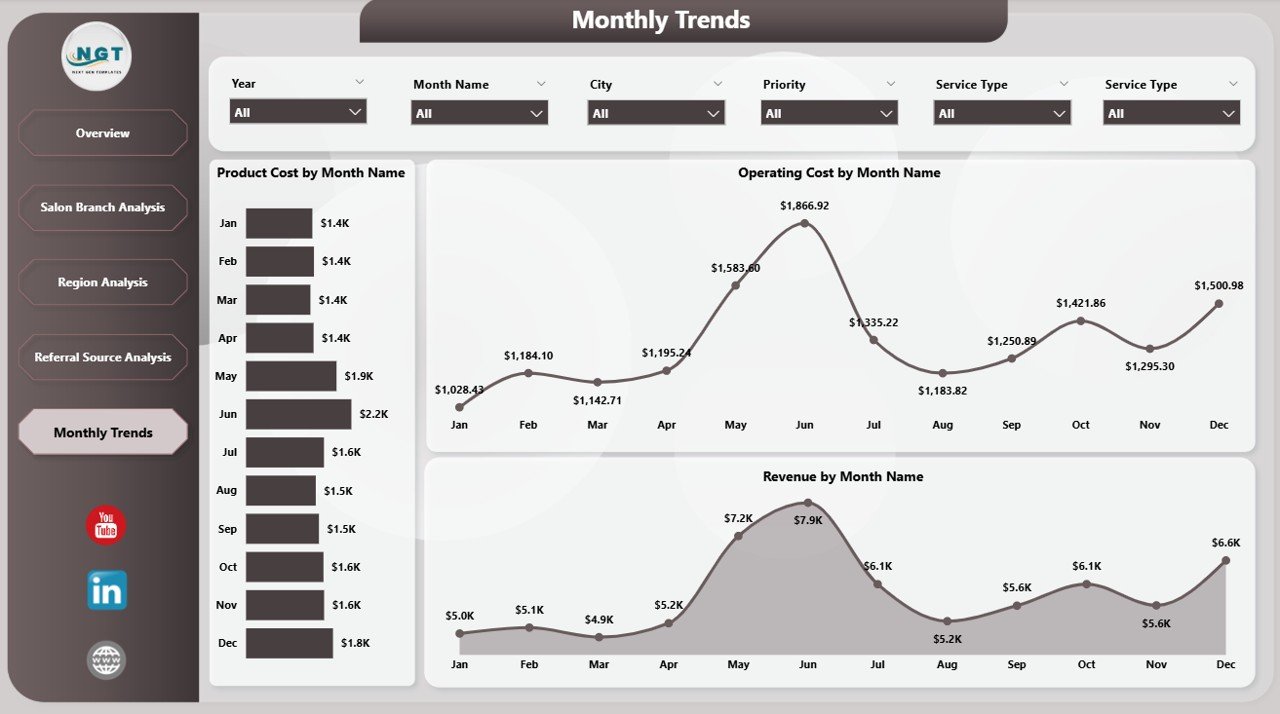
This page helps you analyze trends over time.
Charts Included:
-
Revenue by Month
-
Operating Cost by Month
-
Product Cost by Month
👉 Therefore, you can identify seasonal trends and growth patterns.
🚀 How Does This Dashboard Improve Salon Performance?
This dashboard does not just show data—it transforms your decision-making process.
Here’s how:
-
It converts raw data into visual insights
-
It highlights important trends instantly
-
It helps you compare performance across dimensions
-
It supports data-driven decision making
As a result, your salon becomes more efficient and profitable.
🎯 Advantages of Beauty Salons Dashboard in Power BI
Using this dashboard offers several powerful benefits:
✅ Better Decision Making
-
You get real-time insights
-
You identify trends quickly
-
You make faster decisions
✅ Improved Profitability
-
You track profit margins
-
You control costs effectively
-
You optimize pricing strategies
✅ Centralized Data Management
-
You avoid multiple spreadsheets
-
You keep everything in one place
-
You reduce errors
✅ Enhanced Customer Insights
-
You understand referral sources
-
You analyze appointment patterns
-
You improve customer experience
✅ Performance Tracking
-
You monitor branch performance
-
You compare regions easily
-
You track monthly growth
⚙️ Best Practices for the Beauty Salons Dashboard in Power BI
To get the maximum benefit from this dashboard, you should follow these best practices:
🔹 Keep Data Updated Regularly
-
Always refresh your data
-
Ensure accuracy
-
Avoid outdated reports
🔹 Use Filters and Slicers Effectively
-
Analyze specific branches
-
Focus on time periods
-
Drill down into details
🔹 Monitor KPIs Daily
-
Track revenue
-
Check profit margins
-
Review appointments
🔹 Focus on High-Performing Areas
-
Invest in profitable branches
-
Optimize marketing channels
-
Improve weak areas
🔹 Customize the Dashboard
-
Add new KPIs if needed
-
Modify charts
-
Align with business goals
📈 Who Can Use This Dashboard?
Click to Purchases Beauty Salons Dashboard in Power BI
This dashboard suits a wide range of users:
-
Salon Owners
-
Beauty Business Managers
-
Franchise Operators
-
Marketing Teams
-
Financial Analysts
Therefore, anyone involved in salon operations can benefit from it.
🔍 How to Use the Beauty Salons Dashboard?
Using this dashboard is simple and effective:
Step 1: Import Data
Add your salon data into Power BI.
Step 2: Refresh Dashboard
Update visuals with the latest data.
Step 3: Use Filters
Select branch, region, or time period.
Step 4: Analyze Insights
Review KPIs and charts.
Step 5: Take Action
Make decisions based on insights.
💼 Real-Life Use Cases of This Dashboard
✔️ Multi-Branch Salon Chains
Compare performance across branches and improve weak locations.
✔️ Independent Salon Owners
Track revenue, costs, and customer trends easily.
✔️ Marketing Teams
Analyze referral sources and optimize campaigns.
✔️ Financial Planning
Monitor profit margins and control expenses.
📊 What KPIs Can You Track in This Dashboard?
Here are some important KPIs included:
-
Total Appointments
-
Product Cost
-
Operating Cost
-
Profit Margin %
-
Revenue
-
Tip Amount
-
Monthly Growth
Therefore, you get a complete view of your business performance.
🧠 How Does Power BI Make This Dashboard Powerful?
Power BI enhances this dashboard with advanced features:
-
Interactive visuals
-
Real-time data updates
-
Drill-down capabilities
-
Custom filters and slicers
-
Easy sharing and collaboration
As a result, you get a smart and dynamic reporting system.
⚠️ Opportunities for Improvement in Beauty Salons Dashboard
Although this dashboard is powerful, you can improve it further:
🔸 Add Customer Retention Metrics
Track repeat customers and loyalty programs.
🔸 Include Staff Performance KPIs
Monitor employee productivity and service quality.
🔸 Integrate Booking Systems
Connect with online appointment systems.
🔸 Add Forecasting Features
Predict future trends and demand.
🏁 Conclusion
The Beauty Salons Dashboard in Power BI is a must-have tool for modern salon businesses.
Instead of relying on manual reports, you can use this dashboard to:
-
Track performance
-
Analyze trends
-
Control costs
-
Improve profitability
Therefore, if you want to grow your salon business and make smarter decisions, this dashboard is the perfect solution.
❓ Frequently Asked Questions (FAQs)
Click to Purchases Beauty Salons Dashboard in Power BI
1. What is a Beauty Salons Dashboard in Power BI?
It is an interactive tool that helps you track salon performance, costs, revenue, and customer trends.
2. Can beginners use this dashboard?
Yes, the dashboard is user-friendly and easy to use.
3. What data do I need for this dashboard?
You need data related to appointments, revenue, costs, branches, and referral sources.
4. How often should I update the dashboard?
You should update it daily or weekly for accurate insights.
5. Can I customize this dashboard?
Yes, you can modify KPIs, charts, and filters based on your business needs.
6. Is this dashboard suitable for multiple salon branches?
Yes, it is perfect for both single and multi-branch salon businesses.
7. Does this dashboard help increase profits?
Yes, it helps you track costs, optimize operations, and improve profitability.
Visit our YouTube channel to learn step-by-step video tutorials