Introduction
The Occupational Therapy KPI Dashboard is an essential tool designed to help healthcare professionals and management teams monitor and evaluate key performance indicators (KPIs) specific to occupational therapy services. This ready-to-use template streamlines data visualization and decision-making, ensuring effective tracking of therapy outcomes and operational efficiency.
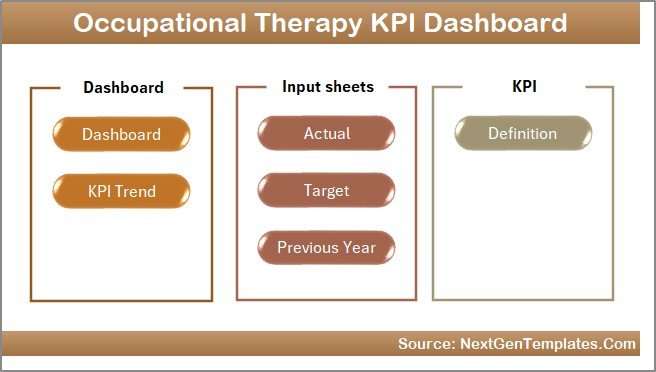 Home Page
Key Features of Occupational Therapy KPI Dashboard
- Seven well-structured worksheets for comprehensive KPI management
- Dynamic month selection to analyze monthly and year-to-date data
- Conditional formatting with up/down arrows for quick visual insights
- Interactive KPI trend visualization with customizable filters
- User-friendly input sheets to enter actual, target, and previous year data
- Clear KPI definitions with formulae and categorization for easy understanding
- Seamless navigation via an intuitive Home sheet with buttons linking to other sheets
Dashboard Pages Explanation
1. Home Sheet
This is the index and navigation sheet featuring six buttons to easily jump to each respective worksheet.
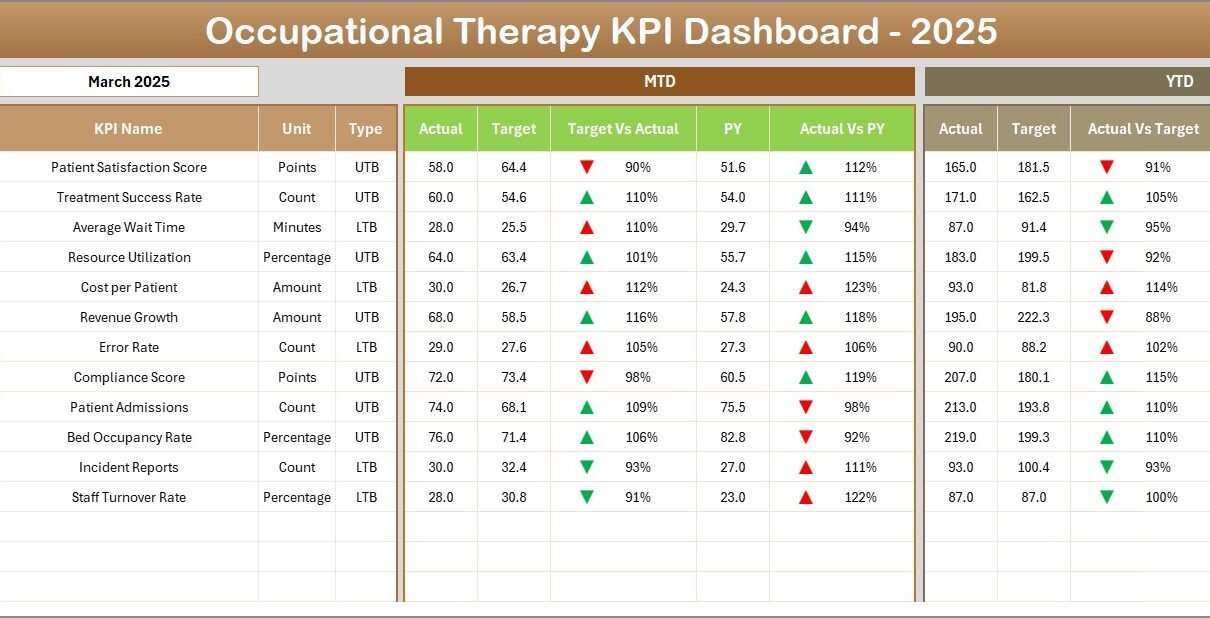
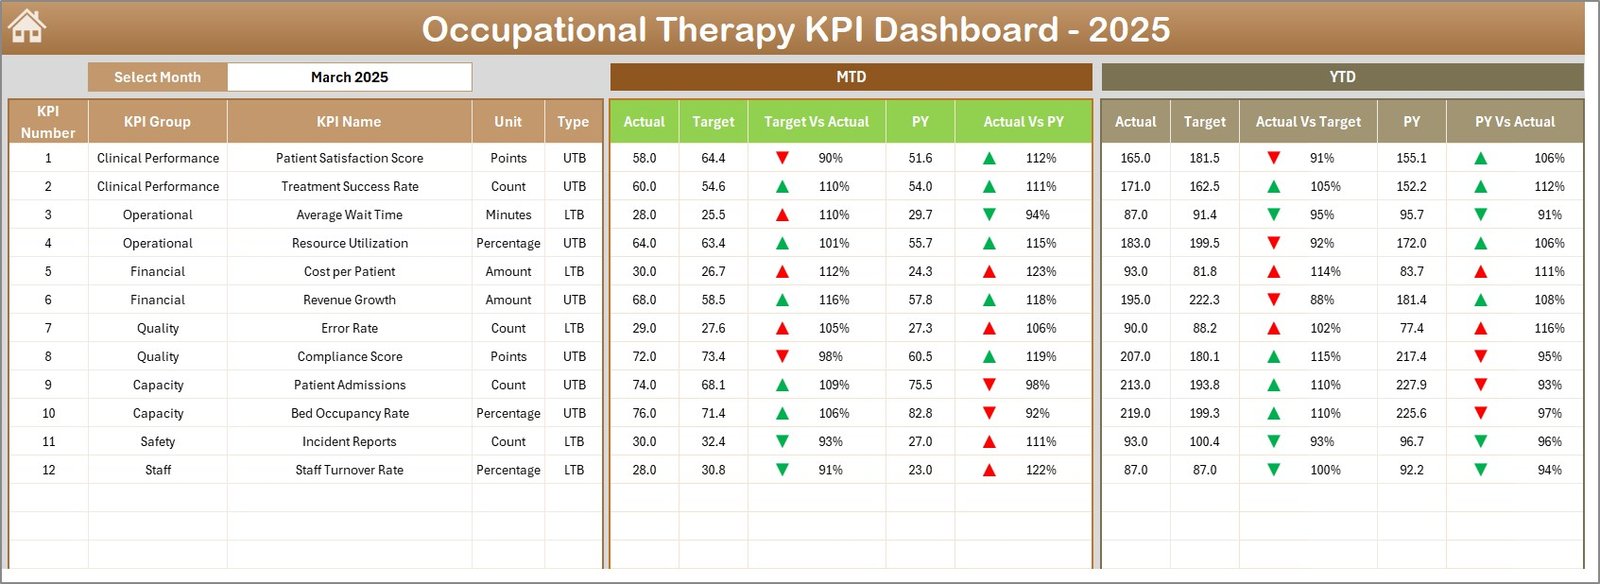
2. Dashboard Sheet Tab
The heart of the dashboard, where you select the month (cell D3) to update all KPI data dynamically. It displays:
- MTD (Month-to-Date) Actual, Target, and Previous Year data
- Comparisons between Target vs Actual and Previous Year vs Actual with conditional formatting arrows for up/down trends
- YTD (Year-to-Date) Actual, Target, and Previous Year data with similar comparative visuals
Occupational Therapy KPI Dashboard
Click to Buy Occupational Therapy KPI Dashboard in Excel
3. KPI Trend Sheet Tab
Select a KPI using the dropdown on cell C3 to view detailed information including:
- KPI Group and Unit
- Type of KPI – whether Lower The Better (LTB) or Upper The Better (UTB)
- KPI formula and definition
- MTD and YTD trend charts showing Actual, Target, and Previous Year values
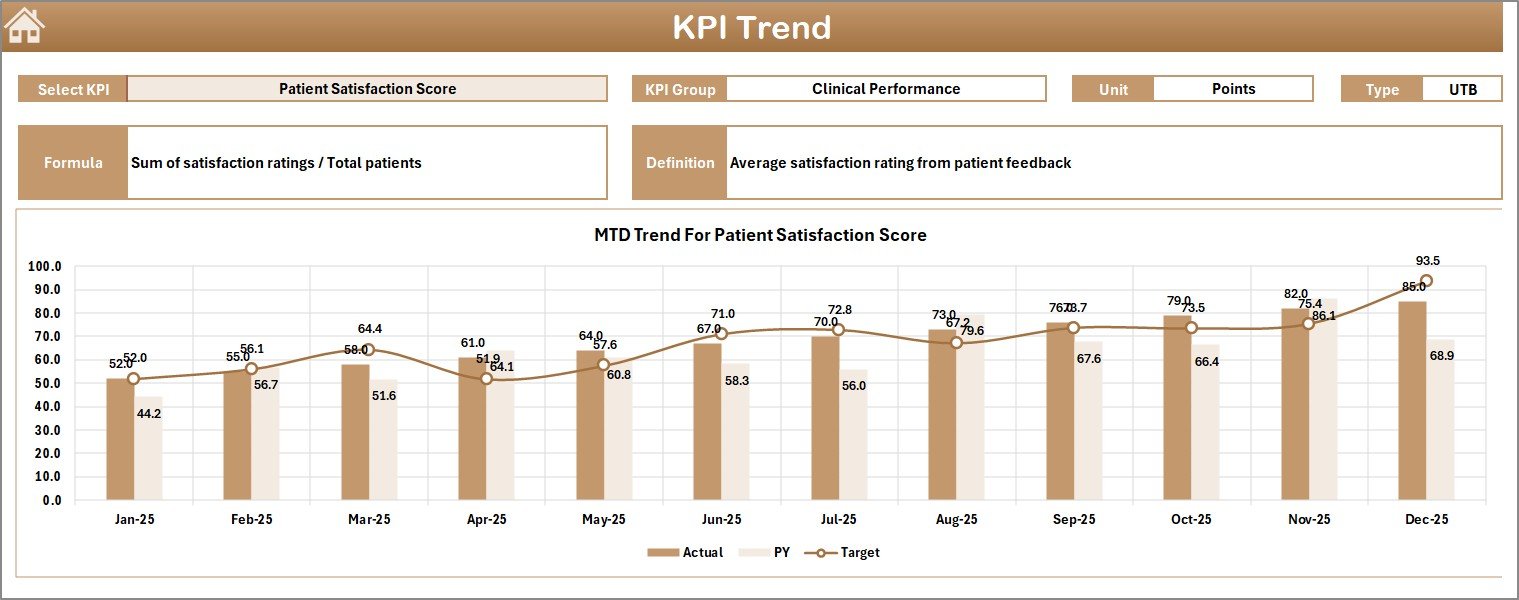
KPI Trend Sheet
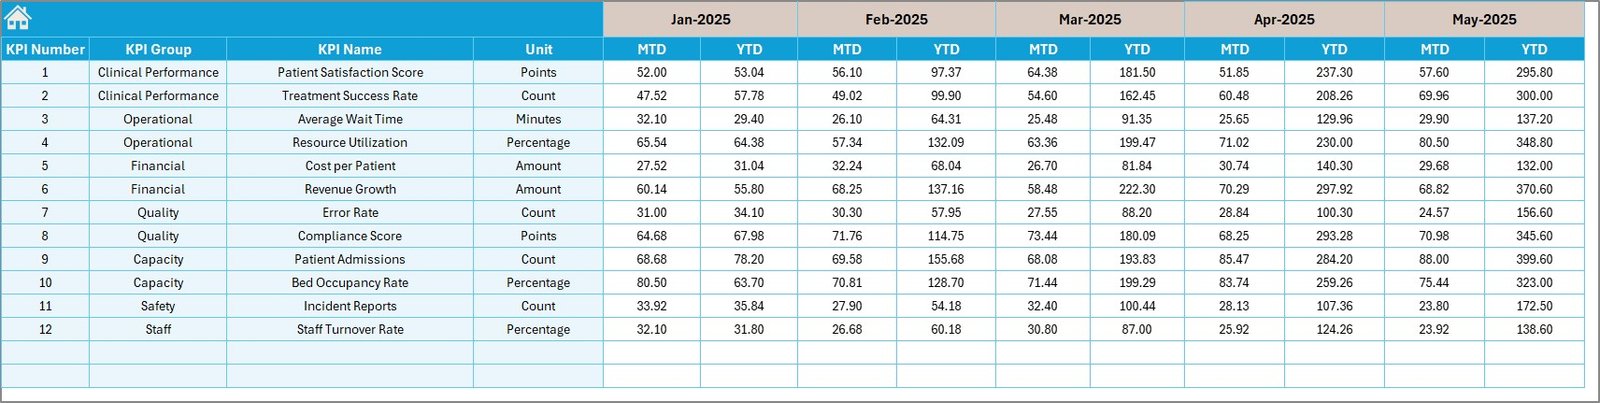
4. Actual Numbers Input Sheet
This sheet is used to enter the actual YTD and MTD numbers for each KPI for a selected month. Change the month by updating cell E1 with the first month of the year.
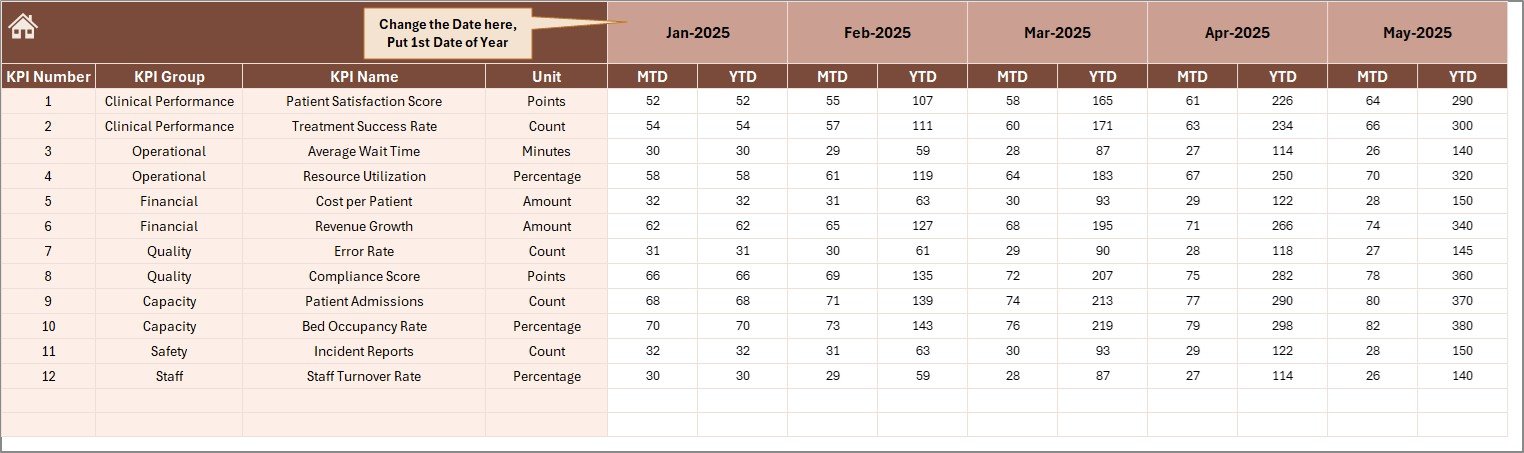
Actual Numbers Input sheet
Click to Buy Occupational Therapy KPI Dashboard in Excel
5. Target Number Input Sheet
In this worksheet, you input the target values for each KPI as MTD and YTD for each month, which the dashboard will compare against actuals.
Target Number Input sheet
6. Previous Year Number Sheet Tab
To measure growth and performance trends, enter the previous year’s data corresponding to the same KPIs and months in this sheet.
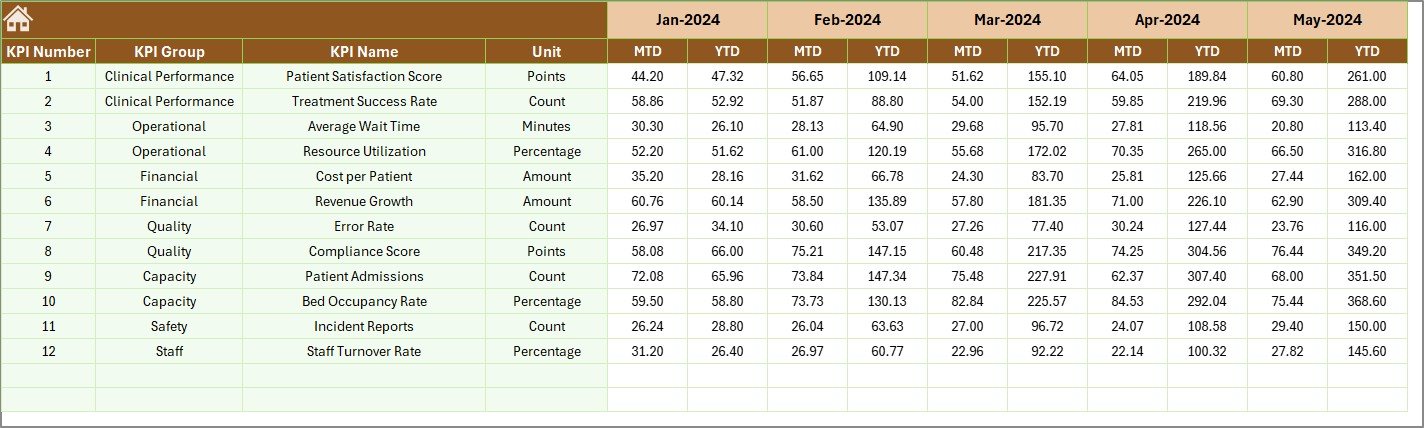
Previous Year Number Input sheet
Click to Buy Occupational Therapy KPI Dashboard in Excel
7. KPI Definition Sheet Tab
This sheet consolidates all KPI metadata including:
- KPI Name
- KPI Group
- Unit
- Formula
- Detailed KPI definition
- KPI Type (LTB or UTB)
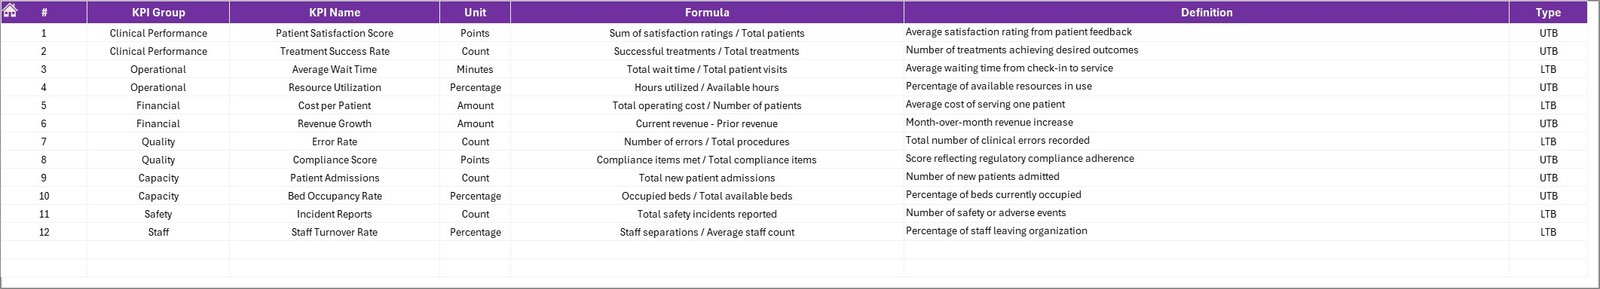
KPI Definition sheet
Advantages of Occupational Therapy KPI Dashboard
- Data-Driven Decision Making: Provides real-time insights on key performance metrics.
- Ease of Use: Interactive dropdowns and navigation buttons simplify report generation.
- Time Saving: Pre-built formulas and charts minimize manual calculations and formatting.
- Enhanced Accountability: Transparent tracking of targets and actuals encourages goal alignment.
- Performance Visualization: Clear visual cues (conditional formatting and charts) enhance understanding of trends.
Opportunities for Improvement
Click to Buy Occupational Therapy KPI Dashboard in Excel
- Automated Data Integration: Linking the dashboard with electronic health records (EHR) could automate data input.
- Mobile Compatibility: Optimizing for mobile devices can increase accessibility for therapists on the go.
- Expanded KPI Metrics: Incorporating patient satisfaction or therapy session attendance rates to broaden insights.
- Customization Features: Allowing users to add or remove KPIs dynamically based on changing priorities.
Best Practices
- Ensure monthly data inputs are accurate and up to date for reliable insights.
- Review KPI definitions regularly to ensure alignment with organizational goals.
- Leverage the conditional formatting visuals to quickly identify areas needing attention.
- Train staff on how to navigate and interpret the dashboard effectively.
- Use the dashboard in team meetings to foster transparency and collective accountability.
FAQs
Click to Buy Occupational Therapy KPI Dashboard in Excel
What KPIs are included in this Occupational Therapy KPI Dashboard?
The dashboard includes KPIs related to patient throughput, therapy outcomes, session effectiveness, and efficiency measurements tailored to occupational therapy.
Can I customize the KPIs in this template?
Yes, you can edit and add KPIs in the KPI Definition sheet, allowing customization based on your organization’s requirements.
How do I update the dashboard for a different month?
Use the dropdown in cell D3 on the Dashboard sheet to select the desired month. All data will update accordingly.
Is this dashboard compatible with Excel versions?
This template is designed for recent versions of Microsoft Excel including Excel 2016, 2019, and Microsoft 365.
Conclusion
Click to Buy Occupational Therapy KPI Dashboard in Excel
The Occupational Therapy KPI Dashboard is a powerful yet user-friendly tool that provides organizations with critical insights into therapy performance. By integrating actual, target, and historical data within intuitive visuals and summaries, this dashboard empowers healthcare professionals to make informed decisions to enhance patient care and operational efficiency.
For additional resources and Excel dashboard templates by industry leaders, visit Microsoft Excel Support.
Visit our YouTube channel to watch the demo.
Click to Buy Occupational Therapy KPI Dashboard in Excel