In today’s data-driven healthcare environment, hospitals and bariatric surgery centers must make fast and accurate decisions. However, many professionals still depend on scattered spreadsheets and manual reports. As a result, they often struggle to track patient outcomes, surgery performance, and financial metrics effectively.
So, how can you monitor everything—from patient BMI to surgery costs—in one place?
The answer is simple: Bariatric Surgery Centers Dashboard in Power BI
This powerful and interactive dashboard helps healthcare professionals analyze key performance indicators (KPIs), identify trends, and improve decision-making. In this detailed guide, you will learn everything about this dashboard, including its features, benefits, structure, best practices, and frequently asked questions.
Click to buy Bariatric Surgery Centers Dashboard in Power BI
What is a Bariatric Surgery Centers Dashboard in Power BI?
A Bariatric Surgery Centers Dashboard in Power BI is a data visualization tool designed to track and analyze surgery-related data in a centralized and interactive format.
Instead of switching between multiple reports, you can view all critical metrics in one place. Therefore, you can quickly understand performance, compare trends, and make data-driven decisions.
Moreover, this dashboard allows you to monitor:
- Patient BMI changes (pre and post-surgery)
- Surgery duration and efficiency
- Total treatment cost
- Patient satisfaction scores
- Insurance coverage and financial insights
Why Do Bariatric Surgery Centers Need a Dashboard?
Healthcare organizations generate a large amount of data every day. However, without proper tools, this data becomes difficult to manage.
That is why a Power BI dashboard becomes essential.
Key Challenges Without a Dashboard
- Data scattered across multiple systems
- Time-consuming manual analysis
- Lack of real-time insights
- Difficulty in tracking patient outcomes
- Poor decision-making due to incomplete data
How This Dashboard Solves These Problems
- Centralizes all data into one view
- Provides real-time insights
- Improves accuracy and efficiency
- Enhances patient care quality
- Supports strategic planning
What Are the Key Features of the Bariatric Surgery Dashboard?
This dashboard contains 5 powerful and interactive pages in Power BI. Each page focuses on a different aspect of analysis.
Let’s explore them in detail 👇
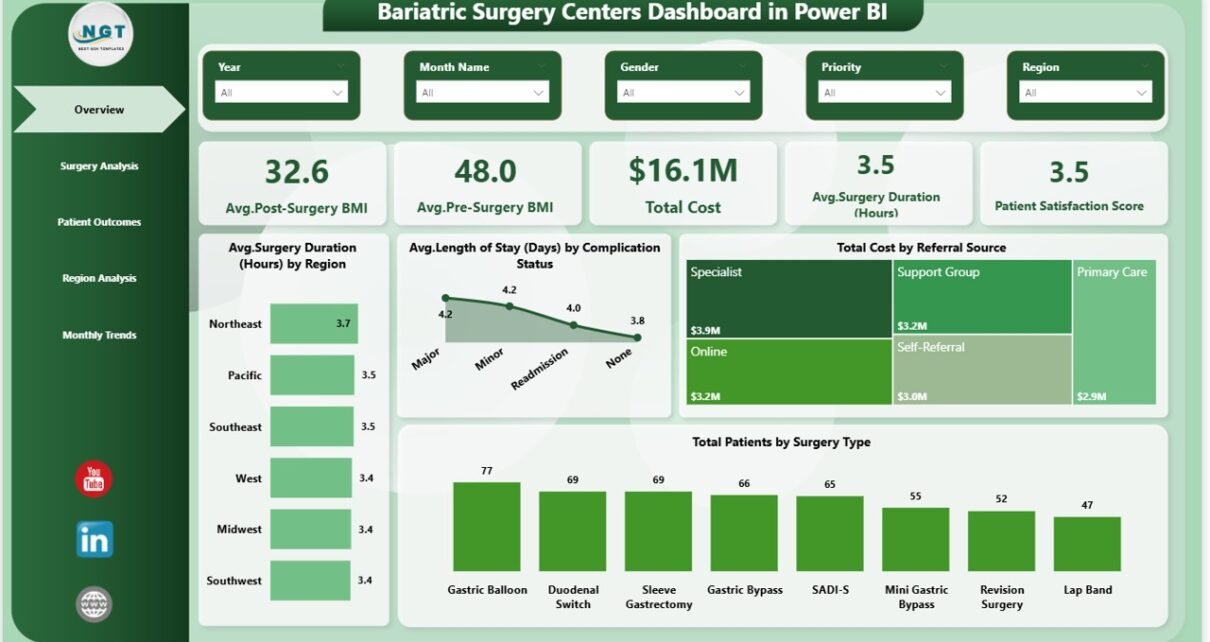
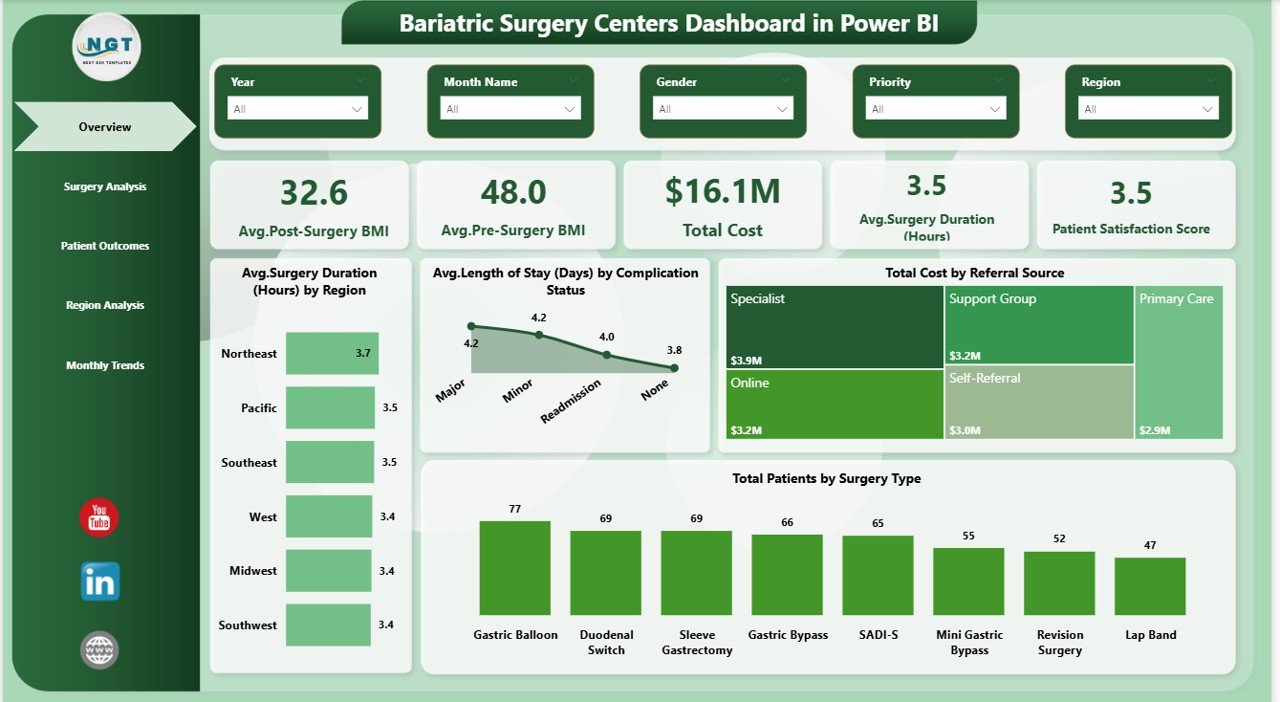
Overview Page – How Can You Get a Quick Snapshot?
The Overview Page acts as the main control panel of the dashboard. It provides a quick summary of all key performance indicators.
Key KPI Cards
- Avg. Post-Surgery BMI
- Avg. Pre-Surgery BMI
- Total Cost
- Avg. Surgery Duration (Hours)
- Patient Satisfaction Score
Charts Available
- Avg. Surgery Duration by Region
- Avg. Length of Stay by Complication Status
- Total Cost by Referral Source
- Total Patients by Surgery Type
Therefore, this page helps decision-makers quickly understand overall performance.
Click to buy Bariatric Surgery Centers Dashboard in Power BI
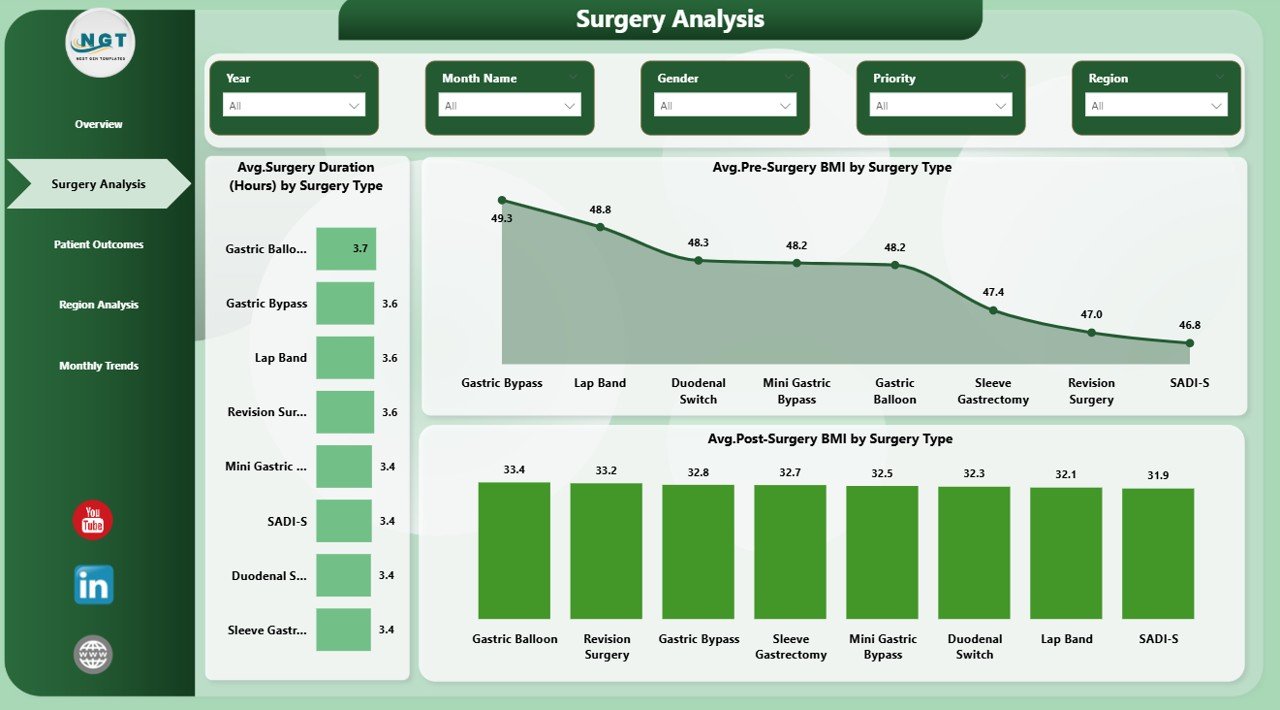
Surgery Analysis – How Can You Evaluate Surgical Performance?
The Surgery Analysis Page focuses on comparing different surgery types.
Charts Included
- Avg. Surgery Duration by Surgery Type
- Avg. Pre-Surgery BMI by Surgery Type
- Avg. Post-Surgery BMI by Surgery Type
As a result, you can identify which surgery type performs better and optimize processes accordingly.
Click to buy Bariatric Surgery Centers Dashboard in Power BI
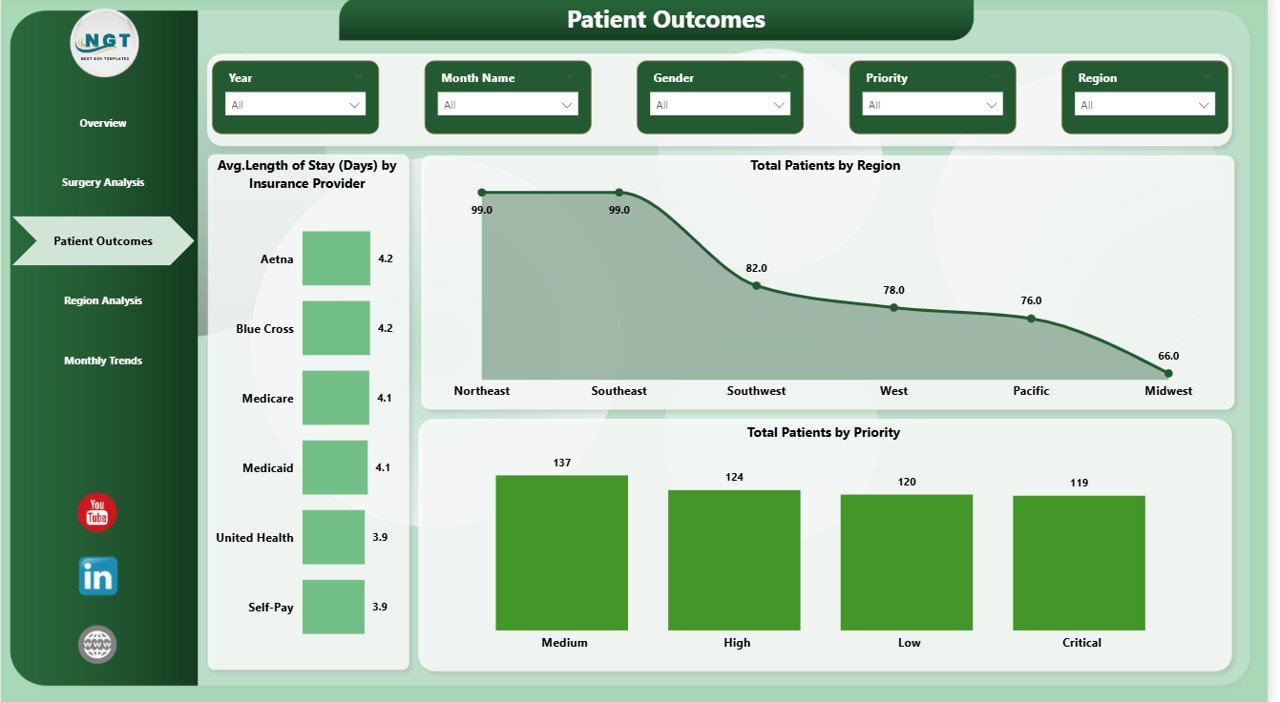
Patient Outcomes – How Can You Track Patient Results?
The Patient Outcomes Page helps you measure the effectiveness of treatments.
Charts Included
- Avg. Length of Stay by Insurance Provider
- Total Patients by Region
- Total Patients by Priority
This page allows healthcare providers to improve patient care and monitor recovery trends.
Click to buy Bariatric Surgery Centers Dashboard in Power BI
Region Analysis – How Can You Compare Regional Performance?
The Region Analysis Page provides insights into geographical performance.
Charts Included
- Avg. Length of Stay by Region
- Total Cost by Region
- Avg. Insurance Coverage % by Region
Therefore, you can easily identify high-performing and low-performing regions.
Click to buy Bariatric Surgery Centers Dashboard in Power BI
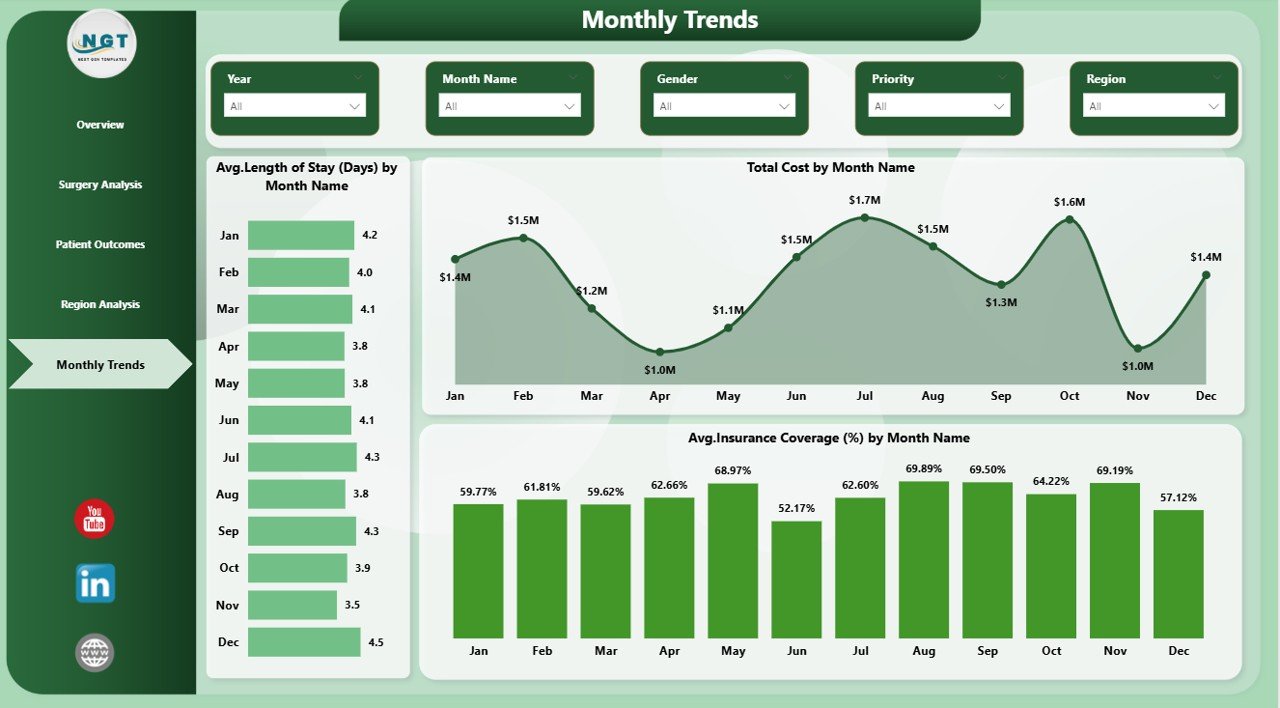
Monthly Trends – How Can You Analyze Time-Based Data?
The Monthly Trends Page focuses on performance over time.
Charts Included
- Avg. Length of Stay by Month
- Total Cost by Month
- Avg. Insurance Coverage % by Month
Consequently, you can track trends and forecast future performance.
Click to buy Bariatric Surgery Centers Dashboard in Power BI
What Makes Power BI the Best Tool for This Dashboard?
Power BI offers advanced features that make data analysis simple and effective.
Key Advantages of Power BI
- Real-time data updates
- Interactive visuals and slicers
- Easy integration with multiple data sources
- Mobile-friendly dashboards
- Fast performance and scalability
Advantages of Bariatric Surgery Centers Dashboard in Power BI
Now, let’s explore the major benefits of using this dashboard.
Improved Decision-Making
- Helps managers make data-driven decisions
- Provides clear and actionable insights
Better Data Visualization
- Converts complex data into easy-to-read visuals
- Improves understanding of KPIs
Time-Saving
- Eliminates manual reporting
- Automates calculations and analysis Enhanced Patient Care
- Tracks patient outcomes effectively
- Helps improve treatment quality
Cost Optimization
- Identifies cost trends and inefficiencies
- Supports better financial planning
How Does This Dashboard Improve Healthcare Performance?
This dashboard not only tracks data but also transforms it into meaningful insights.
Key Improvements
- Identifies performance gaps
- Enhances operational efficiency
- Improves patient satisfaction
- Supports long-term planning
Moreover, it allows healthcare providers to act quickly and confidently.
Best Practices for the Bariatric Surgery Centers Dashboard in Power BI
To get the best results, you should follow these best practices:
Keep Data Clean and Structured
- Ensure data accuracy
- Remove duplicates and errors
Use Meaningful KPIs
- Focus on relevant metrics
- Avoid unnecessary data
Leverage Slicers and Filters
- Allow users to customize views
- Improve interactivity
Update Data Regularly
- Maintain real-time accuracy
- Avoid outdated insights
Optimize Dashboard Design
- Use clear layouts
- Avoid cluttered visuals
How to Use the Bariatric Surgery Dashboard Effectively?
Using this dashboard is simple and user-friendly.
Step-by-Step Guide
- Import your dataset into Power BI
- Connect data to the dashboard
- Use slicers to filter information
- Analyze KPIs and trends
- Make informed decisions
As a result, you can save time and improve productivity.
Who Can Benefit from This Dashboard?
This dashboard serves multiple healthcare professionals:
Hospital Administrators
- Monitor overall performance
- Improve operational efficiency
Data Analysts
- Perform advanced data analysis
- Generate actionable insights
Financial Managers
- Track costs and budgets
- Optimize financial performance
Healthcare Providers
- Improve patient outcomes
- Enhance treatment strategies
Common Mistakes to Avoid While Using This Dashboard
Even though the dashboard is powerful, users often make mistakes.
Ignoring Data Accuracy
- Always validate your data
Overloading with Metrics
- Focus on key KPIs only
Not Updating Data
- Keep your dashboard current
Poor Visualization Choices
- Use simple and clear charts
How Can This Dashboard Drive Business Growth?
This dashboard plays a crucial role in healthcare business growth.
Key Growth Factors
- Better resource allocation
- Improved patient satisfaction
- Increased profitability
- Faster decision-making
Conclusion
The Bariatric Surgery Centers Dashboard in Power BI is a game-changing tool for healthcare professionals. It simplifies complex data, improves visibility, and enhances decision-making.
Moreover, it helps track patient outcomes, optimize costs, and improve overall performance.
Therefore, if you want to take your healthcare analytics to the next level, this dashboard is the perfect solution.
Frequently Asked Questions (FAQs)
- What is a Bariatric Surgery Dashboard?
It is a data visualization tool that helps track and analyze surgery-related KPIs in one place.
- Why should I use Power BI for this dashboard?
Because it provides interactive visuals, real-time data updates, and powerful analytics features.
- Can I customize this dashboard?
Yes, you can modify KPIs, charts, and filters based on your requirements.
- Is this dashboard suitable for small clinics?
Yes, it works for both small clinics and large hospitals.
- What data is required for this dashboard?
You need patient data, surgery details, cost information, and insurance data.
- How often should I update the dashboard?
You should update it regularly, preferably in real-time or daily.
Click to buy Bariatric Surgery Centers Dashboard in Power BI
Visit our YouTube channel to learn step-by-step video tutorials