Introduction
The Corporate Skill Hubs KPI Dashboard is a comprehensive, ready-to-use Excel template designed to help organizations effectively track and monitor key performance indicators (KPIs) related to skill development hubs. This dashboard offers a visually intuitive, data-driven way to analyze monthly and yearly trends, compare actuals against targets, and assess previous year performance-all in one place. Whether you are a manager, analyst, or team lead, this dashboard streamlines performance management and decision-making.
Key Features of Corporate Skill Hubs KPI Dashboard
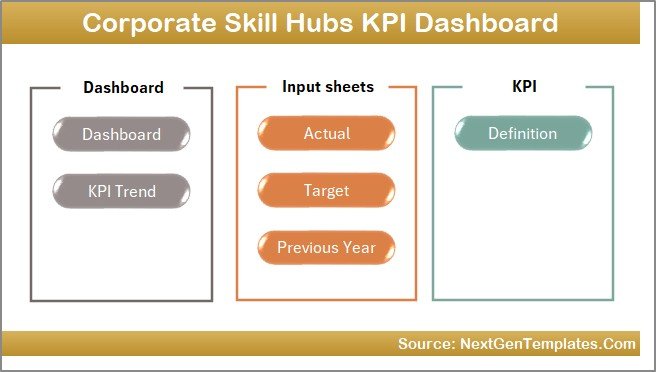
- Seven dedicated worksheets covering home navigation, dashboard summary, trend analysis, data input, and KPI definitions.
- Dynamic month selection to instantly update all related figures and charts.
- Comparative analysis between Month-To-Date (MTD), Year-To-Date (YTD), targets, and previous year data with conditional formatting showing KPIs trends using up/down arrows.
- Detailed KPI trend charts for quick visualization of actual, target, and previous year values.
- Flexible input sheets to enter actuals, targets, and previous year numbers separately to maintain data integrity.
- KPI definition tab including KPI name, group, unit, formula, and type (Lower The Better – LTB or Upper The Better – UTB) for enhanced understanding.
Dashboard Pages Explanation
1. Home Sheet
This is the index page featuring six intuitive buttons that quickly navigate users to the corresponding sheets within the workbook.
 Home Page
Click to Buy Corporate Skill Hubs KPI Dashboard in Excel
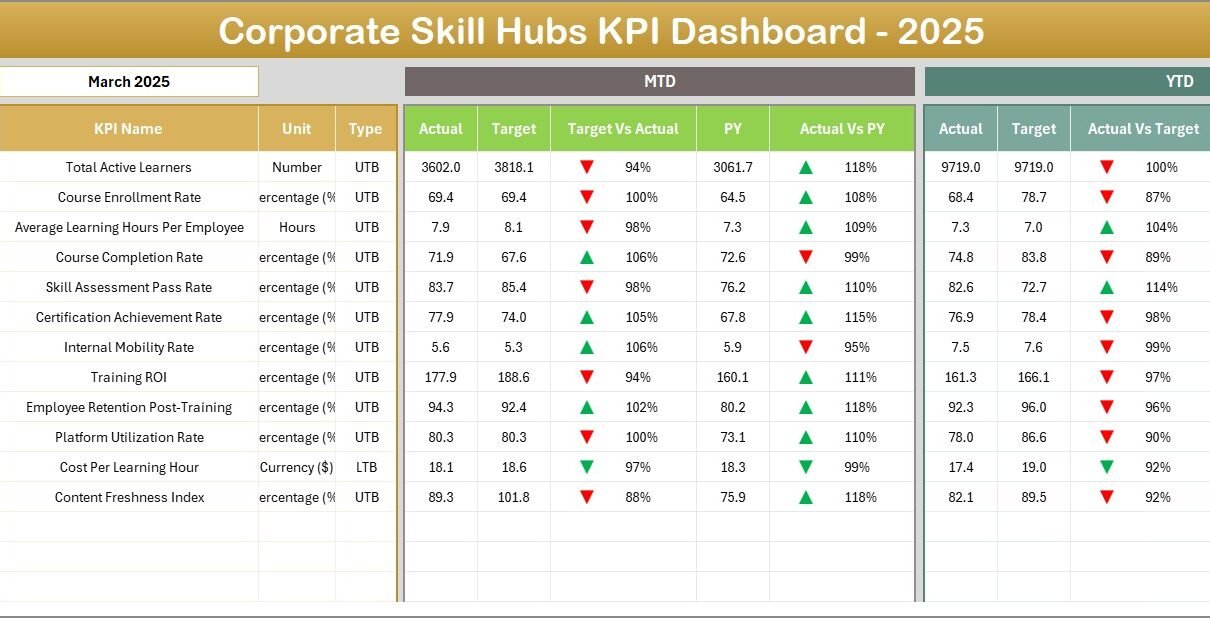
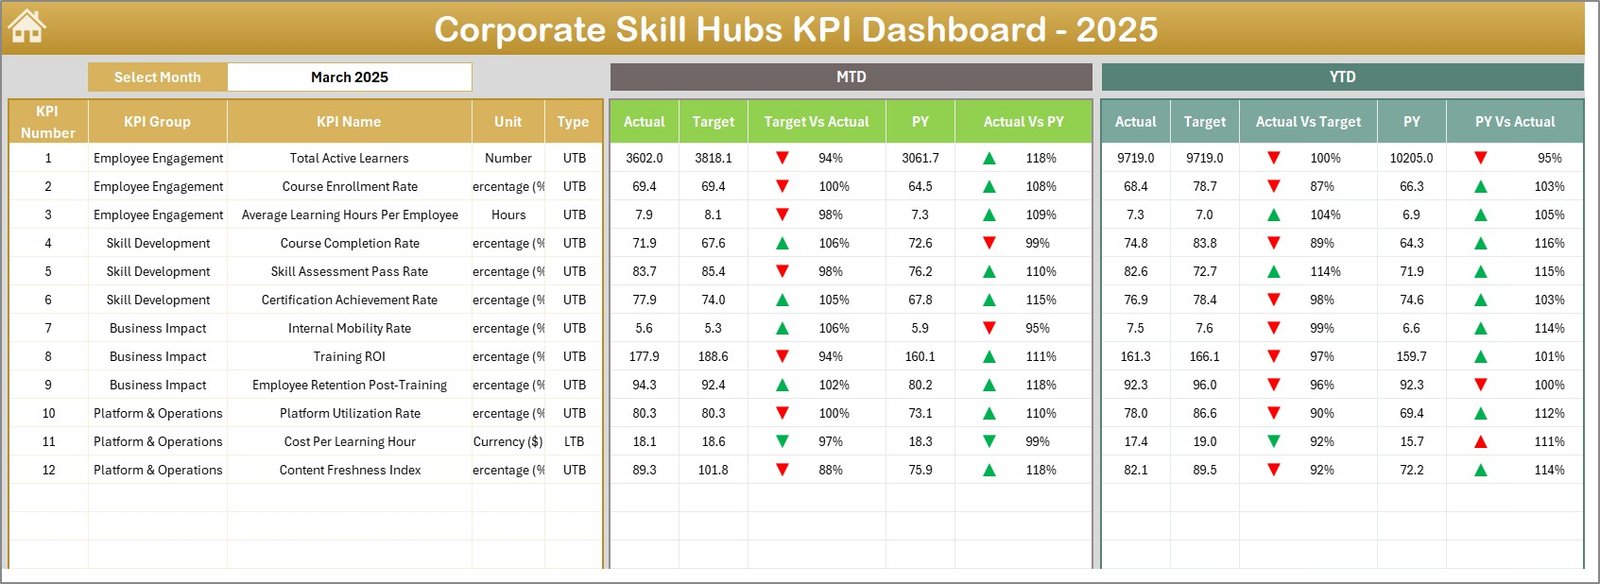
2. Dashboard Sheet
This is the core sheet where all KPI data converge for detailed analysis. The Month dropdown control at range D3 allows you to switch between months, automatically refreshing the dashboard’s statistics.
The dashboard displays:
- MTD Actual, Target, Previous Year data alongside comparison metrics such as Target Vs Actual and Previous Year Vs Actual.
- YTD Actual, Target, Previous Year figures with conditional formatting arrows indicating improvements or declines.
 Corporate Skill Hubs KPI Dashboard
Click to Buy Corporate Skill Hubs KPI Dashboard in Excel
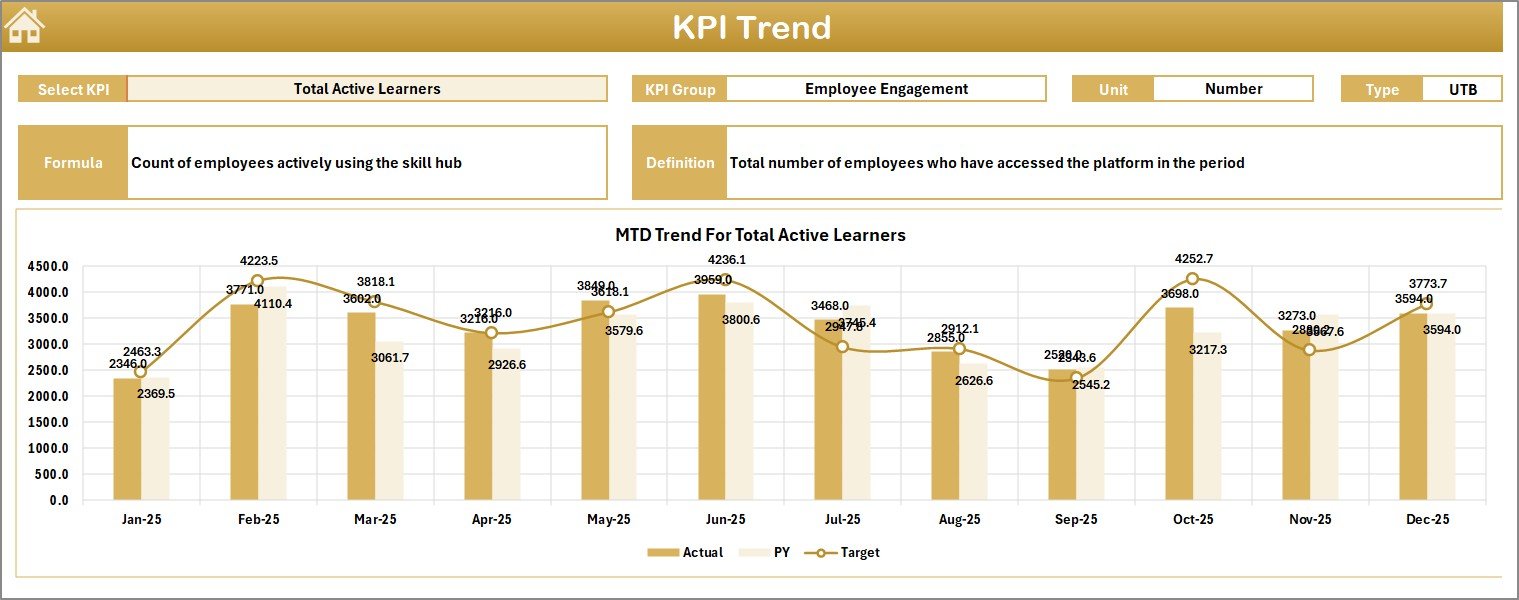
3. KPI Trend Sheet
Select any KPI from the dropdown at range C3 to view detailed information including:
- KPI Group
- Unit of measure
- Type of KPI (whether Lower The Better or Upper The Better)
- Formula and comprehensive KPI definition
It also features dynamic MTD and YTD trend charts comparing actual, target, and previous year figures that help spot performance trends quickly.
 KPI Trend Sheet
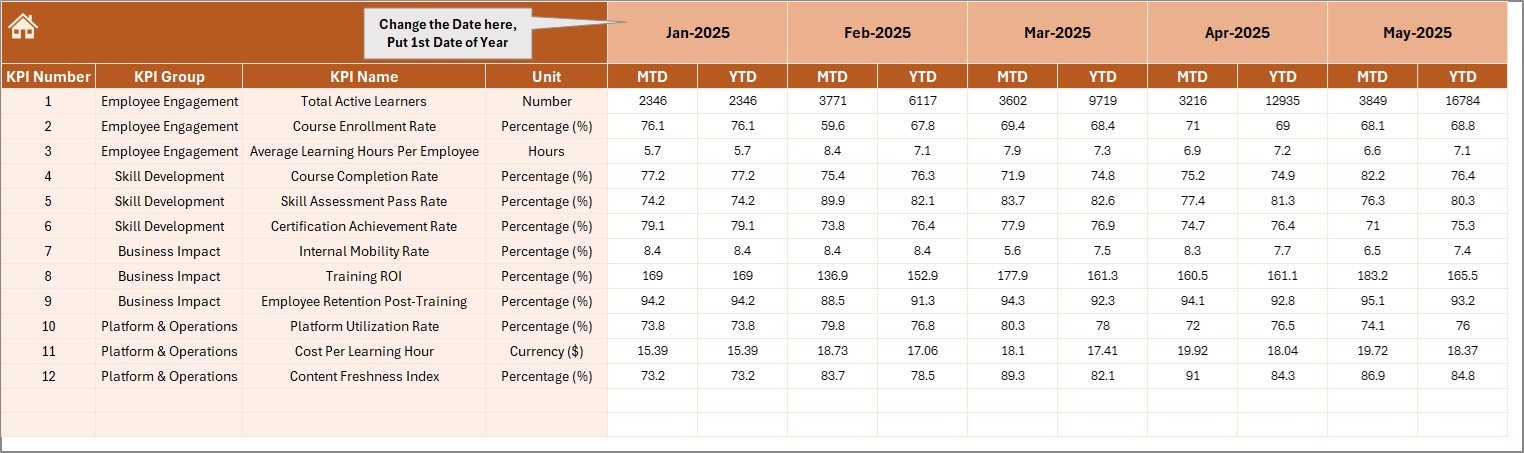
4. Actual Numbers Input Sheet
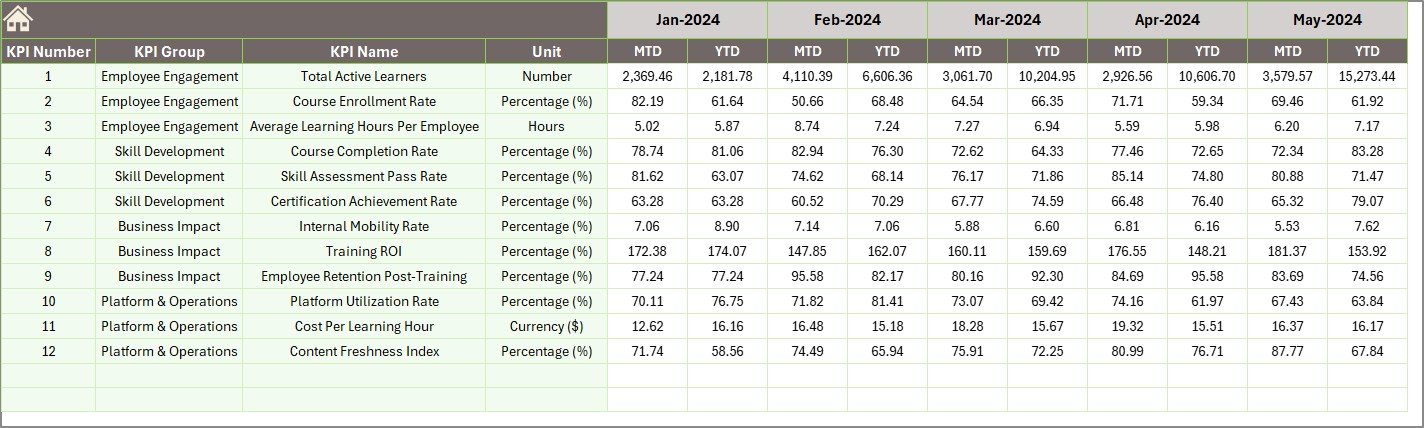
This sheet is dedicated for inputting actual MTD and YTD numbers for each month. Change the first month of the year by modifying the value located at range E1. This flexibility allows you to align the data entry with your organization’s fiscal calendar.
 Actual Numbers Input sheet
Click to Buy Corporate Skill Hubs KPI Dashboard in Excel
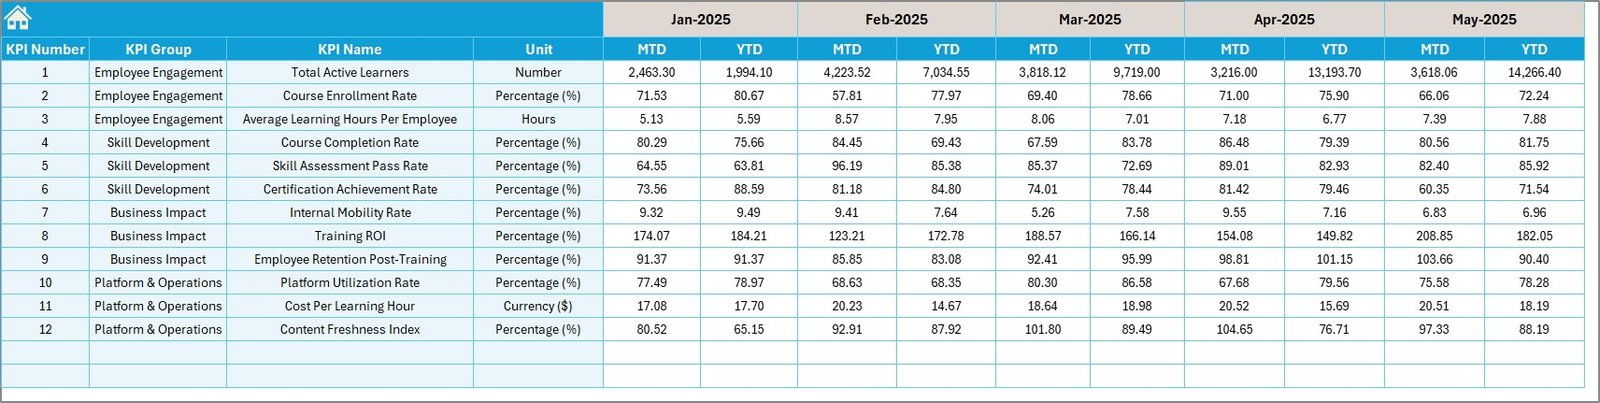
5. Target Number Input Sheet
This sheet is used to enter target values for each KPI, both for MTD and YTD periods. Accurate target input is essential to meaningful comparison and performance evaluation.
 Target Number Input sheet
6. Previous Year Number Input Sheet
Enter last year’s corresponding monthly figures here. This allows direct year-on-year comparisons within the dashboard.
 Previous Year Number Input sheet
7. KPI Definition Sheet
Maintain a clean and meaningful list of KPIs by filling out this sheet with the KPI Name, Group, Unit, Formula, Definitions, and KPI Type (denoted as LTB or UTB). This enables accurate interpretation and consistent usage across the organization.
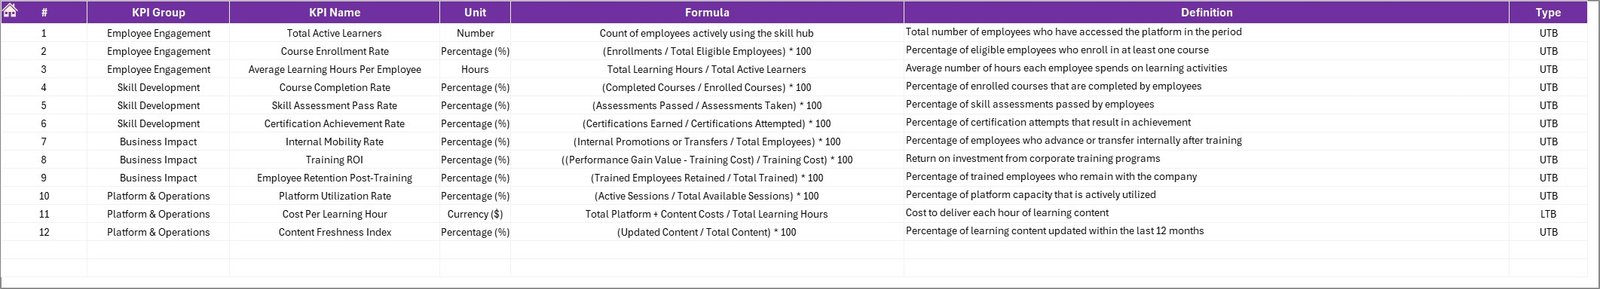 KPI Definition sheet
Click to Buy Corporate Skill Hubs KPI Dashboard in Excel
Advantages of Corporate Skill Hubs KPI Dashboard
- User-Friendly Navigation: Easy-to-use buttons and dropdowns reduce complexity.
- Real-Time Data Analysis: Dynamic month selection enables up-to-date KPI monitoring.
- Comprehensive Performance View: MTD, YTD, target, and previous year comparison facilitate informed decision-making.
- Visual Trend Insights: Embedded charts visualize KPI trajectories enhancing clarity.
- Customizable Input Fields: Separate sheets for actuals, targets, and previous year data allow systematic data updates.
- Clear KPI Definitions: Understand KPI metrics better by referring to well-documented KPI definitions.
Opportunities for Improvement
- Integrate automated data import from external HR/skill management systems to reduce manual entry.
- Add alert systems to notify users of KPIs that are underperforming or exceeding targets significantly.
- Include role-based access to allow collaborative input while maintaining data security.
- Expand dashboard visualizations with heatmaps or gauges for rapid KPI status recognition.
Best Practices
Click to Buy Corporate Skill Hubs KPI Dashboard in Excel
- Regularly update Actual, Target, and Previous Year data to keep reports current and reliable.
- Ensure consistent use of definitions and KPI types to avoid confusion.
- Leverage the trend charts for monthly reviews and strategic planning sessions.
- Educate all relevant stakeholders on how to navigate and interpret the dashboard effectively.
- Back up your Excel file regularly to prevent data loss.
FAQs
Can I customize the KPIs in the dashboard?
Yes, the KPI Definition sheet allows you to add, modify, or remove KPIs as per your organizational needs.
Is this dashboard compatible with all versions of Excel?
The dashboard works best with Excel 2016 and newer versions due to dropdowns and conditional formatting features.
Can I integrate data from other software?
Currently, the dashboard requires manual input, but you can link data via Power Query or VBA macros if you have advanced Excel skills.
How often should data be updated?
Ideally, after each reporting period-monthly for MTD and YTD data-to maintain accuracy and relevance.
Conclusion
Click to Buy Corporate Skill Hubs KPI Dashboard in Excel
The Corporate Skill Hubs KPI Dashboard is a powerful yet simple tool that empowers organizations to manage and track their skill development metrics more effectively. With its clear visualizations, dynamic interactivity, and well-organized structure, this ready-to-use template enhances data-driven decision-making and strategic planning. By adopting best practices and continually updating the data, businesses can unlock meaningful insights and improve their corporate skill initiatives.
For more advanced Excel dashboard templates and tutorials, consider visiting Microsoft Excel Support for official resources.
Visit our YouTube channel to watch the demo: Youtube.com/@NextGenTemplates
Click to Buy Corporate Skill Hubs KPI Dashboard in Excel