Real Estate Agent Dashboard in Power BI is a professionally designed, interactive analytics template that empowers real estate agents, brokers, property managers, and sales teams to monitor property sales performance, compare agent productivity, analyze market trends by neighborhood and city, and evaluate client satisfaction — all within a single Power BI file. Whether you are an individual agent tracking your commissions or a real estate firm managing a team of agents across multiple regions, this Power BI dashboard template gives you the analytical edge you need to make smarter, data-driven decisions.
This dashboard includes 5 interactive pages — Overview, Agent Performance, Market Analysis, Sales Trend, and Property Insights — and tracks 5 key performance indicators: Total Sales Value, Total Commission, Total Records, Avg Days On Market, and Sale Conversion Rate. With built-in slicers for Region, Property Type, Agent Name, Neighborhood, City, Transaction Type, and Month, you can filter and drill down into any dimension instantly. If you work in the real estate analytics space, this template is a must-have addition to your toolkit.
Key Features of Real Estate Agent Dashboard in Power BI
- 5 Interactive Dashboard Pages – Overview, Agent Performance, Market Analysis, Sales Trend, and Property Insights deliver a 360-degree view of real estate operations.
- 5 KPI Cards on Overview Page – Total Sales Value, Total Commission, Total Records, Avg Days On Market, and Sale Conversion Rate for instant executive visibility.
- Dynamic Slicers – Filter by Region, Property Type, Agent Name, Neighborhood, City, Transaction Type, and Month across all pages.
- Agent-Level Performance Tracking – Compare properties sold, commission earned, and market days by each agent.
- Neighborhood and City Market Analysis – Analyze sales value distribution, listing vs. sale price gaps, and average days on market.
- Monthly Sales Trend Analysis – Track commission trends, transaction type patterns, and seasonal performance shifts.
- Client Satisfaction Metrics – Evaluate average client satisfaction scores by property type on the Property Insights page.
- No Coding Required – Replace sample data and all charts, KPIs, and slicers update automatically.
Dashboard Pages Explained
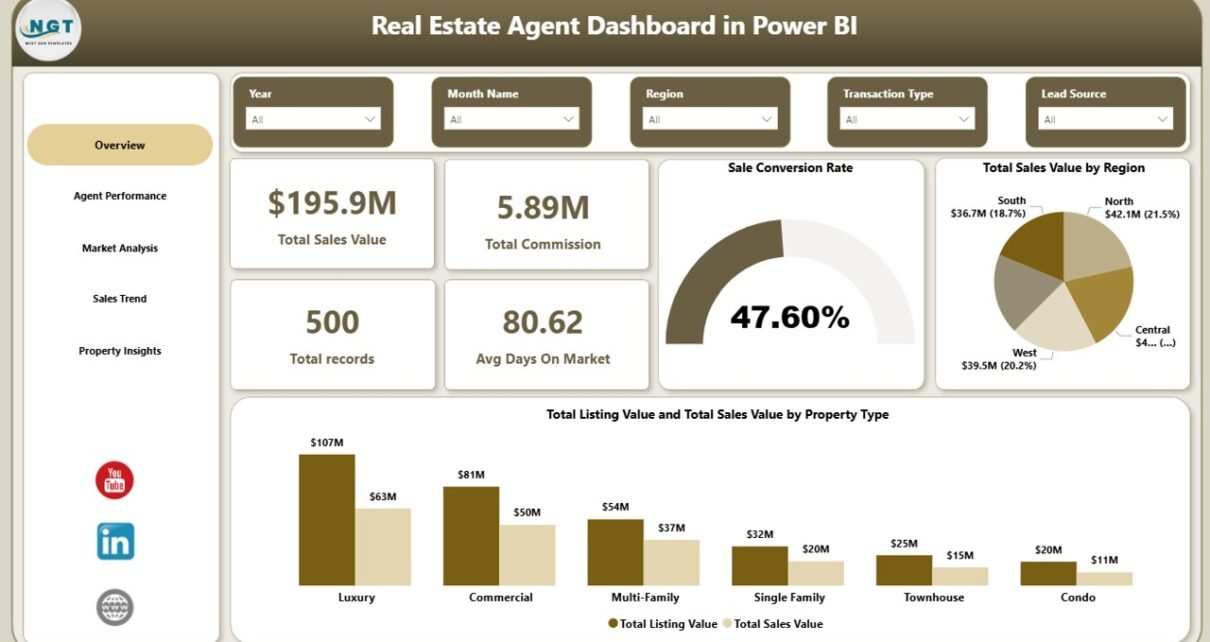
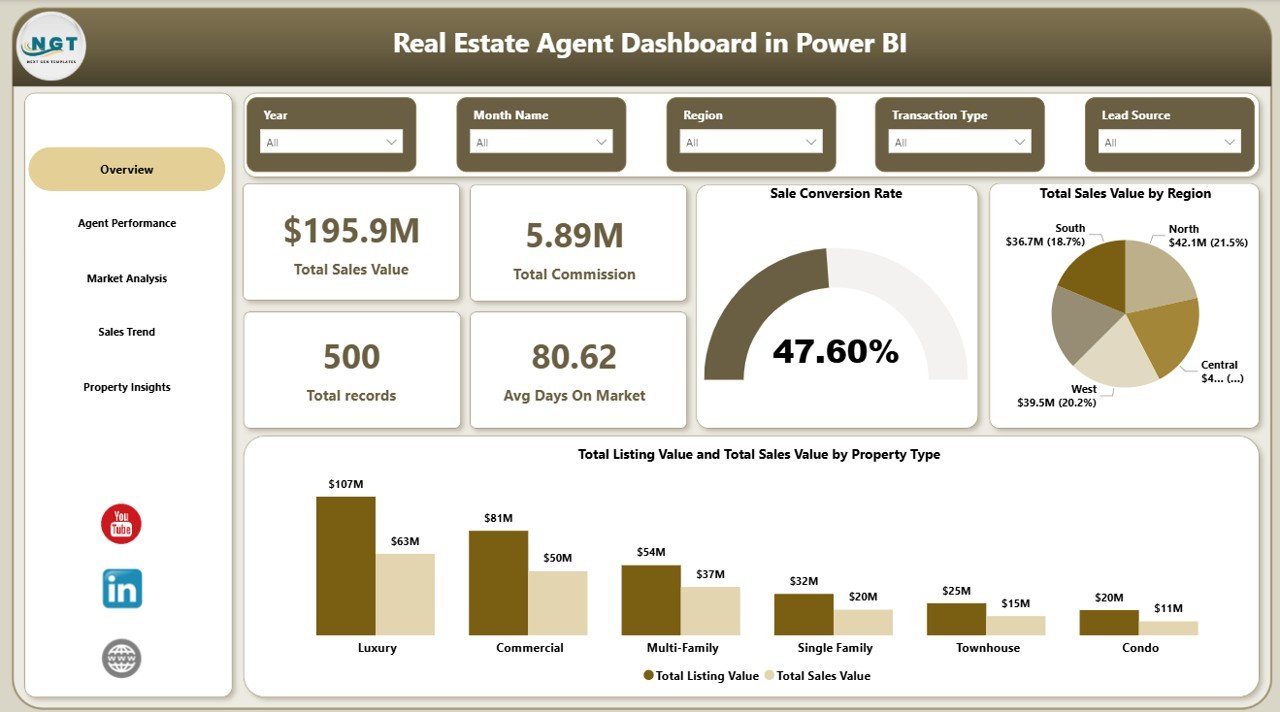
1. Overview Page
The Overview page is the executive summary of your real estate business. At the top, 5 KPI cards display Total Sales Value, Total Commission, Total Records, Avg Days On Market, and Sale Conversion Rate — giving you an instant snapshot of overall performance. Below the cards, you will find charts showing Total Sales Value by Region, which helps you understand which geographic areas are generating the most revenue, and a comparison of Total Listing Value vs Total Sales Value by Property Type, which reveals pricing gaps and negotiation patterns across residential, commercial, and other property categories. Multiple slicers allow you to filter the entire page by any combination of dimensions.
Real Estate Agent Dashboard in Power BI
2. Agent Performance
The Agent Performance page focuses on individual agent productivity and effectiveness. It displays Total Sold by Agent Name so you can see which agents are closing the most deals, Total Commission by Agent Name to understand earning distribution across your team, and Avg Days On Market by Agent Name to identify agents who are selling properties faster. This page is invaluable for team leaders and brokerage managers who need to evaluate agent performance, set benchmarks, and identify coaching opportunities.
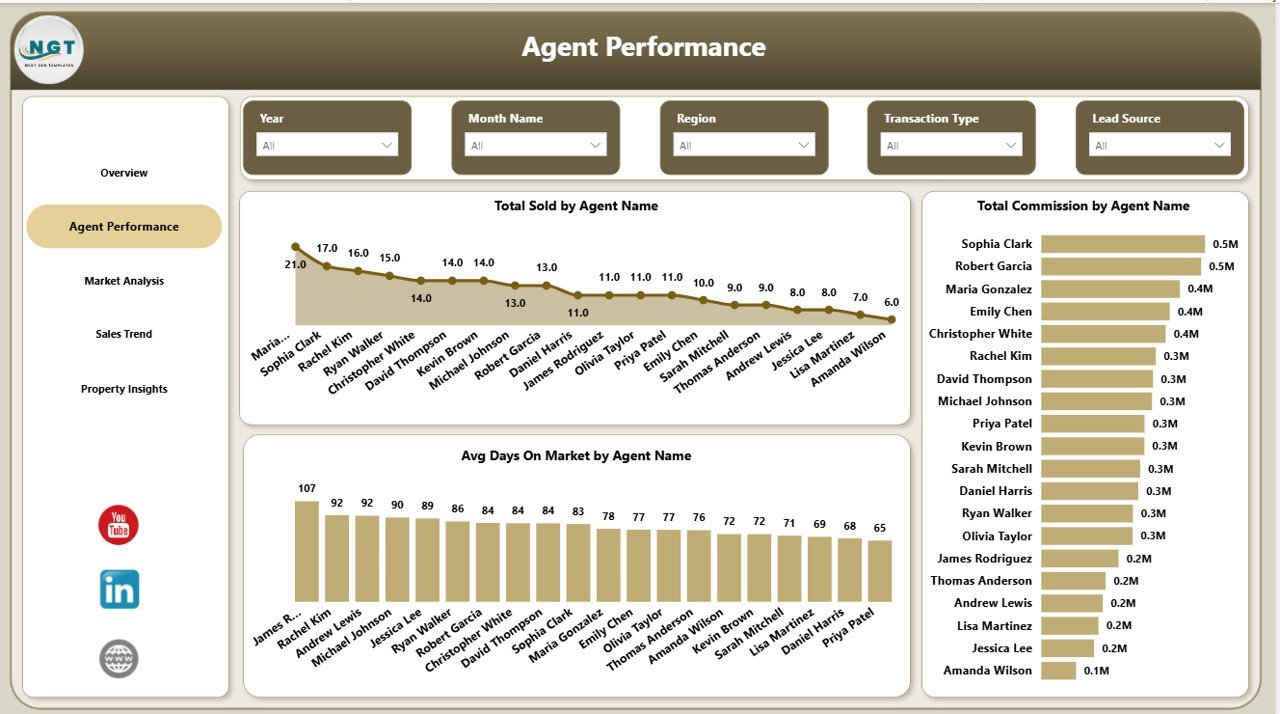
Agent Performance
3. Market Analysis
The Market Analysis page provides deep geographic and property-type insights. Total Sales Value by Neighborhood shows which neighborhoods are driving the highest sales volumes. Avg Days On Market by Property Type reveals how quickly different property categories are moving. Total Sales Value and Total Listing Value by City gives you a side-by-side comparison of listed vs. actual sale prices across cities, helping you understand where pricing negotiations are most aggressive and where properties sell closer to asking price.
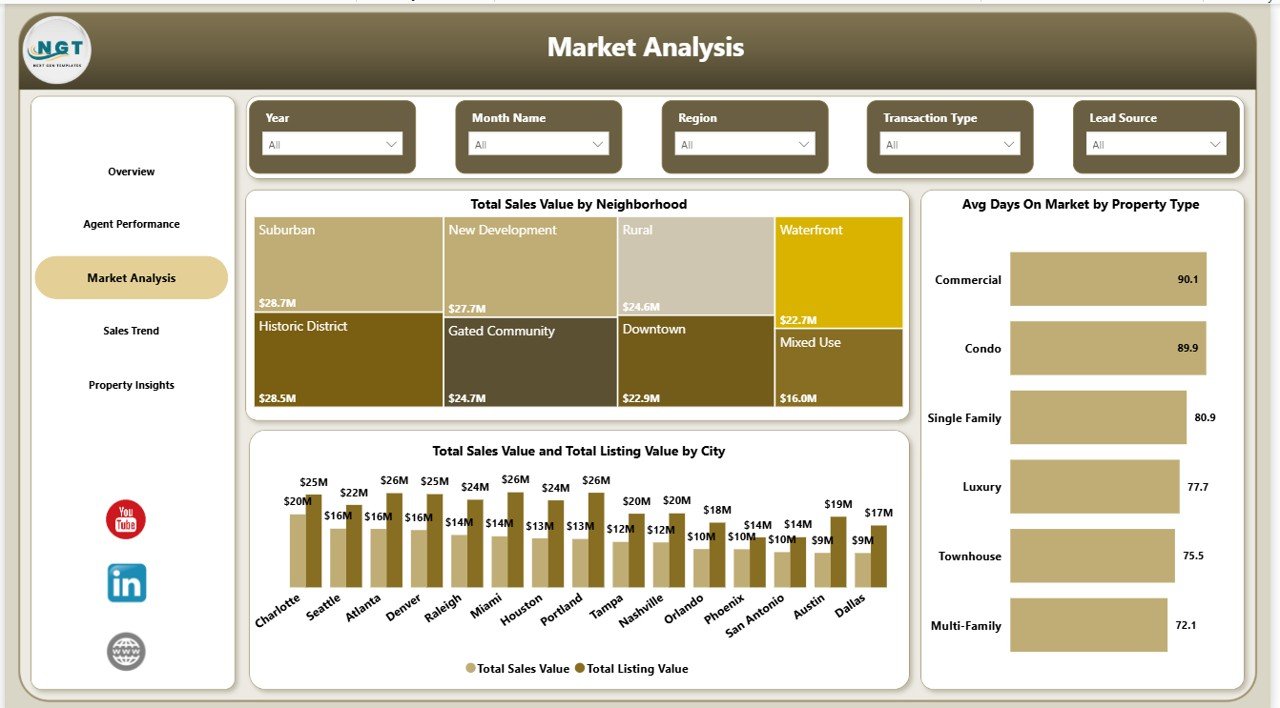
Market Analysis
4. Sales Trend
The Sales Trend page helps you understand performance patterns over time. Total Sales Value by Transaction Type breaks down revenue by sale type (e.g., new listings, resales, foreclosures). Avg Days On Market by Property Type tracks how market speed varies across categories. Total Commission by Month Name reveals monthly earning patterns, helping you plan for seasonal fluctuations and forecast future revenue.
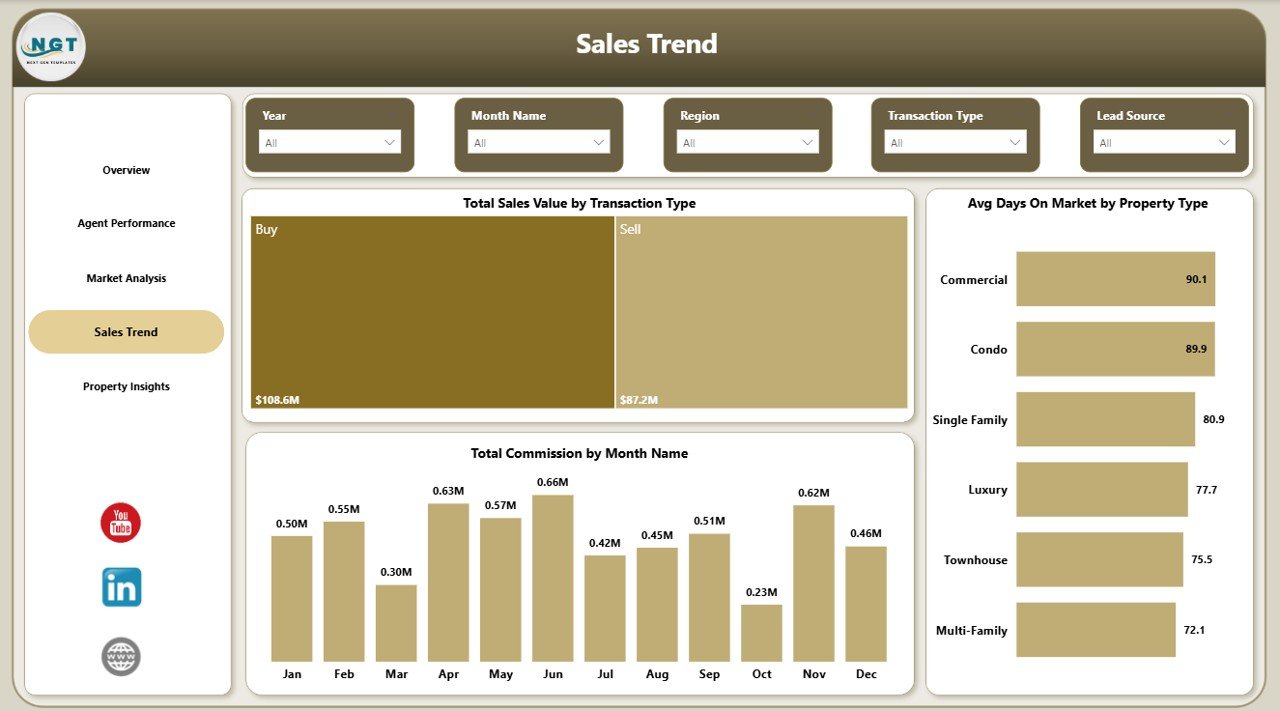
Sales Trend
5. Property Insights
The Property Insights page delivers granular analysis at the property level. Total Sold by Transaction Type shows the volume breakdown by transaction category. Avg Client Satisfaction by Property Type helps you understand which property categories generate the happiest clients. Total Records by Property Type gives you the overall distribution of your real estate portfolio, enabling better resource allocation and marketing focus.
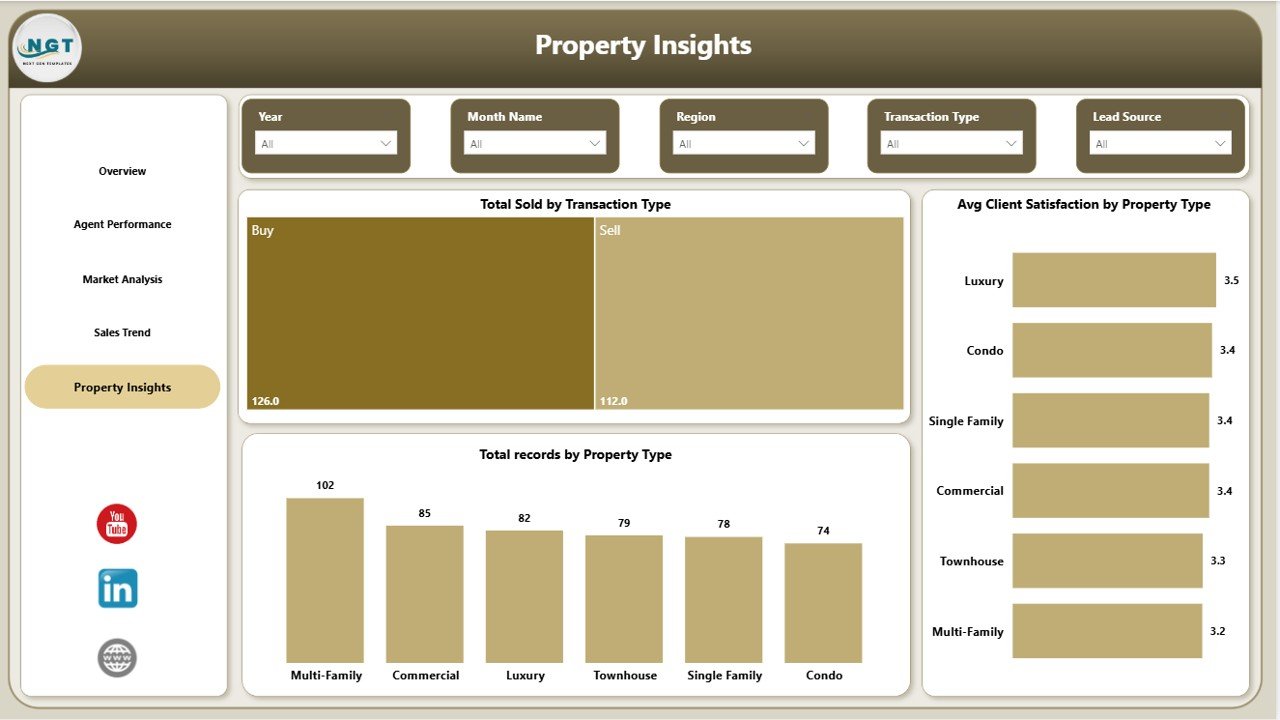
Property Insights
Advantages of Real Estate Agent Dashboard in Power BI
- Centralized Performance Monitoring – Track all sales, commissions, agent KPIs, and market metrics in one place instead of scattered spreadsheets.
- Data-Driven Agent Management – Identify top-performing agents, set realistic targets, and provide performance-based coaching with clear data.
- Market Intelligence – Understand neighborhood-level sales patterns, pricing gaps, and property type demand to focus your marketing efforts where they matter most.
- Time Savings – Automated KPIs and charts eliminate manual reporting, freeing up hours every week for client-facing activities.
- Professional Presentations – Clean, modern design makes this dashboard perfect for team meetings, quarterly reviews, and executive presentations.
Opportunities for Improvement
- Adding a dedicated Lead Pipeline page to track prospects from inquiry to closing would make the dashboard even more comprehensive.
- Including year-over-year comparison charts would help agents and managers benchmark growth against previous periods.
- A geographic heat map visualization could provide more intuitive spatial analysis of sales concentration areas.
- Integration with Power BI Service for automatic data refresh would keep the dashboard current without manual updates.
Best Practices for Using This Dashboard
- Update Data Weekly – Replace sample data with your latest transaction records every week to keep KPIs current and actionable.
- Use Slicers Strategically – Combine multiple slicer selections (e.g., Region + Property Type + Month) for granular insights specific to your focus area.
- Benchmark Against Targets – Set internal sales and commission targets and compare actual performance on the Overview page regularly.
- Share with Your Team – Publish the dashboard to Power BI Service so all agents can access their performance data in real time.
- Review Agent Performance Monthly – Use the Agent Performance page during monthly 1-on-1s to have data-backed coaching conversations.
Explore Relevant Templates
If you found this Real Estate Agent Dashboard in Power BI useful, check out these related templates on NextGenTemplates:
- Rental Property Investment Dashboard in Power BI – Track rental income, occupancy rates, and ROI across your investment properties.
- Real Estate Agent Dashboard in Excel – Same real estate analytics in Microsoft Excel for teams who prefer spreadsheet-based reporting.
- Real Estate Agent Dashboard in HTML – Browser-based version that opens in any web browser with zero software installation.
- Crypto Portfolio Dashboard in Power BI – Another Power BI dashboard for tracking investment performance and portfolio analytics.
Frequently Asked Questions
What is the best Power BI dashboard for real estate agents?
The Real Estate Agent Dashboard in Power BI from NextGenTemplates is one of the best options available. It includes 5 interactive pages tracking sales performance, agent productivity, market analysis, sales trends, and property insights with 5 high-level KPIs and dynamic slicers for instant filtering.
How do I track real estate sales performance in Power BI?
You can use the Real Estate Agent Dashboard in Power BI to track sales performance by importing your transaction data into the .pbix file. The dashboard automatically calculates Total Sales Value, Total Commission, Sale Conversion Rate, and other KPIs across all 5 pages.
Can I compare multiple real estate agents’ performance in this dashboard?
Yes. The Agent Performance page provides side-by-side comparisons of Total Sold, Total Commission, and Avg Days On Market for each agent, making it easy to identify top performers and set benchmarks.
Does this dashboard show market trends by neighborhood?
Yes. The Market Analysis page includes a chart showing Total Sales Value by Neighborhood, along with Avg Days On Market by Property Type and a city-level comparison of listing vs. sale values.
Do I need a Power BI license to use this template?
No paid license is required. You can open and use the .pbix file with Power BI Desktop, which is free to download from Microsoft. A Power BI Pro license is only needed if you want to publish and share dashboards online via Power BI Service.
Conclusion
The Real Estate Agent Dashboard in Power BI is a powerful analytics solution for anyone in the real estate industry who wants to track sales, monitor agent performance, understand market dynamics, and make data-driven decisions. With 5 interactive pages, 5 KPIs, dynamic slicers, and a professional design, this template saves you hours of manual reporting and delivers actionable insights at your fingertips.
🛒 Click here to Purchase Real Estate Agent Dashboard in Power BI
🎥 Visit our YouTube channel for step-by-step video tutorials:
👉 Youtube.com/@PK-AnExcelExpert