Budget Calculator in Excel is a free, ready-to-use personal budgeting template built on the 50/30/20 rule — one of the most widely recommended money management frameworks by financial planners. The template splits your monthly take-home pay into 3 categories: Needs (50%), Wants (30%), and Savings (20%), tracks expenses across 15+ sub-categories, and visualizes your budget performance with 2 interactive charts. According to a 2024 Bankrate survey, only 44% of Americans can cover a $1,000 emergency expense from savings — a structured budget calculator like this is the first step toward better financial health.
Whether you earn $3,000 or $10,000 per month, the Budget Calculator in Excel gives you a clear, formula-driven framework to plan spending, track actual expenses, and identify overspending in seconds. No VBA, no macros, no pivot tables — just enter your income and start logging transactions. If you want a more advanced multi-page finance dashboard with pivot charts and slicers, explore the Personal Finance Dashboard in Excel ($17.99) for 5 interactive pages covering income, spending, budgets, and transaction status.
Key Features of Budget Calculator in Excel
👉 Click here to Download Budget Calculator in Excel — Free
The Budget Calculator in Excel includes 2 pages — a Dashboard page and a Data Sheet — that work together to give you complete budget visibility. Here are the standout features:
- 50/30/20 Budget Rule Automation — Enter your monthly take-home pay once and the calculator divides it into Needs (50%), Wants (30%), and Savings (20%) target amounts. Three KPI-style allocation cards display exact dollar values for each category.
- Target vs Actual Comparison Table — A 4-column summary table (Category, Target, Actual, Difference) updates automatically as you log expenses. Positive difference values mean you are under budget; negative values flag overspending immediately.
- Actual vs Target Spending Bar Chart — A grouped bar chart compares your target budget against actual spending for all three categories. This visual makes overspending patterns obvious at a glance.
- Budget Allocation Pie Chart — A 3-slice pie chart shows how your total income is distributed across Needs, Wants, and Savings with dollar values on each slice.
- Built-In Expense Tracker with 15+ Sub-Categories — The Data Sheet logs every transaction with 5 fields: Date, Description, Category, Amount, and Sub-Category. Sub-categories cover Housing, Utilities, Food, Transportation, Insurance, Healthcare, Retirement, Entertainment, Shopping, Fitness, Hobbies, Food & Drink, Debt, and Savings.
- Zero Formulas to Edit — All calculations use pre-built Excel formulas. Change your income and everything recalculates. Add an expense row and summaries refresh. Works on Windows and Mac Excel.
Template Pages Explanation
👉 Click here to Download Budget Calculator in Excel — Free
1 — Dashboard Page
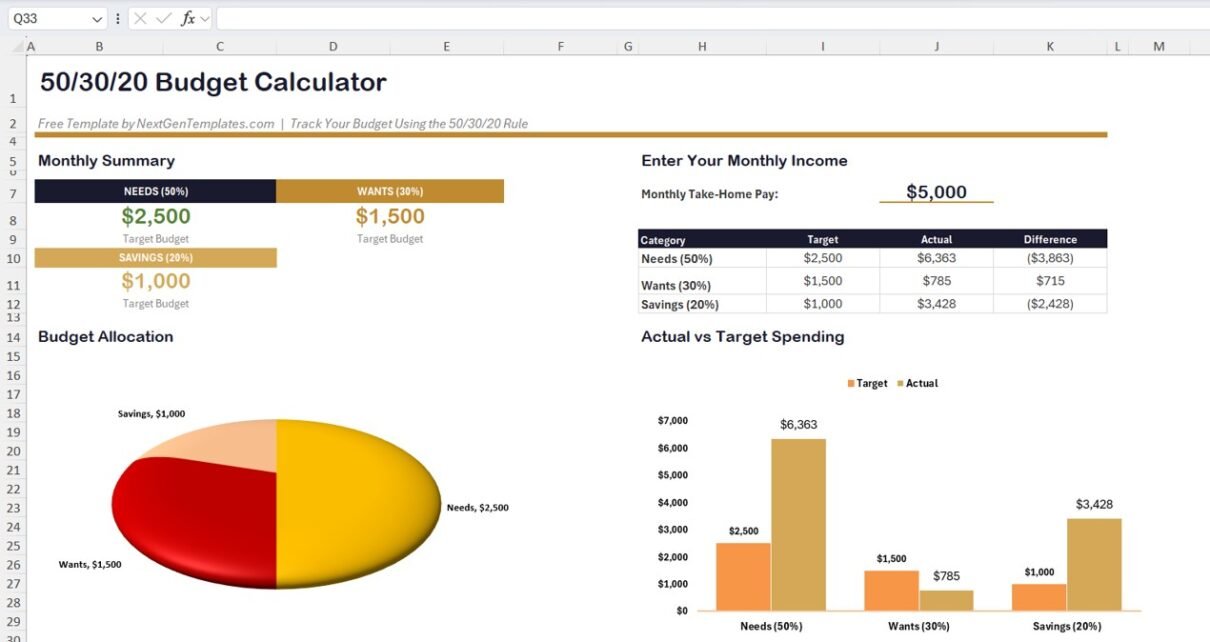
The Dashboard page is the main view of the Budget Calculator in Excel. The left section displays the Monthly Summary with three color-coded budget allocation cards: Needs (50%) showing $2,500, Wants (30%) showing $1,500, and Savings (20%) showing $1,000 — based on the $5,000 sample income. Below the cards, a Budget Allocation pie chart visualizes the income split across all three categories.
The right section contains the “Enter Your Monthly Income” input field where you type your monthly take-home pay. Below it, a comparison table displays Category, Target, Actual, and Difference for Needs, Wants, and Savings. The Actual vs Target Spending bar chart at the bottom provides a visual comparison — in the sample data, Needs actual spending ($6,363) significantly exceeds the $2,500 target, while Wants ($785) comes in well under the $1,500 budget. This kind of instant visual feedback helps you course-correct your spending habits each month.
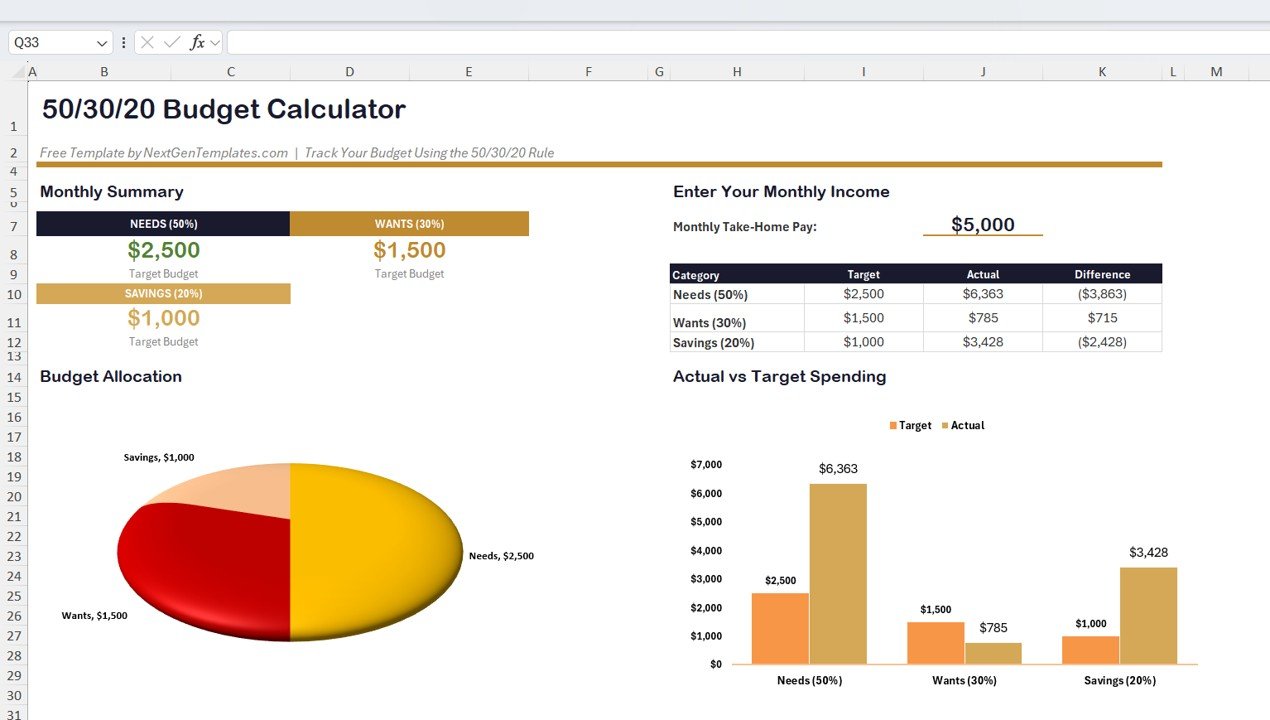
Dashboard Page — Monthly Summary, Budget Allocation Pie Chart, Target vs Actual Table and Bar Chart
Click here to download the Budget Calculator in Excel — Free
2 — Data Sheet
The Data Sheet is where you log every income and expense transaction. It contains 5 structured columns: Date, Description, Category (Needs, Wants, or Savings), Amount, and Sub-Category. The sample data includes 35+ rows of transactions spanning January through April 2025, covering expenses like Rent/Mortgage ($1,500), 401(k) Contribution ($281-$342), IRA Deposit ($279-$308), Groceries ($91-$173), Public Transit ($35-$144), and discretionary items like Movie Tickets, Spotify, and Gym Membership.
Each row is categorized as Needs, Wants, or Savings, and further classified into sub-categories like Housing, Utilities, Food, Transportation, Insurance, Healthcare, Retirement, Entertainment, Shopping, Fitness, Hobbies, and Food & Drink. This granular categorization feeds directly into the Dashboard calculations and charts. To use the template with your own data, simply replace the sample rows with your actual transactions — keeping the same column structure. Learn more about structured data entry from Microsoft’s Excel data entry best practices.
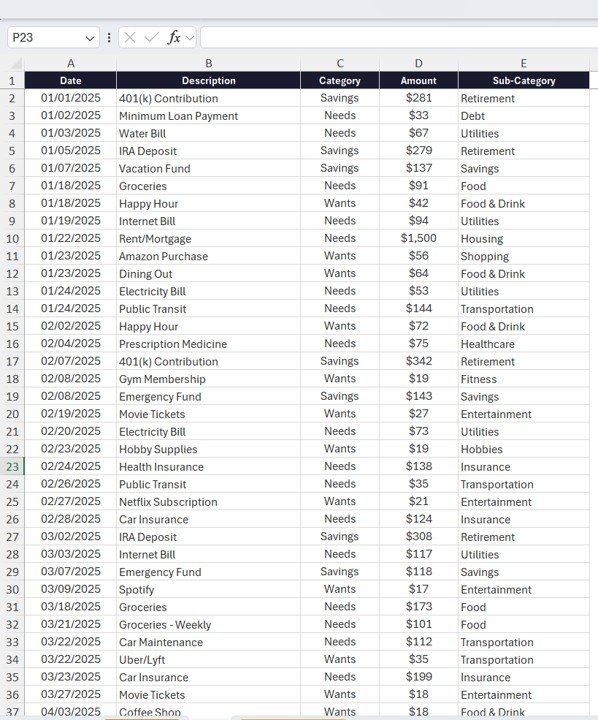
Data Sheet — Transaction log with Date, Description, Category, Amount, and Sub-Category
Budget Calculator in Excel vs. Google Sheets Budget Template vs. YNAB — Feature Comparison
| Feature | Budget Calculator in Excel | Google Sheets Budget Template | YNAB (You Need a Budget) |
|---|---|---|---|
| Cost | $0 free download | Free (with Google account) | $14.99/month ($99/year) |
| Platform | Microsoft Excel (desktop) | Google Sheets (browser) | Web + Mobile app |
| Setup Time | Under 5 minutes | 10-15 minutes | 30+ minutes with bank linking |
| 50/30/20 Rule Built-In | ✅ Automatic allocation | ❌ Manual setup | ❌ Custom categories only |
| Bank Account Sync | ❌ Manual entry | ❌ Manual entry | ✅ Auto-sync |
| Offline Access | ✅ Full offline use | ❌ Requires internet | ❌ Requires internet |
| Data Privacy | ✅ 100% local file | Stored on Google servers | Stored on YNAB servers |
| Customizable Fields | ✅ Fully editable | ✅ Editable | Limited |
| Year-1 Cost (1 user) | $0 | $0 | $99/year |
For individuals who want a structured 50/30/20 budget tracker without paying monthly subscriptions or sharing financial data with third-party servers, the Budget Calculator in Excel sits in the sweet spot.
Who Should Use This Template
👉 Click here to Download Budget Calculator in Excel — Free
Perfect for:
- Individuals and families who want to follow the 50/30/20 budgeting method in Excel
- Working professionals tracking monthly take-home pay against spending categories
- Students and young adults building their first personal budget
- Anyone who prefers offline, local-file budgeting over cloud-based subscription apps
Not a fit if:
- You need automatic bank account syncing and real-time transaction imports
- You require multi-user expense approval workflows for a business
- You need investment portfolio tracking (see Crypto Portfolio Dashboard in Excel) or debt payoff calculators (see Debt Payoff Calculator in Excel)
Real-World Use Cases
Priya is a 28-year-old software developer in Bangalore earning ₹80,000 per month. She uses the Budget Calculator in Excel to split her salary into Needs (rent, groceries, utilities), Wants (dining out, subscriptions, shopping), and Savings (mutual funds, emergency fund). Each weekend she logs expenses in the Data Sheet. The Difference column helped her discover she was overspending on food delivery by ₹4,000 per month — money she now redirects to her emergency fund.
James is a recent college graduate in Texas with a $3,200 monthly paycheck. He downloaded the free Budget Calculator in Excel to build his first-ever budget. The 50/30/20 rule gave him a clear framework: $1,600 for Needs, $960 for Wants, and $640 for Savings. After 3 months of tracking, the bar chart showed his “Wants” spending was actually 42% of his income — making the overspending impossible to ignore.
Maria runs a household of four in Madrid. She tracks family expenses across 15 sub-categories. The pie chart gives her husband a quick visual of the monthly budget distribution, and the comparison table helps them agree on spending priorities during their monthly financial review.
Advantages of Budget Calculator in Excel
👉 Click here to Download Budget Calculator in Excel — Free
- Completely Free — No subscription, no hidden fees, no trial period. Download and use forever.
- 5-Minute Setup — Enter your income and start tracking. No bank linking, no account creation needed.
- 100% Data Privacy — Your financial data stays on your computer. No cloud servers, no third-party access.
- Proven 50/30/20 Framework — The budget rule recommended by Senator Elizabeth Warren in “All Your Worth” gives you a research-backed spending structure.
- Visual Feedback — The pie chart and bar chart make overspending patterns visible in seconds. Numbers in a table are easy to ignore; a bar that towers over its target is not.
- Cross-Platform — Works on Excel for Windows, Excel for Mac, and Excel for Microsoft 365.
Opportunities for Improvement
- No Multi-Month Trend Tracking — The current version focuses on a single month’s budget. Users who want to track spending trends over 6-12 months should pair this with the Personal Finance Dashboard in Excel which includes monthly trend charts.
- Manual Data Entry Only — There is no bank sync or CSV import feature. Each transaction must be entered manually in the Data Sheet.
- No Savings Goal Tracking — The 20% Savings allocation shows a target and actual, but there is no progress bar or goal-based tracking. For savings goals, use the Savings Goal Planner in Excel.
- Single-Income Focus — The template uses one income input. Households with multiple income sources may need to sum them before entering the total.
Best Practices
- Log Expenses Weekly — Set a 10-minute weekly reminder to enter transactions. Waiting until month-end leads to forgotten expenses and inaccurate tracking.
- Use Consistent Sub-Categories — Stick to the pre-defined sub-categories (Housing, Utilities, Food, etc.) for clean summaries. Adding too many custom sub-categories can fragment your analysis.
- Review the Difference Column Monthly — If any category shows a negative difference for 3 consecutive months, it signals a structural spending problem that needs a habit change, not just awareness.
- Adjust the 50/30/20 Split if Needed — If you live in a high-cost city where rent alone exceeds 50% of income, consider a 60/20/20 or 70/15/15 split. The formulas are easily editable.
- Pair with a Savings Tracker — Use this calculator for monthly budgeting and the Savings Goal Planner in Excel for long-term savings goal tracking.
Explore Relevant Templates
🔹 Personal Finance Dashboard in Excel — 5 interactive pages with pivot charts, slicers, and KPI cards for income, spending, budget, and transaction tracking. $17.99
🔹 Weekly Expense Tracker in Excel — Log and analyze weekly expenses with automatic category totals and visual spending breakdown. Free
🔹 Savings Goal Planner in Excel — Plan and track multiple savings goals with visual progress indicators. $4.99
🔹 Debt Payoff Calculator in Excel — Compare Snowball vs Avalanche strategies with automated calculations.
🔹 Also available: Personal Finance Dashboard in Power BI ($17.99) | Personal Finance Dashboard in HTML ($12.99) | Weekly Expense Tracker in Google Sheets (Free)
Frequently Asked Questions
👉 Click here to Download Budget Calculator in Excel — Free
What is the 50/30/20 budget rule and how does this Excel template use it?
The 50/30/20 rule allocates 50% of your monthly take-home pay to Needs, 30% to Wants, and 20% to Savings. The Budget Calculator in Excel automates this split — enter your income on the Dashboard page and three allocation cards instantly calculate target amounts for each category.
Is the Budget Calculator in Excel really free to download?
Yes. The Budget Calculator in Excel is a completely free template from NextGenTemplates. Download it instantly, use it offline in Microsoft Excel, and customize it without any subscription fees or hidden costs.
How many expense categories does this budget calculator support?
The Budget Calculator in Excel tracks 3 main categories (Needs, Wants, Savings) and 15+ sub-categories including Housing, Utilities, Food, Transportation, Insurance, Healthcare, Retirement, Entertainment, Shopping, Fitness, Hobbies, Food and Drink, Debt, and Savings.
How does this free template compare to YNAB or other paid budgeting apps?
The Budget Calculator in Excel is free and keeps your data 100% local on your computer. YNAB costs $99/year and stores data on external servers. For users who value privacy and simplicity over automatic bank syncing, this Excel template is the better fit.
Does this budget calculator work on Mac Excel?
Yes. The Budget Calculator in Excel uses standard Excel formulas and charts with no VBA or macros. It is fully compatible with Excel for Windows, Excel for Mac, and Excel for Microsoft 365.
Can I change the 50/30/20 percentages to something different?
Yes. The percentage formulas are in the Dashboard page cells. You can adjust them to 60/20/20, 70/15/15, or any split that matches your financial situation. All allocation cards and charts will recalculate automatically.
How long does it take to set up the Budget Calculator in Excel?
Setup takes under 5 minutes. Enter your monthly income on the Dashboard page, then start logging expenses in the Data Sheet. All charts and summary cards update automatically with no formulas to edit.
About the Author
Built by PK — Microsoft Certified Professional with 15+ years of Excel, Google Sheets, and Power BI experience. Founder of NextGenTemplates, reaching 300K+ subscribers across YouTube channels. Every template is hand-built and tested before release.
Conclusion
Managing your money starts with knowing where it goes. The Budget Calculator in Excel gives you a free, structured, and visual way to apply the 50/30/20 rule to your monthly income — with automatic target calculations, a built-in expense tracker covering 15+ sub-categories, and two charts that make overspending impossible to miss. Download it today, enter your income, and take control of your budget in under 5 minutes.
👉 Click here to Download Budget Calculator in Excel — Free
✅ Instant download · Free template · No subscription · Lifetime access
🎥 Visit our YouTube channel for step-by-step video tutorials:
👉 Youtube.com/@PK-AnExcelExpert