The Craft Brewery KPI Scorecard in Excel tracks brewery-specific KPIs across 4 structured worksheet tabs, with MTD and YTD trend charts, color-coded performance indicators, and dropdown-driven month selection. According to the Brewers Association, independent craft breweries account for over 13% of the U.S. beer market by volume, yet most small breweries still rely on manual spreadsheets or expensive SaaS platforms for performance tracking. This scorecard bridges that gap with a ready-to-use Excel template that costs $12.99 one-time instead of $150–$500/month for brewery management software.
Tracking craft brewery KPIs in Excel gives brewery owners and operations managers instant visibility into production yield, batch quality, taproom revenue, distribution performance, and cost metrics — all from a single file that works offline, requires no onboarding, and updates automatically when you enter new monthly data. Whether you manage a 5-barrel nano-brewery or a 30-barrel regional operation, the Craft Brewery KPI Scorecard in Excel provides the structured framework you need to monitor performance without paying recurring subscription fees.
Key Features of Craft Brewery KPI Scorecard in Excel
👉 Click here to Purchase the Craft Brewery KPI Scorecard in Excel
The Craft Brewery KPI Scorecard in Excel delivers a complete performance monitoring system with 4 worksheet tabs covering scorecard overview, KPI trend analysis, data input, and KPI definitions. Each KPI displays Actual vs Target values alongside MTD (Month-to-Date) and YTD (Year-to-Date) comparisons, with conditional formatting that instantly flags underperforming metrics in red and strong performers in green.
The scorecard supports both “Upper the Better” KPIs (like revenue, production volume, and customer satisfaction) and “Lower the Better” KPIs (like defect rate, waste percentage, and cost per barrel), automatically adjusting the performance logic for each metric type. Every KPI includes its formula, unit of measurement, and definition for complete transparency across your team.
The KPI Trend sheet provides dynamic Actual vs Target vs Prior Year trend charts that update when you select any KPI from the dropdown in cell C3. This gives brewery managers instant visibility into production yield, batch quality, taproom sales, distribution revenue, and cost-per-barrel trends over 12 months. The template uses standard Excel formulas and charts with no macros or VBA, making it compatible with Excel for Windows, Mac, and Excel Online.
Dashboard Pages Explanation
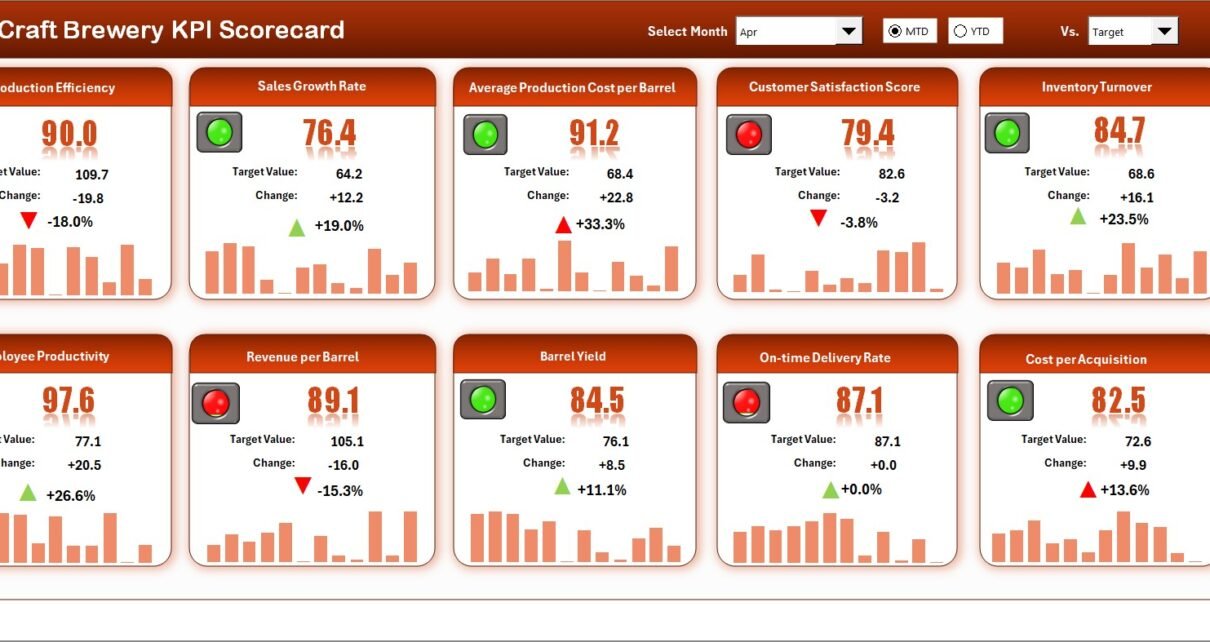
1. Scorecard Sheet
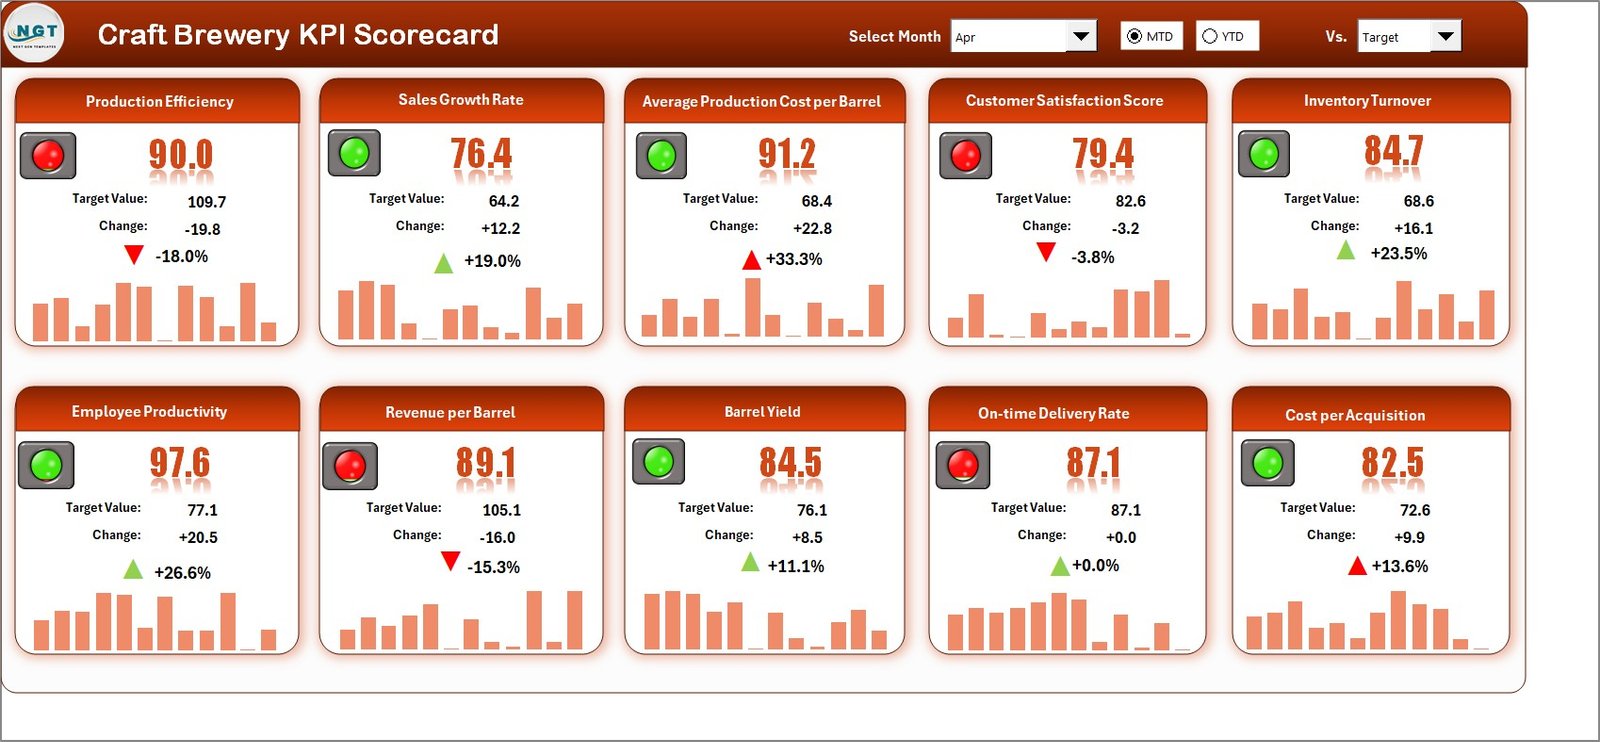
Craft Brewery KPI Scorecard in Excel
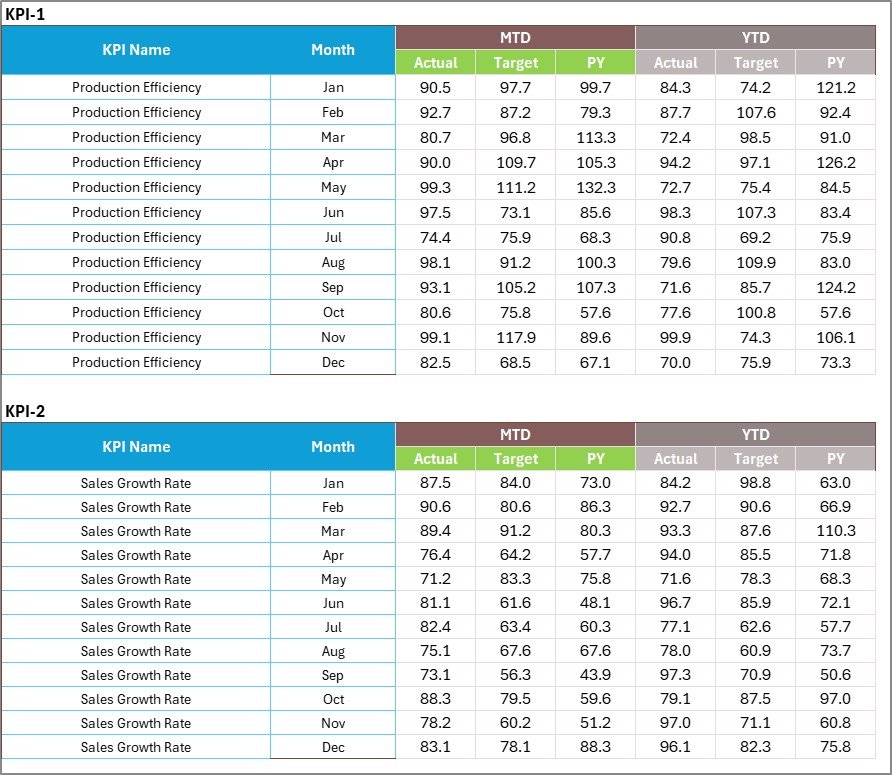
The Scorecard sheet is the main interface where you view all KPI performance at a glance. Key features include:
- Dropdown Menus – Select the month, MTD (Month-to-Date), or YTD (Year-to-Date) for performance analysis
- Actual vs Target Values – Compare actual performance against targets for each KPI
- Visual Indicators – Quickly see performance status using color-coded conditional formatting (green for on-target, red for below target)
- KPI Overview – Display all relevant information about each KPI, including MTD and YTD comparisons in a single view
2. KPI Trend Sheet
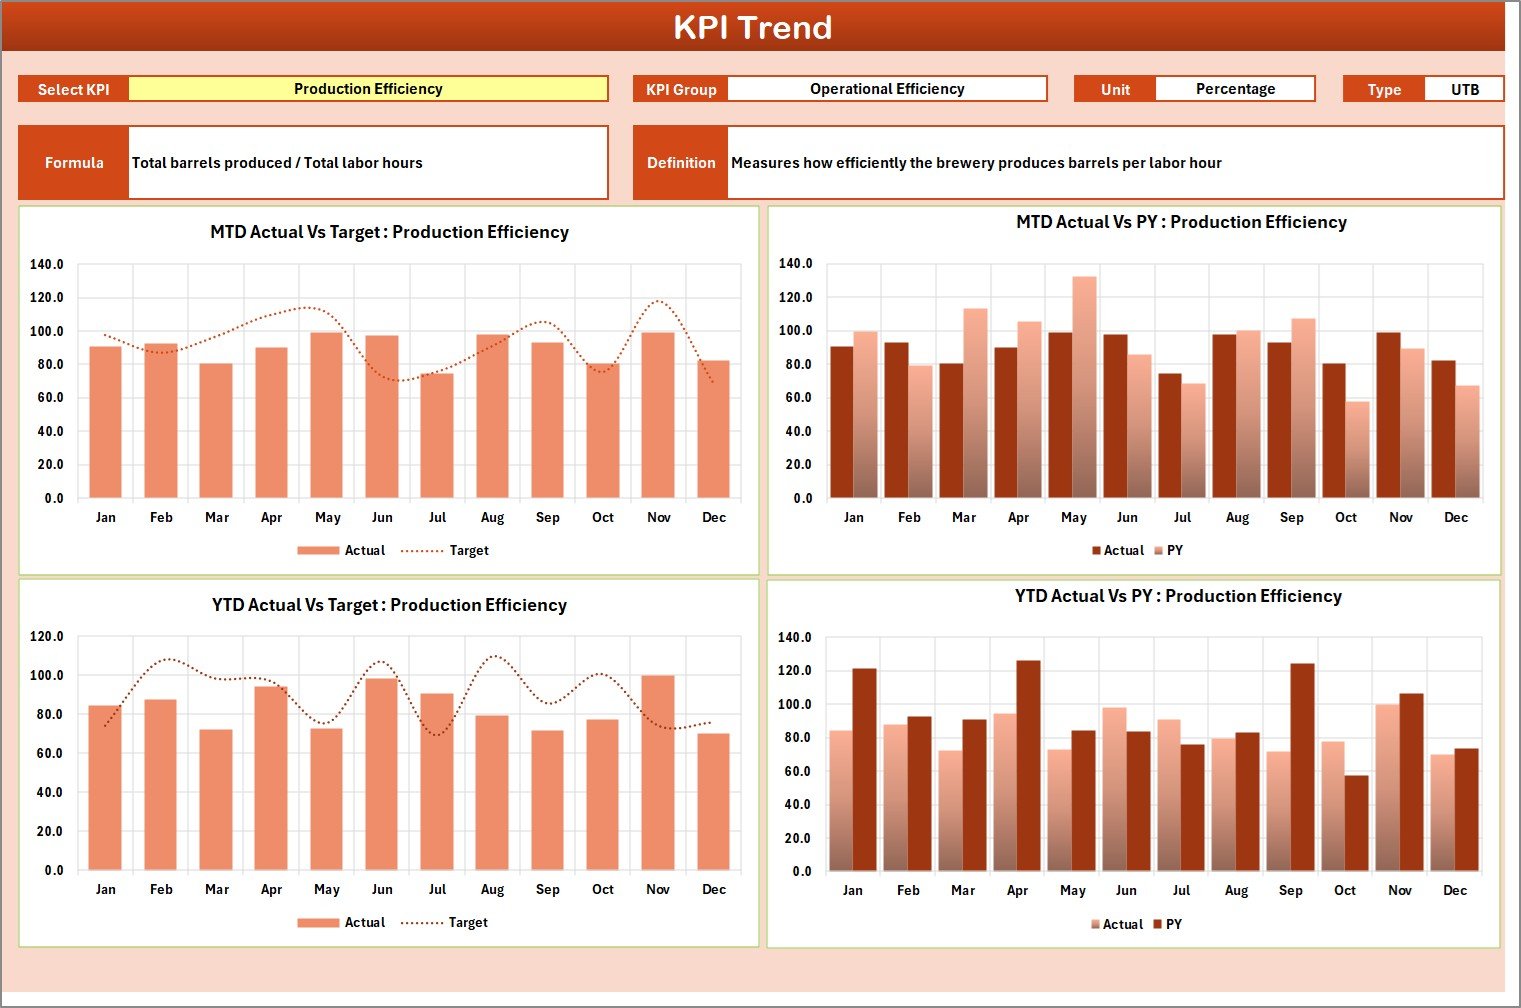
KPI Trend Sheet
Select any KPI from the dropdown on cell C3 to view its detailed trend analysis. The sheet displays the KPI Group, Unit, Type (Lower the Better or Upper the Better), Formula, and Definition. MTD and YTD trend charts show Actual, Target, and Prior Year numbers side by side, helping you identify seasonal patterns and performance gaps across months. This is especially useful for tracking brew cycle efficiency, taproom foot traffic trends, and distribution fill rates over time. If you also track aquaculture KPIs in Excel, the same scorecard structure applies across food production industries.
3. Input Data Sheet
Input Data Sheet
The Input Data sheet is where you enter all KPI data monthly. Record actual values, targets, and prior year metrics for each KPI. The sheet is structured with months as columns and KPIs as rows, making data entry straightforward. As you add new monthly figures, every scorecard view, trend chart, and performance indicator across the entire workbook updates automatically.
4. KPI Definition Sheet
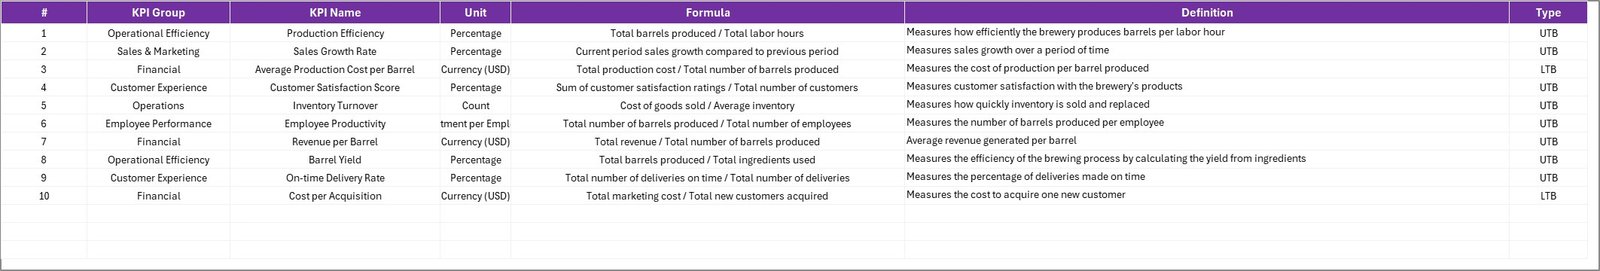
KPI Definition Sheet
In this sheet, enter each KPI Name, KPI Group, Unit, Formula, and KPI Definition. This serves as the master reference that feeds KPI labels, classifications, and metadata across the Scorecard, Trend, and Input Data sheets. You can add, remove, or modify KPIs at any time — the template adapts dynamically through dropdown menus and formula references.
Craft Brewery KPI Scorecard in Excel vs. Google Sheets Scorecard vs. Ekos/Ollie — Feature Comparison
| Feature | Craft Brewery KPI Scorecard in Excel | Google Sheets Scorecard | Ekos / Ollie Brewery Software |
|---|---|---|---|
| Cost | $12.99 one-time | Free (DIY build) | $150–$500/month |
| Platform | Microsoft Excel (desktop + online) | Google Sheets (browser) | Cloud SaaS |
| Setup Time | Under 10 minutes | 4-8 hours (manual build) | 1-2 weeks onboarding |
| Real-time Collaboration | Yes (Excel Online / SharePoint) | Yes (native) | Yes |
| Mobile Access | Yes (Excel mobile app) | Yes (Sheets app) | Yes |
| Customizable KPIs | Fully editable definitions, formulas, groups | Manual formula edits | Limited to platform fields |
| MTD/YTD Trend Charts | Built-in with Actual vs Target vs PY | Manual chart creation | Pre-built reports only |
| Year-1 Cost (5 users) | $12.99 total | $0 (but 8+ hours labor) | $1,800–$6,000 |
| Offline Access | Full offline support | Limited offline mode | No |
For craft breweries that want structured KPI tracking without paying $150+/month for Ekos or Ollie, the Craft Brewery KPI Scorecard in Excel sits in the sweet spot.
Who Should Use This Template
👉 Click here to Purchase the Craft Brewery KPI Scorecard in Excel
Perfect for:
- Craft brewery owners and operations managers tracking 10-30 production and business KPIs monthly
- Brewpub managers who need MTD and YTD performance snapshots without paid brewery management software
- Small-to-mid-size breweries (1-50 employees) that already use Excel for daily operations and reporting
- Brewery consultants preparing standardized performance scorecards across multiple client breweries
- Brewery startups building their first KPI tracking framework before investing in enterprise software
Not a fit if:
- You operate a large-scale production brewery needing real-time IoT sensor integration with fermentation tanks
- Your team requires multi-user concurrent editing with audit trails and role-based access controls
- You need TTB (Alcohol and Tobacco Tax and Trade Bureau) compliance reporting automation built into your tracking system
- You need integrated inventory management with automatic reorder triggers for raw materials
Real-World Use Cases
👉 Click here to Purchase the Craft Brewery KPI Scorecard in Excel
Jake runs a 15-barrel craft brewery in Portland. He uses the Craft Brewery KPI Scorecard in Excel to track batch yield, taproom revenue per barrel, and distributor fill rates across 18 KPIs. Every Monday morning, he selects the current month from the dropdown and reviews which KPIs turned red over the weekend — catching a 12% drop in taproom foot traffic before it became a quarterly problem. The entire setup took him 8 minutes, and he avoided paying $200/month for Ekos.
Maria manages operations at a growing brewpub chain with 3 locations. She uses separate copies of the scorecard for each location, tracking cost-per-barrel, waste percentage, and customer satisfaction scores. The YTD trend charts help her present quarterly performance to investors with clear Actual vs Target vs Prior Year visuals, saving 6 hours of manual PowerPoint creation each month. She pairs this with the Garden Center Dashboard in Excel for tracking their on-site garden supply shop.
Tom is a brewery consultant advising 8 craft breweries in the Pacific Northwest. He deploys the KPI Scorecard template across all his clients, customizing the KPI Definition sheet for each brewery’s focus areas — some emphasize production efficiency while others prioritize taproom revenue metrics. The standardized format lets him benchmark performance across clients and quickly identify which breweries are underperforming on specific metrics during monthly review calls.
Advantages of Craft Brewery KPI Scorecard in Excel
The template eliminates the need for expensive brewery management software while providing structured KPI monitoring. At $12.99 one-time versus $150–$500 per month for Ekos or Ollie, a 5-person brewery team saves $1,787–$5,987 in the first year alone. The scorecard works offline, requires no internet connection during data entry or review, and stores all data locally on your machine or organization’s OneDrive. Setup takes under 10 minutes with no training or onboarding required.
The Upper/Lower the Better logic automatically adjusts performance coloring based on KPI type — a feature that takes hours to configure manually in a blank spreadsheet. The MTD and YTD trend charts provide immediate visual context that raw numbers alone cannot deliver, helping brewery owners spot seasonal patterns, identify declining metrics early, and present professional-looking performance reports to investors, partners, or lenders.
Opportunities for Improvement
👉 Click here to Purchase the Craft Brewery KPI Scorecard in Excel
The template does not include automated data import from point-of-sale systems or brewery management platforms — all data entry is manual. For breweries with 50+ KPIs, the single-page scorecard view may become crowded, though you can extend it by adding rows. The file does not support real-time multi-user editing with conflict resolution (Excel Online handles basic collaboration, but simultaneous edits on the same cell can cause overwrites). There is no built-in TTB reporting module, and breweries needing regulatory compliance automation should consider dedicated brewery software alongside this scorecard.
Best Practices
Update the Input Data sheet on a consistent schedule — weekly or monthly depending on your KPI review cadence. Start with 10-15 core KPIs rather than trying to track everything at once; you can always add more as your tracking matures. Use the KPI Definition sheet to document formulas clearly so that any team member can understand how each metric is calculated. Review the KPI Trend sheet monthly to catch gradual declines that the Scorecard’s point-in-time view might not reveal. Share the file via OneDrive or SharePoint for team access while keeping a local backup. Consider pairing this scorecard with a dedicated KPI Scorecard Template for other departments like finance or HR.
Explore Relevant Templates
🔹 Craft Brewery KPI Scorecard in Excel – The template featured in this article, available for instant download
🔹 Garden Center Dashboard in Excel – Track sales, inventory, and seasonal trends for garden businesses
🔹 Customer Engagement KPI Scorecard in Google Sheets – Monitor customer engagement metrics across channels
🔹 Tutoring Business Dashboard in Excel – Full business analytics for service-based businesses
🔹 Excel Dashboard Templates – Browse all Excel dashboard templates
Frequently Asked Questions
👉 Click here to Purchase the Craft Brewery KPI Scorecard in Excel
What KPIs does the Craft Brewery KPI Scorecard in Excel track?
The Craft Brewery KPI Scorecard in Excel tracks any brewery-specific KPIs you define, such as batch yield, cost per barrel, taproom sales, distribution revenue, defect rate, and waste percentage. You customize all KPI names, groups, and formulas in the KPI Definition sheet — the template supports unlimited KPIs.
Does this scorecard work on Mac and Excel Online?
Yes. The Craft Brewery KPI Scorecard in Excel uses standard formulas and charts with no macros or VBA. It works on Excel for Windows, Excel for Mac, and Excel Online through Microsoft 365 or OneDrive without any compatibility issues.
How long does setup take?
Setup takes under 10 minutes. Enter your KPI definitions in the KPI Definition sheet, replace the sample data in the Input Data sheet with your brewery numbers, and every scorecard view, trend chart, and performance indicator updates automatically.
Can I add more KPIs beyond the sample ones included?
Yes. Add new rows in the KPI Definition sheet and corresponding data rows in the Input Data sheet. The scorecard and trend charts automatically pick up new KPIs through the dropdown menus and conditional formatting rules.
How does this compare to Ekos or Ollie brewery software?
Ekos and Ollie charge $150–$500 per month and require 1-2 weeks of onboarding. The Craft Brewery KPI Scorecard in Excel costs $12.99 one-time, sets up in 10 minutes, and works offline. It covers all core KPI tracking and trend analysis needs for small-to-mid-size breweries.
Can I track both MTD and YTD performance?
Yes. The Scorecard sheet has dropdown menus for selecting Month, MTD (Month-to-Date), or YTD (Year-to-Date) views. The KPI Trend sheet shows separate MTD and YTD trend charts with Actual, Target, and Prior Year lines for any selected KPI.
Is the data secure in this Excel file?
Yes. The file runs entirely on your local machine or your organization’s OneDrive/SharePoint. No data is sent to external servers, and you maintain full control over access, sharing permissions, and backup schedules through your existing file management setup.
About the Author
Built by PK — Microsoft Certified Professional with 15+ years of Excel, Google Sheets, and Power BI experience. Founder of NextGenTemplates, reaching 300K+ subscribers across YouTube channels (@PK-AnExcelExpert, @NextGenTemplates, @NeoTechNavigators). Every template is hand-built and tested before release.
Conclusion
The Craft Brewery KPI Scorecard in Excel gives craft brewery owners, brewpub managers, and brewery consultants a structured, affordable way to track production, sales, and quality KPIs with MTD and YTD trend analysis. Instead of paying $150–$500/month for Ekos or Ollie, you get a complete scorecard system for $12.99 one-time that sets up in under 10 minutes and works on Windows, Mac, and Excel Online.
👉 Click here to Purchase the Craft Brewery KPI Scorecard in Excel
✅ Instant download · One-time payment · No subscription · Lifetime access
🎥 Visit our YouTube channel for step-by-step video tutorials: Youtube.com/@PK-AnExcelExpert