The Marina Dashboard in Power BI tracks 4 headline KPIs across 5 interactive report pages, with 14 pre-built visuals and slicers for vessel type, service type, customer type, and marina section. Setup takes under 10 minutes on free Power BI Desktop, and the .pbix file scales without slowdown on bookings tables up to 1 million rows.
Most independent marinas don’t need another $99-$499/month SaaS subscription — they need a clear answer to “where is our revenue actually coming from, and which docks and services are making money?” The Marina Dashboard in Power BI is built to deliver exactly that, in a format you can edit, extend, and publish to your team in a single afternoon. This blog post walks through every page, the slicer model, the comparison versus paid alternatives, and how marina operators are using it in production today.
👉 Click here to Purchase the Marina Dashboard in Power BI
Key Features of the Marina Dashboard in Power BI
- 5 interactive report pages — Overview, Revenue Trend, Service Analysis, Customer Insights, and Marina Sections — all driven by a single shared data model so slicer selections propagate consistently across pages.
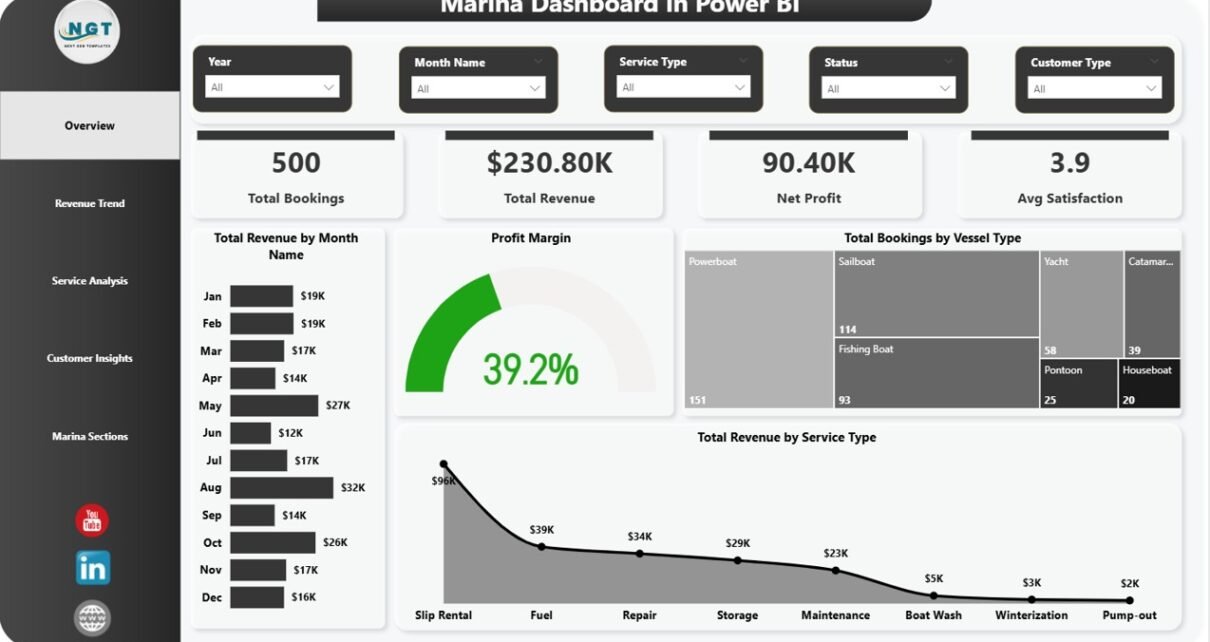
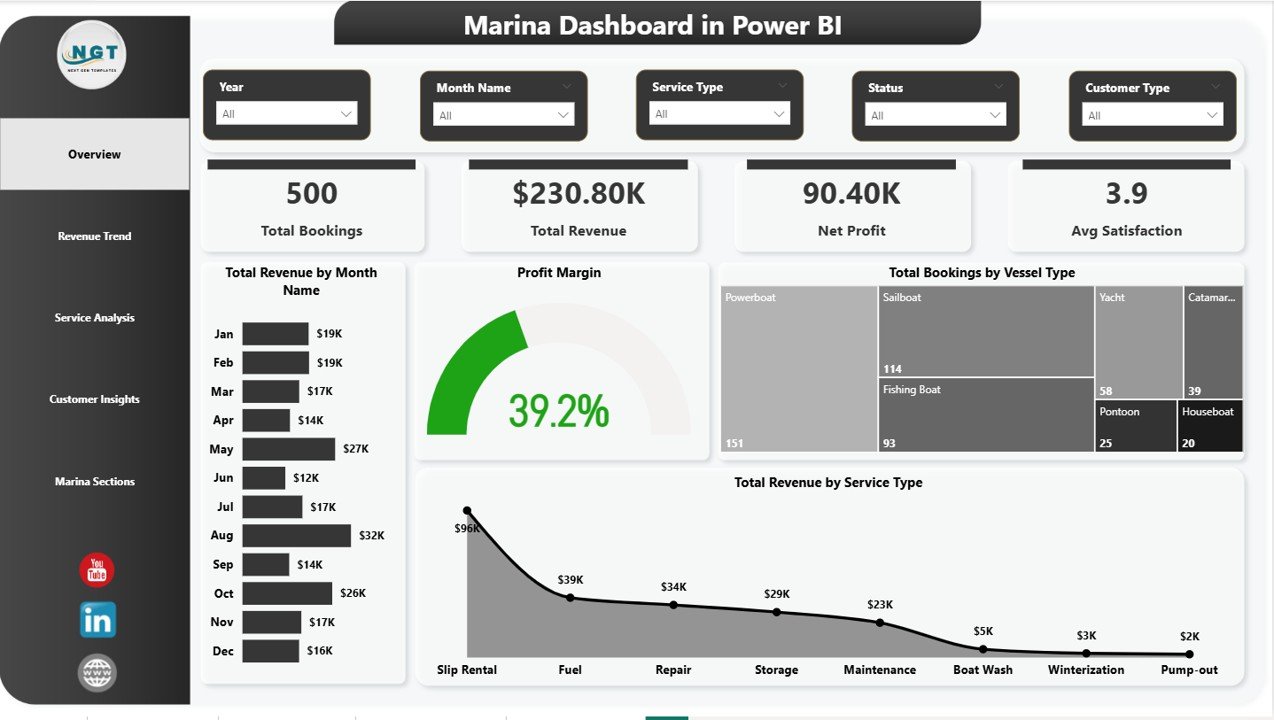
- 4 KPI cards on the Overview page — Total Bookings, Total Revenue, Net Profit, and Average Satisfaction update instantly with every slicer click and every data refresh.
- 14 pre-built visuals across 5 pages — revenue trends, profit margin gauges, cost vs revenue comparisons, service-type profitability, customer-type segmentation, and marina-section performance maps.
- 4-way slicer filtering — Vessel Type, Service Type, Customer Type, and Marina Section. Slicer interactions use Power BI cross-filtering as documented in the official Microsoft Power BI slicer guide.
- Refresh-and-go workflow — point the data source at your bookings export, click Refresh, and every visual rebuilds. No DAX edits, no measure rewrites, no relationship changes required.
- Mobile-ready — publish the .pbix to Power BI Service and access the report on iOS or Android through the free Power BI mobile app.
- Fully editable .pbix with no protected objects — add measures, calculated columns, AI Q&A panels, or replace visuals without restrictions.
Dashboard Pages Explanation
Page 1: Overview Page
The Overview page presents the marina’s complete performance picture on a single canvas. Four KPI cards at the top display Total Bookings, Total Revenue, Net Profit, and Average Satisfaction. Four visuals beneath them cover Total Revenue by Month Name (annual revenue cycle including peak boating season), Profit Margin (overall profitability gauge), Total Bookings by Vessel Type (sailboat vs powerboat vs personal watercraft mix), and Total Revenue by Service Type (mooring, fuel, repair, storage breakdown). The slicers at the top of the page filter the entire canvas in one click.
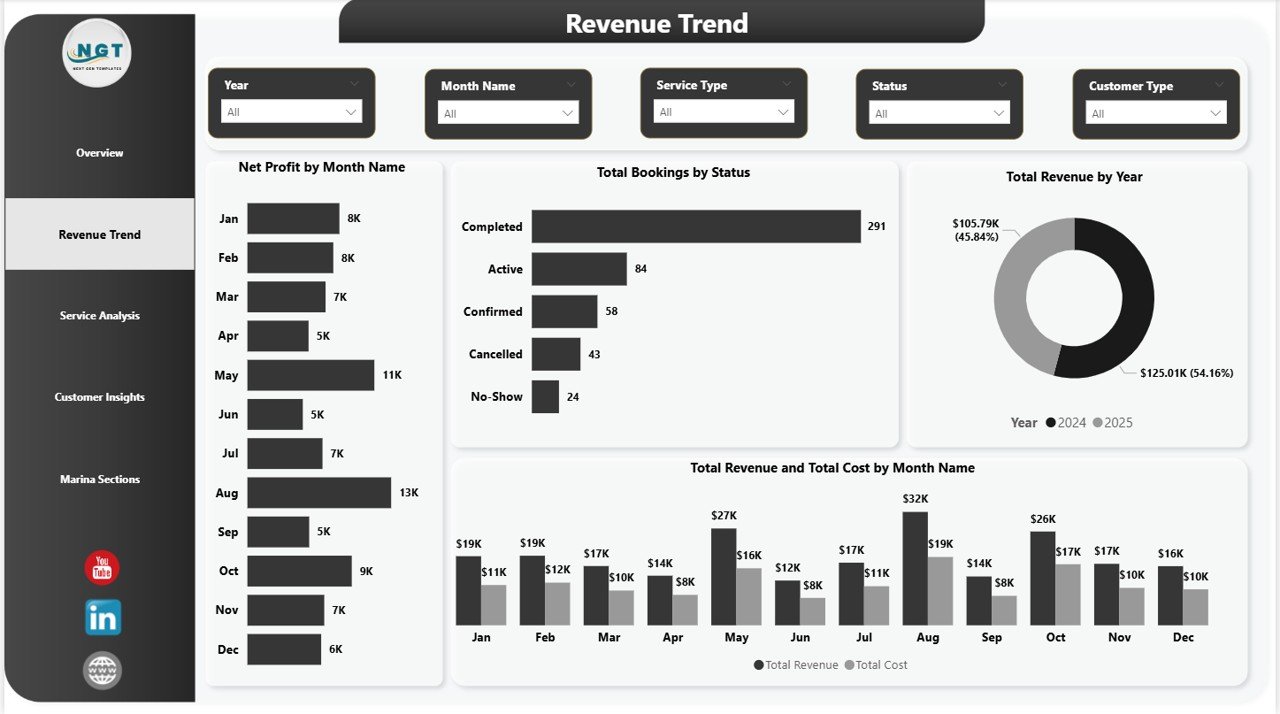
Page 2: Revenue Trend
The Revenue Trend page focuses on financial momentum across time. Visuals include Net Profit by Month Name (bottom-line monthly health), Total Bookings by Status (confirmed vs cancelled vs no-show separation), Total Revenue by Year (multi-year growth trajectory), and Total Revenue and Total Cost by Month Name (margin gap visualization on a combined axis). This page is ideal for monthly board reviews and lender meetings where year-over-year financial trends matter most.
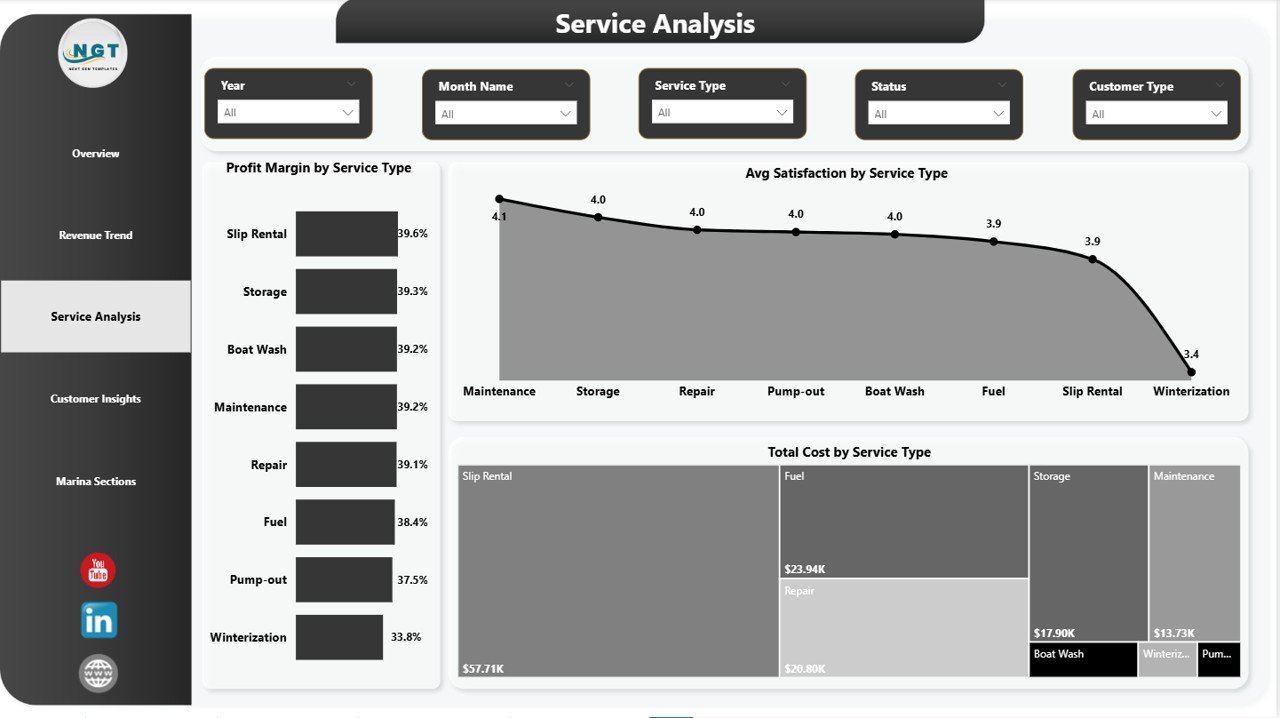
Page 3: Service Analysis
The Service Analysis page breaks down performance by service line. Visuals include Profit Margin by Service Type (which services produce the highest margin), Average Satisfaction by Service Type (which services keep customers happiest), and Total Cost by Service Type (where operating cost is concentrated). Use this page to identify which services — mooring, fuel sales, hull cleaning, winter storage, engine repair — deserve more investment and which to renegotiate or drop.
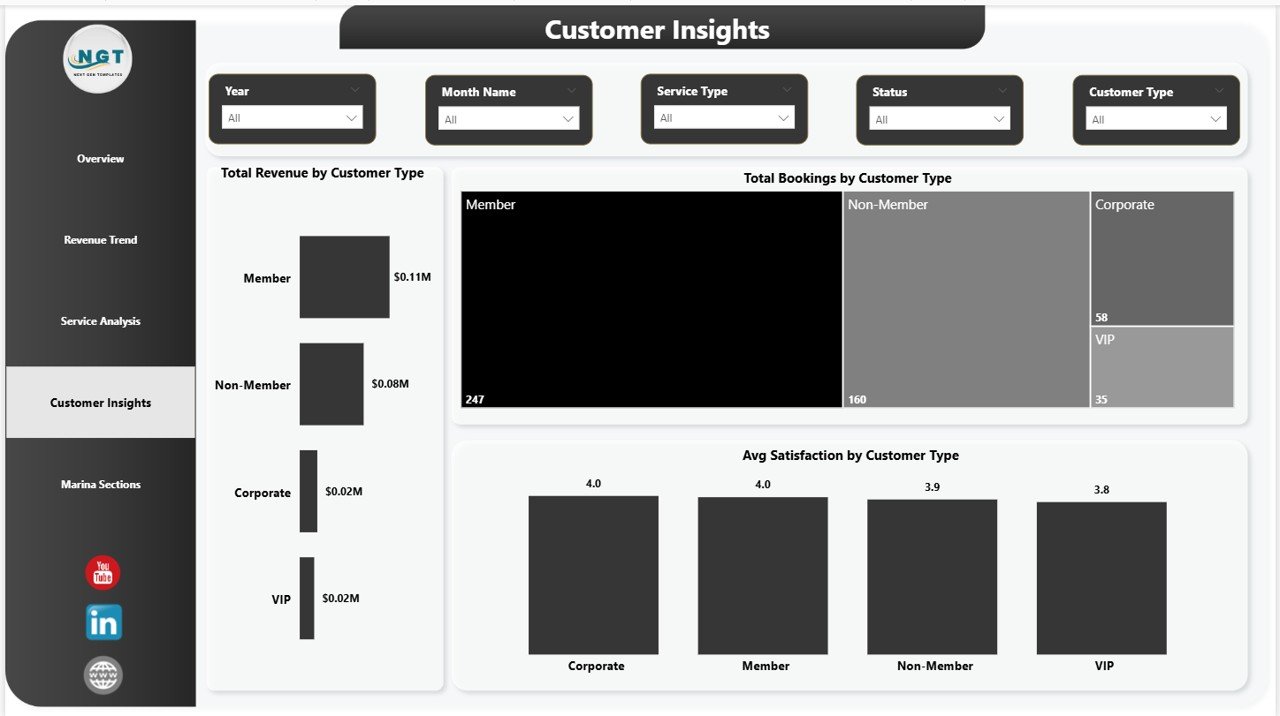
Page 4: Customer Insights
The Customer Insights page profiles the marina’s customer mix. Visuals include Total Revenue by Customer Type (revenue contribution by segment), Total Bookings by Customer Type (volume by segment), and Average Satisfaction by Customer Type (experience consistency across segments). Compare annual members against transient visitors, charter operators against private owners, and see which customer segment delivers the most lifetime value per booking.
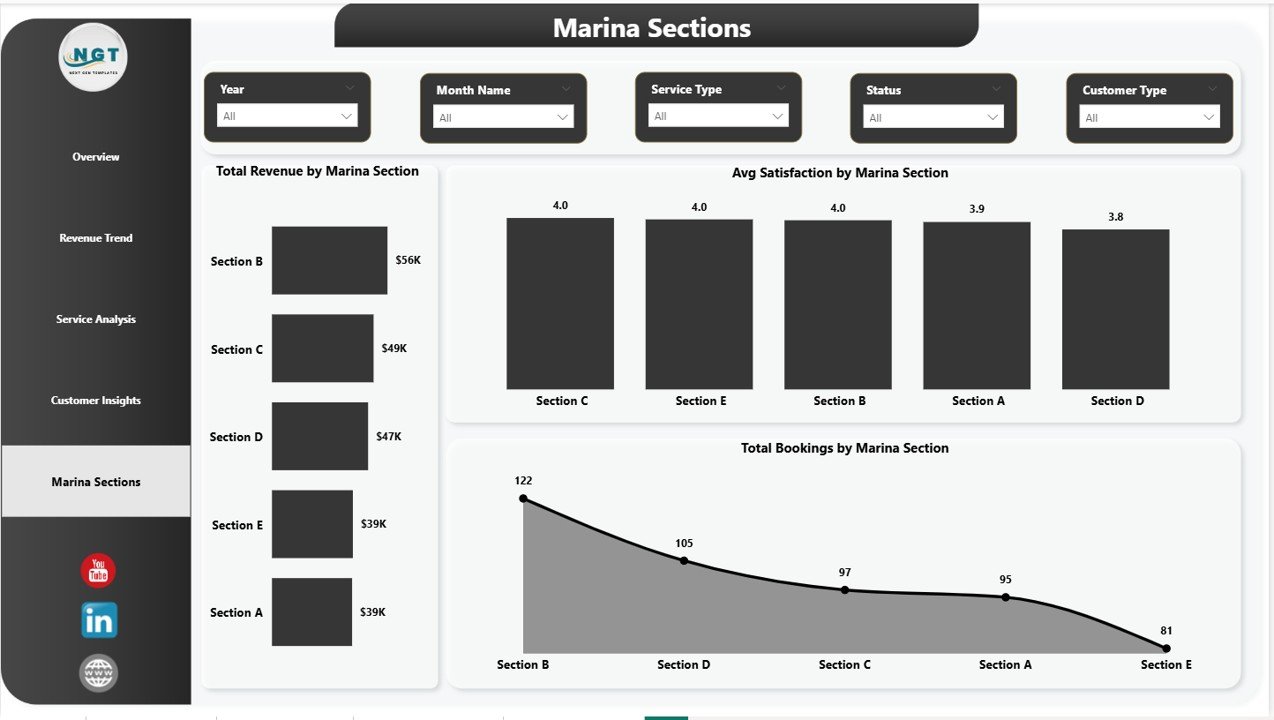
Page 5: Marina Sections
The Marina Sections page maps performance to physical zones in the harbor. Visuals include Total Revenue by Marina Section (which docks earn the most), Average Satisfaction by Marina Section (where customer experience varies), and Total Bookings by Marina Section (which zones run at capacity). Spot which docks are underutilized, where satisfaction is slipping, and where the next renovation budget should land.
Marina Dashboard in Power BI vs. Tableau Hospitality Build vs. DockMaster / Molo — Feature Comparison
| Feature | Marina Dashboard in Power BI | Tableau Hospitality Build | DockMaster / Molo / MarinaOffice SaaS |
|---|---|---|---|
| Cost | $17.99 one-time | $15 – $70 / user / month (Tableau license) | $99 – $499 / month + setup |
| Platform | Power BI Desktop (free) | Tableau Desktop / Cloud | Cloud SaaS (browser + mobile app) |
| Setup time | Under 10 minutes | 1 – 2 hours (data model + visual build) | 1 – 4 weeks onboarding |
| Real-time team collaboration | ✅ Power BI Service publish | ✅ Tableau Cloud | ✅ Native |
| Mobile access | ✅ Power BI mobile app | ✅ Tableau Mobile | ✅ Native app |
| Customizable visuals and DAX | ✅ Fully editable | ✅ Fully editable | ❌ Vendor-controlled |
| 4-way slicer filtering (Vessel, Service, Customer, Section) | ✅ Built-in | Build from scratch | ✅ Built-in filters |
| Year-1 cost at 5 users | $17.99 total | $900 – $4,200 | $1,188 – $5,988 |
| Reservations and POS integration | ❌ Manual data import | ❌ Manual | ✅ Built-in |
For marina operators who want professional Power BI analytics without recurring SaaS or BI license fees, the Marina Dashboard in Power BI sits in the sweet spot.
Who Should Use This Template
Perfect for:
- Independent marina owners and harbor masters managing 30 – 500 slips
- Yacht club managers preparing monthly board reports and member updates
- Boat-yard operators tracking repair-service profitability against mooring income
- Marina franchise regional managers comparing performance across 2 – 10 sites
- Hospitality consultants delivering Power BI dashboards to small marina clients
- BI and hospitality students learning Power BI through a real-world marina dataset
Not a fit if:
- You run a large commercial port that needs real-time AIS vessel tracking and customs integration
- You need built-in credit-card processing or a connected payment gateway
- You want a mobile-first dock-staff app for reservations and on-the-water check-ins (DockMaster or Molo will fit better)
- Your team doesn’t use Power BI Desktop and isn’t comfortable refreshing data sources
Real-World Use Cases
Marcus owns a 120-slip marina on the Chesapeake Bay. Each month he points the Marina Dashboard in Power BI at his Square POS export and dock-software booking log, refreshes, and publishes the Overview and Revenue Trend pages to Power BI Service for his lender review. He used to pay $249/month for a marina-management dashboard he barely used — now he pays $17.99 once and spends 5 minutes a month on reporting. The Revenue Trend page makes lender conversations dramatically faster because the multi-year revenue trajectory is right there on screen.
Helena runs operations for a 4-location yacht-club group in Florida. She duplicates the Marina Dashboard in Power BI for each location, then maintains a master rollup that combines all four data sources. The Marina Sections page is what helps her board decide which site needs the next dock-renovation budget — by showing slip-level revenue and satisfaction side by side, the conversation moves from opinion to data in minutes.
Diego is a fractional CFO consulting for three small marinas. He uses the Customer Insights page to coach owners on shifting their booking mix toward annual members (higher LTV, lower acquisition cost) versus transient day visitors. The template paid for itself the first time he used it in a client engagement, and he now bundles it into his standard onboarding kit for new marina clients.
Advantages of the Marina Dashboard in Power BI
The biggest advantage is the cost-to-value ratio. For $17.99 one-time, a marina operator gets the same kind of board-ready analytics that would otherwise come from a $99-$499/month SaaS subscription or a custom-built Tableau report priced in the thousands. Over a single year, the savings versus DockMaster or Molo land somewhere between $1,180 and $5,970 for a 5-user team — and that’s before factoring in the time saved on onboarding and the flexibility to customize visuals to match how the marina actually runs.
The second advantage is editability. Because every visual is built on a clean DAX model with no protected objects, marina operators and their consultants can add new measures, swap chart types, or layer on AI-driven Q&A panels using Power BI’s built-in features. Replacing the data source with a connection to a SQL warehouse, an Excel file in OneDrive, or a Power Automate flow takes minutes rather than days, and there’s no vendor lock-in to worry about.
Opportunities for Improvement
The Marina Dashboard in Power BI is an analytics layer, not a property-management system. It does not handle reservations, payments, or live channel-manager OTA sync — those workflows still belong in dedicated systems like Molo or DockMaster, and the dashboard imports from their exports. Operators who want a single-pane-of-glass tool for both booking and analytics will find the dashboard incomplete on its own.
The .pbix is also Windows-only at the desktop level (Power BI Desktop does not run natively on Mac). Mac-based users can still publish to Power BI Service and view the report in a browser or on mobile, but authoring changes require either a Windows machine or a virtual Windows environment. For teams that need native Mac authoring, the Marina Dashboard in Excel sibling template is a better fit.
Best Practices
- Keep the column structure stable when replacing the sample dataset. Rename only categorical values (vessel types, service types, customer types, marina sections) — not the column headers themselves — and the visuals will keep rendering without DAX edits.
- Refresh on a fixed cadence. Weekly refreshes work for most marinas; daily refreshes are worth setting up via Power BI Service for harbors that run nightly close-out reports.
- Use the Marina Sections page in renovation planning meetings. Bring slip-level revenue and satisfaction onto the same screen and the dock-investment decision tends to become obvious within minutes.
- Publish to Power BI Service early. The mobile experience for board members and lenders is dramatically better when the report lives in the cloud rather than in an attached .pbix file.
- Pair with the Excel version for teams that prefer pivot-driven workflows. Both templates use compatible data structures, so a single bookings export feeds both.
Explore Relevant Templates
If the Marina Dashboard in Power BI fits your workflow, the following hospitality and service-business templates are worth a look:
- Marina Dashboard in Excel — the same marina KPIs in pivot-driven Excel for Mac users and teams who already live in spreadsheets.
- B&B Dashboard in Power BI — small-property hospitality analytics with booking-source, room-type, and channel-performance views.
- Yoga & Wellness Studio Dashboard in Power BI — service-business analytics with membership, class, and revenue tracking.
- Business Travel Services Dashboard in Power BI — broader hospitality-adjacent travel analytics in Power BI.
- Browse the full Power BI Dashboard Templates library on NextGenTemplates.
Frequently Asked Questions
What KPIs does the Marina Dashboard in Power BI track?
The Marina Dashboard in Power BI tracks 4 headline KPIs — Total Bookings, Total Revenue, Net Profit, and Average Satisfaction — plus 14 supporting visuals across Revenue Trend, Service Analysis, Customer Insights, and Marina Sections pages. Every KPI and visual updates automatically when you point the data source at your own bookings file.
How does the Marina Dashboard in Power BI compare to DockMaster or Molo?
DockMaster and Molo are full marina-management SaaS platforms costing $99 – $499 per month with built-in reservations, payments, and channel sync. The Marina Dashboard in Power BI is a $17.99 one-time analytics layer for operators who already manage bookings elsewhere and just need a customizable, drillable performance dashboard without a subscription.
How long does setup take?
Setup takes under 10 minutes for most marinas. Open the .pbix in Power BI Desktop, point the data source at your booking export through Transform Data → Data Source Settings, click Refresh, and the Marina Dashboard in Power BI is live. No DAX edits, no measure rewrites, no relationship changes.
Do I need a paid Power BI license to use this?
No. The Marina Dashboard in Power BI runs entirely on free Power BI Desktop for Windows. A Power BI Pro license is only required if you want to publish the report to Power BI Service for online team sharing — single-user desktop use is free.
Can I customize the vessel types, service types, and marina sections?
Yes. Add or rename any vessel type, service type, customer type, or marina section directly in your bookings data source, click Refresh, and the Marina Dashboard in Power BI adapts automatically. No DAX edits or model changes are needed for new categories.
Will the Marina Dashboard in Power BI work on Mac?
Power BI Desktop is Windows-only at the authoring level, so the Marina Dashboard in Power BI cannot be edited natively on Mac. However, Mac users can publish from a Windows machine to Power BI Service and then view the report on Mac via browser or the Power BI mobile app. Teams that need native Mac authoring should use the Marina Dashboard in Excel sibling template.
Is the Marina Dashboard in Power BI a one-time purchase?
Yes — $17.99 one-time, no subscription, no per-user fees, and no recurring charges. You receive instant download access, lifetime use rights, and free updates to the same template version.
About the Author
Built by PK — Microsoft Certified Professional with 15+ years of Excel, Google Sheets, and Power BI experience. Founder of NextGenTemplates, reaching 300K+ subscribers across YouTube channels. Every template is hand-built and tested before release.
Conclusion
The Marina Dashboard in Power BI turns a marina’s raw booking export into a board-ready, drill-down analytics report in under 10 minutes — for the price of a single month of any equivalent SaaS tool. The five-page structure mirrors the questions every marina owner actually asks: how is revenue trending, which services are profitable, who are our most valuable customers, and which docks need investment? Power BI’s slicer model handles the filtering, the .pbix is fully editable for further customization, and publishing to Power BI Service unlocks browser and mobile access for the entire team.
👉 Click here to Purchase the Marina Dashboard in Power BI
✅ Instant download · One-time payment · No subscription
🎥 For step-by-step video walkthroughs, visit YouTube.com/@PK-AnExcelExpert.
📅 Last updated: May 2026