The Crisis Management Firms Dashboard in Power BI is a ready-to-use PBIX report for crisis advisory firms, reputation management consultants, corporate affairs teams, legal and compliance advisors, and response operations leaders. Crisis firms often track response cost, contract value, escalated cases, resolution days, crisis type, region, channel, and revenue in separate files. That makes leadership reporting slow exactly when the team needs clarity.
Click here to download the Crisis Management Firms Dashboard in Power BI.
This dashboard solves that reporting problem with 5 Power BI pages, 4 headline KPI cards, multiple slicers, and 15+ visual analysis points. Users can open the file in Power BI Desktop, connect or replace the sample data, refresh the model, and start reviewing crisis response performance across operations, firms, industries, service lines, and time periods. For Power BI setup and refresh guidance, Microsoft provides official documentation for refreshing Power BI Desktop files.

Key Features of Crisis Management Firms Dashboard in Power BI
- 4 KPI cards: Total Response Cost, Total Contract Value, Total Cases, and Escalated Cases.
- 5 report pages: Overview, Firm Analysis, Crisis Types, Response Metrics, and Financials.
- Multiple slicers: filter the dashboard quickly by available dimensions in the model.
- 15+ analytical visuals: review performance by priority, region, month, firm, crisis type, status, industry, channel, quarter, and service line.
- Editable PBIX file: customize visuals, colors, source tables, Power Query steps, and DAX measures.
- Power BI workflow: use Power BI Desktop for edits and Power BI Service for sharing when your Microsoft licensing supports it.
Dashboard Pages Explanation
1. Overview Page
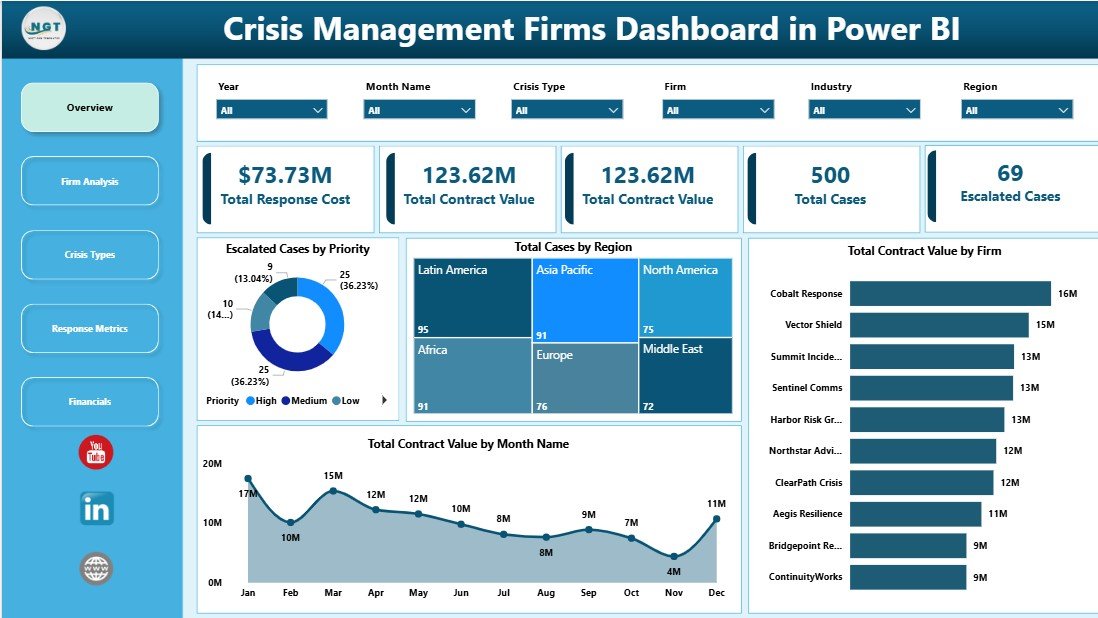
The Overview page is the executive summary for crisis engagement performance. It opens with four KPI cards: Total Response Cost, Total Contract Value, Total Cases, and Escalated Cases. These cards help leaders compare operational cost, commercial value, workload, and escalation pressure before moving into detailed analysis.
Escalated Cases by Priority: This chart shows how escalated cases are distributed across priority levels. It helps crisis leaders see whether urgent and high-priority work is consuming the response team’s attention.
Total Cases by Region: This visual compares case volume across regions. It helps managers identify areas with higher crisis activity and plan staffing or specialist support accordingly.
Total Contract Value by Month Name: This chart shows how contract value changes month by month. It helps firms understand revenue timing, demand seasonality, and high-value periods.
Total Contract Value by Firm: This visual compares firm-level contract value. It is useful for partner reviews, client portfolio analysis, and identifying top-performing advisory teams.
2. Firm Analysis
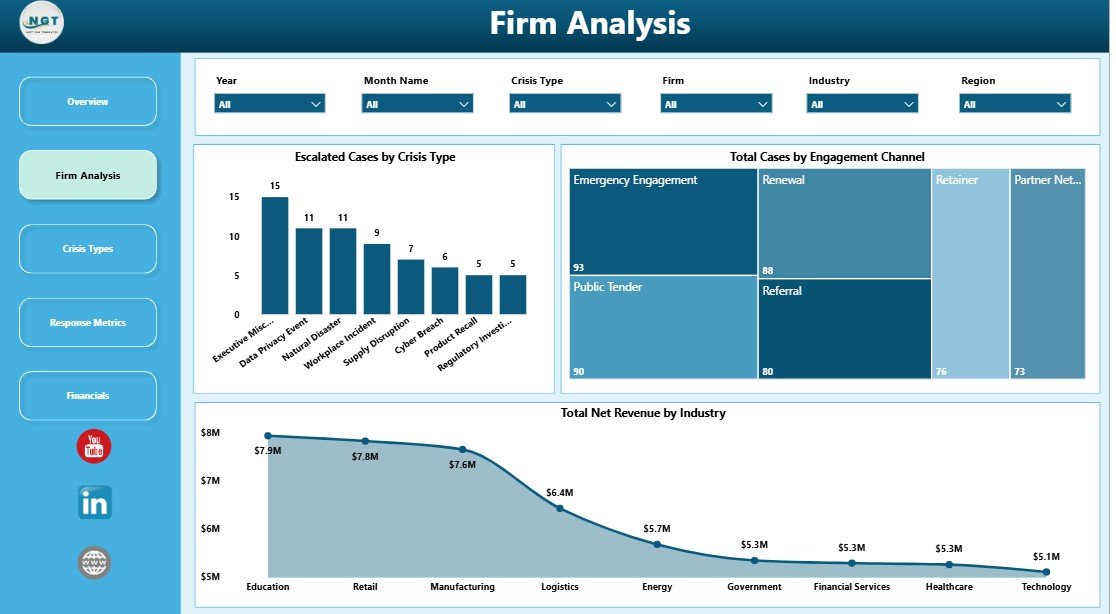
The Firm Analysis page focuses on firm-level workload, engagement channels, crisis categories, and industry revenue. It helps users understand which firms and client segments are driving the most activity and revenue.
Escalated Cases by Crisis Type: This visual shows which crisis categories lead to the most escalations. It helps leaders identify areas where response playbooks, staffing, or escalation rules may need refinement.
Total Cases by Engagement Channel: This chart explains how cases enter the firm, such as retainers, referrals, emergency calls, or advisory requests. It helps marketing, sales, and operations teams understand demand sources.
Total Net Revenue by Industry: This chart compares revenue across industries. It helps partners identify the sectors that generate the strongest commercial return.
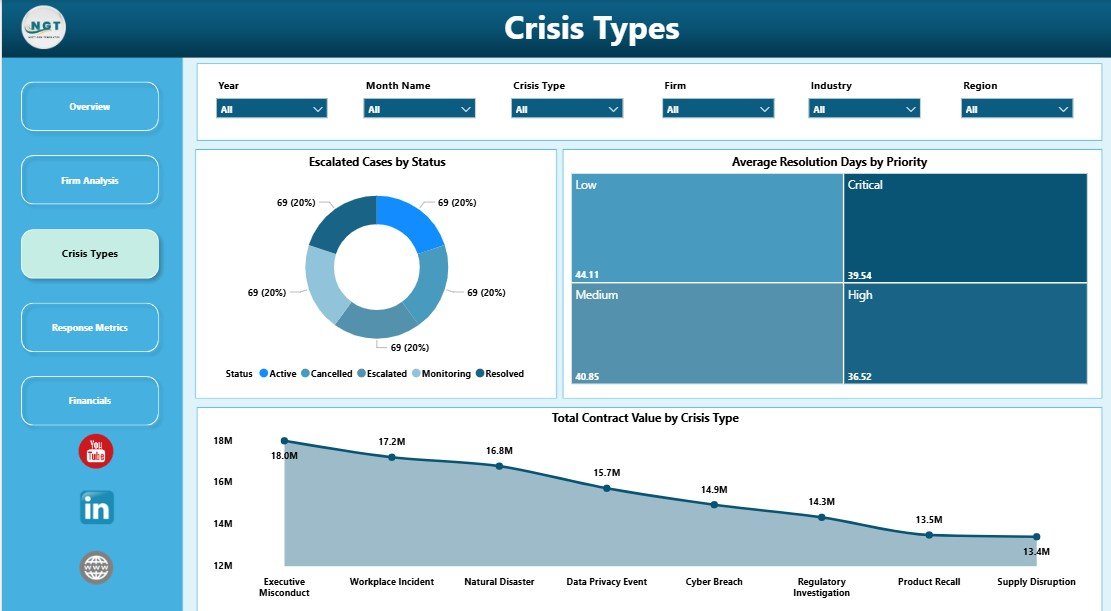
3. Crisis Types
The Crisis Types page helps teams review escalation status, priority-based resolution speed, and contract value by crisis category. It is especially useful for understanding which crisis areas are operationally sensitive and commercially important.
Click here to download the Crisis Management Firms Dashboard in Power BI.
Escalated Cases by Status: This chart separates escalated cases by status. It helps teams quickly see whether escalations are open, closed, pending, or concentrated in a specific workflow stage.
Average Resolution Days by Priority: This visual compares resolution time across priority levels. It helps leaders confirm whether urgent cases are receiving faster turnaround than lower-priority cases.
Total Contract Value by Crisis Type: This chart shows which crisis categories carry the highest contract value. It supports pricing reviews, service-line planning, and specialist resource decisions.
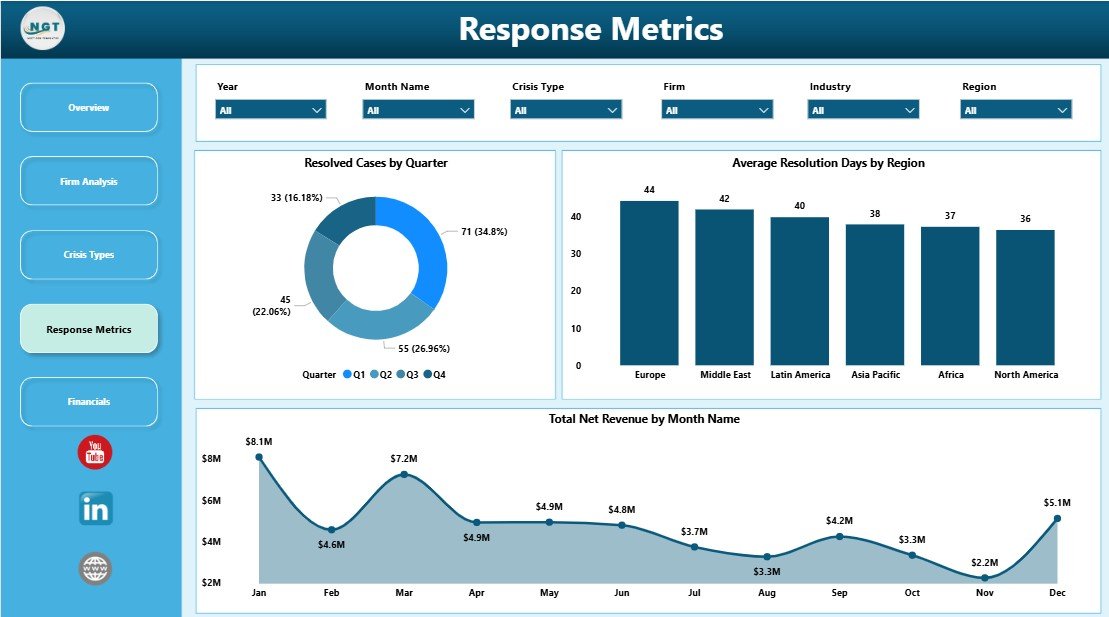
4. Response Metrics
The Response Metrics page brings together resolved cases, regional resolution speed, and monthly net revenue. It is built for operations leaders who need to monitor throughput and service consistency.
Resolved Cases by Quarter: This chart shows quarterly case closure volume. It helps teams understand whether resolution throughput is improving, declining, or becoming seasonal.
Average Resolution Days by Region: This visual compares resolution speed by region. It helps identify local process delays, staffing gaps, or regional workload pressure.
Total Net Revenue by Month Name: This chart tracks monthly net revenue. It helps connect operational performance with revenue movement over time.
Click here to download the Crisis Management Firms Dashboard in Power BI.
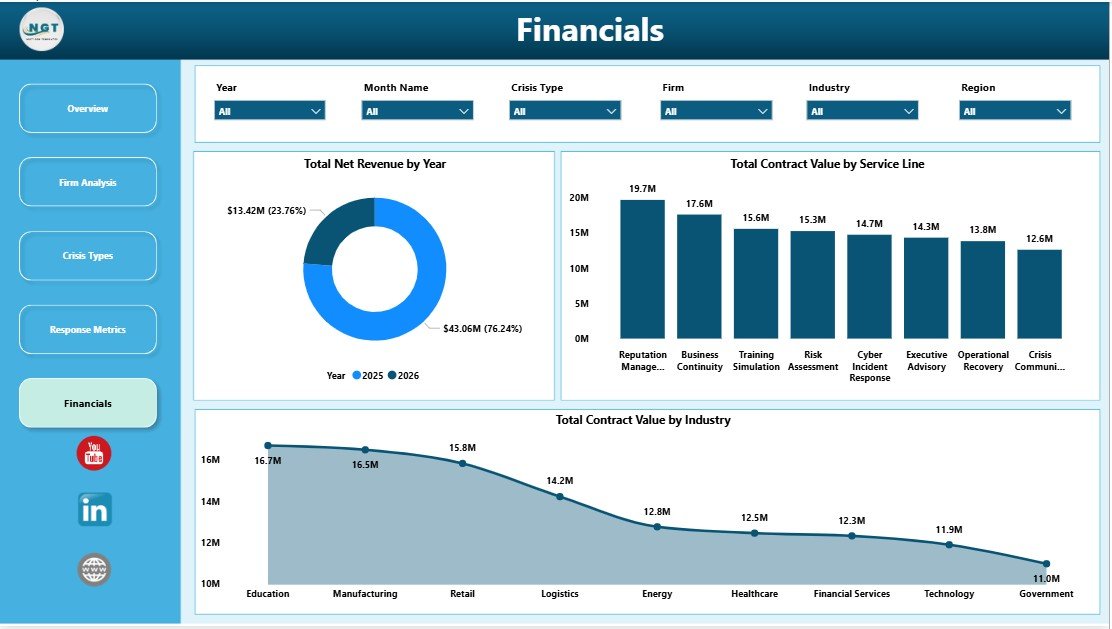
5. Financials
The Financials page gives partners and finance teams a focused view of revenue, contract value, industry contribution, and service-line performance. It is useful for annual reviews, board updates, and commercial planning.
Total Net Revenue by Year: This visual shows annual revenue movement. It helps leadership understand whether crisis advisory revenue is growing, flat, or under pressure.
Total Contract Value by Service Line: This chart compares value across service lines. It helps firms decide where to invest more capacity, marketing, or specialist expertise.
Total Contract Value by Industry: This visual compares industry-level contract value. It helps teams identify which client sectors are the strongest sources of commercial value.
Click here to download the Crisis Management Firms Dashboard in Power BI.
Crisis Management Firms Dashboard in Power BI vs. Tableau vs. Paid CRM/SaaS – Feature Comparison
| Feature | Crisis Management Firms Dashboard in Power BI | Tableau Alternative | Paid CRM/SaaS |
|---|---|---|---|
| Cost | $17.99 one-time | License or custom workbook cost | $50-$300+ per user/month |
| Platform | Power BI Desktop / Power BI Service | Tableau Desktop / Tableau Cloud | Vendor cloud app |
| Setup time | Open PBIX, map data, refresh | Requires Tableau setup | Onboarding and permissions setup |
| Real-time team collaboration | Via Power BI Service when published | Via Tableau Cloud | Usually available by seat |
| Mobile access | Power BI mobile app after publishing | Tableau mobile app | Usually available |
| Customizable fields | Editable model and visuals | Editable with Tableau skills | Limited by vendor configuration |
| Year-1 cost at 5 users | $17.99 plus Microsoft licensing you already use | Can increase with licenses | $3,000-$18,000+ |
| Crisis response analytics | Included across 5 pages | Requires custom setup | Usually requires configuration |
Who Should Use This Template
This template is a strong fit for crisis management firms, reputation management agencies, legal crisis advisors, compliance teams, corporate communications teams, business continuity groups, executive risk offices, and analysts who need a professional Power BI dashboard for crisis engagement reporting.
It is not a full incident management platform. Teams that need secure intake forms, automated notifications, evidence storage, case assignment workflows, or client portals should use this dashboard as the reporting layer alongside their operational systems.
Real-World Use Cases
Olivia manages a crisis advisory practice. She uses the Overview page before weekly leadership meetings to explain response cost, contract value, total cases, and escalated cases.
Rahul leads response operations. He uses the Response Metrics page to compare average resolution days by region and resolved cases by quarter, then reallocates specialist support where delays appear.
Maya owns client success. She uses Firm Analysis to compare engagement channels, crisis types, and net revenue by industry before renewal and account review conversations.
Advantages of Crisis Management Firms Dashboard in Power BI
- It separates crisis reporting into five focused pages instead of one crowded report.
- It gives leaders immediate visibility into response cost, contract value, total cases, and escalated cases.
- It is editable in Power BI Desktop, so analysts can adapt visuals and measures to their own data model.
- It supports better management reviews by connecting operational metrics with financial outcomes.
- It avoids the cost and delay of building a Power BI crisis dashboard from a blank file.
Opportunities for Improvement
The dashboard does not include live API sync, automated case creation, evidence management, secure messaging, or role-based case workflow. Teams should keep sensitive crisis data in secure storage and follow internal data governance rules before publishing reports. Advanced customization may require Power Query, DAX, and Power BI relationship knowledge.
Best Practices
- Use consistent names for firms, regions, industries, crisis types, statuses, priorities, and service lines.
- Validate response cost, contract value, net revenue, and resolution days before sharing executive reports.
- Keep a backup PBIX before changing relationships, DAX measures, or Power Query steps.
- Use the Overview page for leadership summaries and the other pages for deeper operational review.
- Review escalated cases by priority and status before weekly response planning meetings.
- Store crisis data securely and only publish reports to audiences with the right access permissions.
- Click here to download the Crisis Management Firms Dashboard in Power BI.
Explore Relevant Templates
Download the Crisis Management Firms Dashboard in Power BI.
Crisis Management Firms Dashboard in Excel – Excel version for workbook-based reporting.
Emergency Management Dashboard in Power BI – incident and emergency response analytics in Power BI.
Corporate Secretarial Dashboard in Power BI – compliance and governance reporting in Power BI.
Browse the full Power BI Dashboard Templates collection at NextGenTemplates.
Frequently Asked Questions
What KPIs does the Crisis Management Firms Dashboard in Power BI track?
It tracks Total Response Cost, Total Contract Value, Total Cases, and Escalated Cases at the KPI card level, with supporting visuals for priority, region, firm, crisis type, status, industry, service line, quarter, month, and revenue.
Do I need a paid Power BI license?
You can open and edit the PBIX file in Power BI Desktop. Publishing, sharing, and team access through Power BI Service may require Microsoft licensing depending on your setup.
Can I connect my own data?
Yes. You can replace the sample source or connect supported data sources through Power Query, then refresh the report model.
Can I customize the charts and DAX measures?
Yes. The PBIX file is editable, including report pages, visuals, colors, model relationships, columns, and DAX measures.
Is this a crisis management software system?
No. It is a Power BI analytics dashboard template. It does not handle case intake, alerts, evidence storage, workflow automation, or client communication.
Is there an Excel version available?
Yes. The Crisis Management Firms Dashboard in Excel is available for teams that prefer spreadsheet-based reporting.
About the Author
Built by PK – Microsoft Certified Professional with 15+ years of Excel, Google Sheets, and Power BI experience. Founder of NextGenTemplates, reaching 300K+ subscribers across YouTube channels. Every template is hand-built and tested before release.
Conclusion
The Crisis Management Firms Dashboard in Power BI gives crisis advisory teams a clear reporting layer for response cost, contract value, cases, escalations, crisis types, resolution performance, service lines, industries, and revenue. It is practical for firms that already track crisis engagement data and want a polished Power BI report without building every page manually.
Click here to download the Crisis Management Firms Dashboard in Power BI.
Visit our YouTube channel for step-by-step tutorials: Youtube.com/@PK-AnExcelExpert
Last updated: May 22, 2026