Employment Law Services Dashboard in Excel gives employment lawyers, HR compliance consultants, legal advisors, and practice managers a ready workbook for reviewing cases, case value, fees billed, billable hours, closure days, client satisfaction, outcomes, and realization rate. Legal teams often track hundreds of employment matters across stages, practice areas, client types, priorities, regions, and referral sources; without a clear reporting layer, the numbers stay scattered across case lists and billing exports. This Excel dashboard turns that raw case data into 5 visual dashboard pages, a Data Sheet, and a Support Sheet for pivot-driven analysis.
The template is built for Microsoft Excel, which means teams can edit the workbook, replace the sample rows, refresh pivot tables, and use slicers without paying for a monthly analytics system. For basic guidance on refreshing PivotTables and workbook data, Microsoft also provides useful documentation in Microsoft Support.
View the Employment Law Services Dashboard in Excel on NextGenTemplates.
Employment Law Services Dashboard in Excel
Key Features of Employment Law Services Dashboard in Excel
- 5 dashboard pages covering Overview, Case Pipeline, Practice Areas, Consultant View, and Revenue Review.
- 5 KPI cards for Total Cases, Total Case Value, Total Fees Billed, Total Billable Hours, and Avg. Client Satisfaction.
- Case flow reporting by month, year, case stage, priority, outcome, and practice area.
- Billing and value analysis for fees billed, case value, average fee per case, realization rate, and billable hours.
- Interactive slicers that let users filter views quickly by available case fields.
- Editable Data Sheet so users can add their own employment law records in the same format.
- Support Sheet with pivot tables that powers the dashboard dynamically after Refresh All.
Dashboard Pages Explanation
1. Overview Page
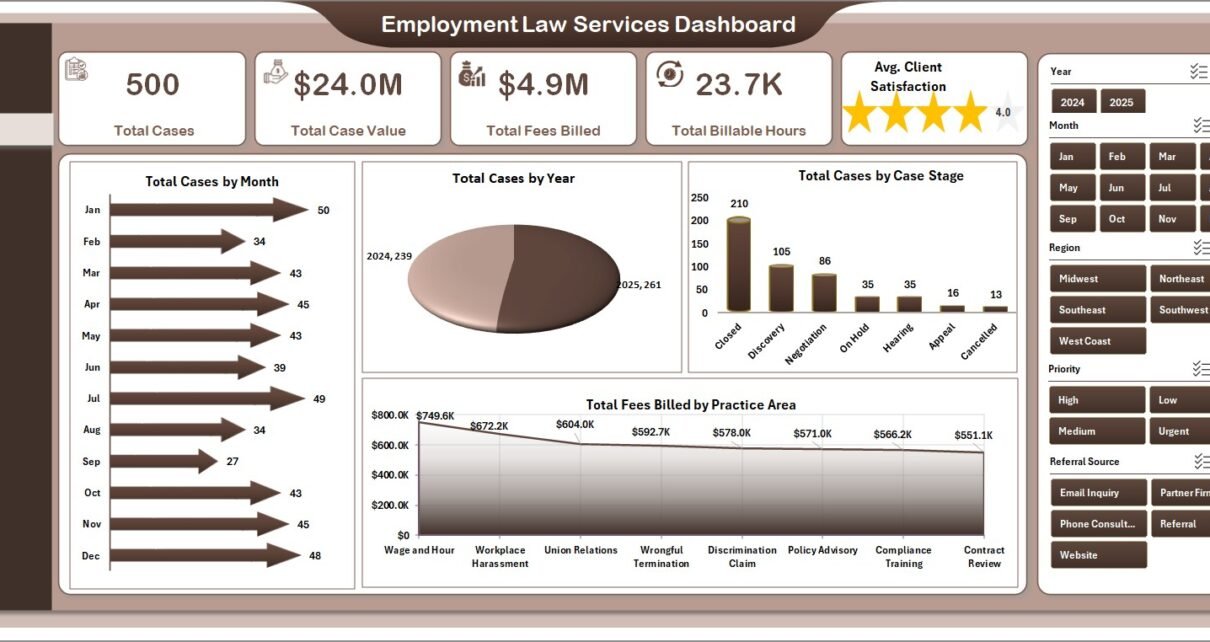
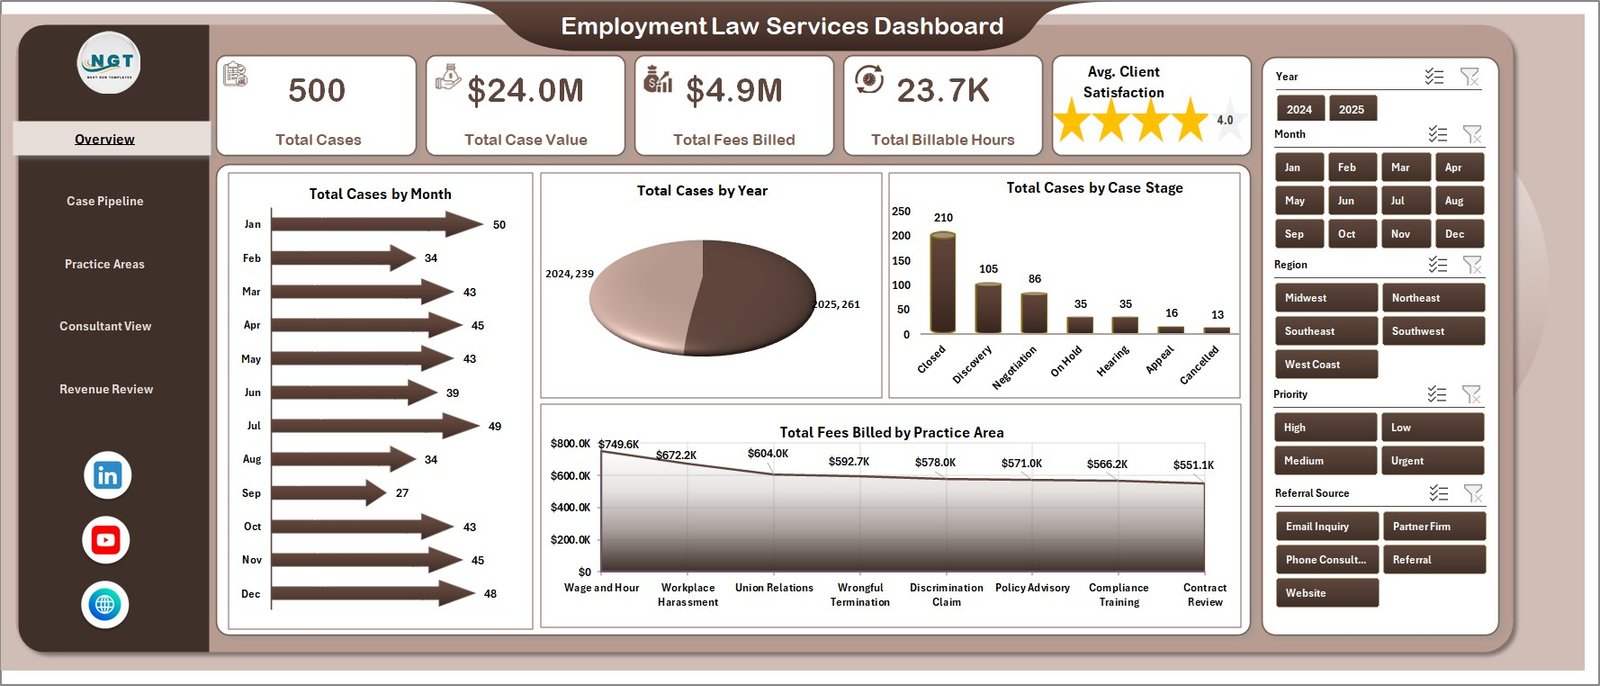
The Overview Page is designed for high-level review. At the top, KPI cards summarize Total Cases, Total Case Value, Total Fees Billed, Total Billable Hours, and Avg. Client Satisfaction, helping partners and managers understand caseload, billing, workload, and service quality from a single screen.
Total Cases by Month: This chart shows monthly case volume and highlights seasonal movement in employment disputes, advisory work, investigations, or compliance matters. It helps managers prepare staffing and review capacity before busy periods.
Total Cases by Year: This visual compares case counts across years. It is useful for seeing whether the employment law service line is growing, stabilizing, or declining over time.
Total Cases by Case Stage: This chart breaks matters by stage, making open work and bottlenecks easier to identify. If one stage has too many matters, managers can investigate whether handoffs or reviews are slowing down.
Total Fees Billed by Practice Area: This chart shows which practice areas generate the most billed fees. It helps leaders compare revenue from advisory, disputes, workplace investigations, compliance reviews, and related employment law services.
Overview Page
2. Case Pipeline
The Case Pipeline page focuses on the movement and workload of employment law matters. Total Cases by Priority shows how many matters require urgent attention, while Total Billable Hours by Case Stage shows where the team is spending time.
Total Case Value by Practice Area helps compare the value of different service categories, and Total Fees Billed by Month makes billing trends visible. Together, these charts help legal leaders discuss staffing, revenue, and active work without manually building reports.
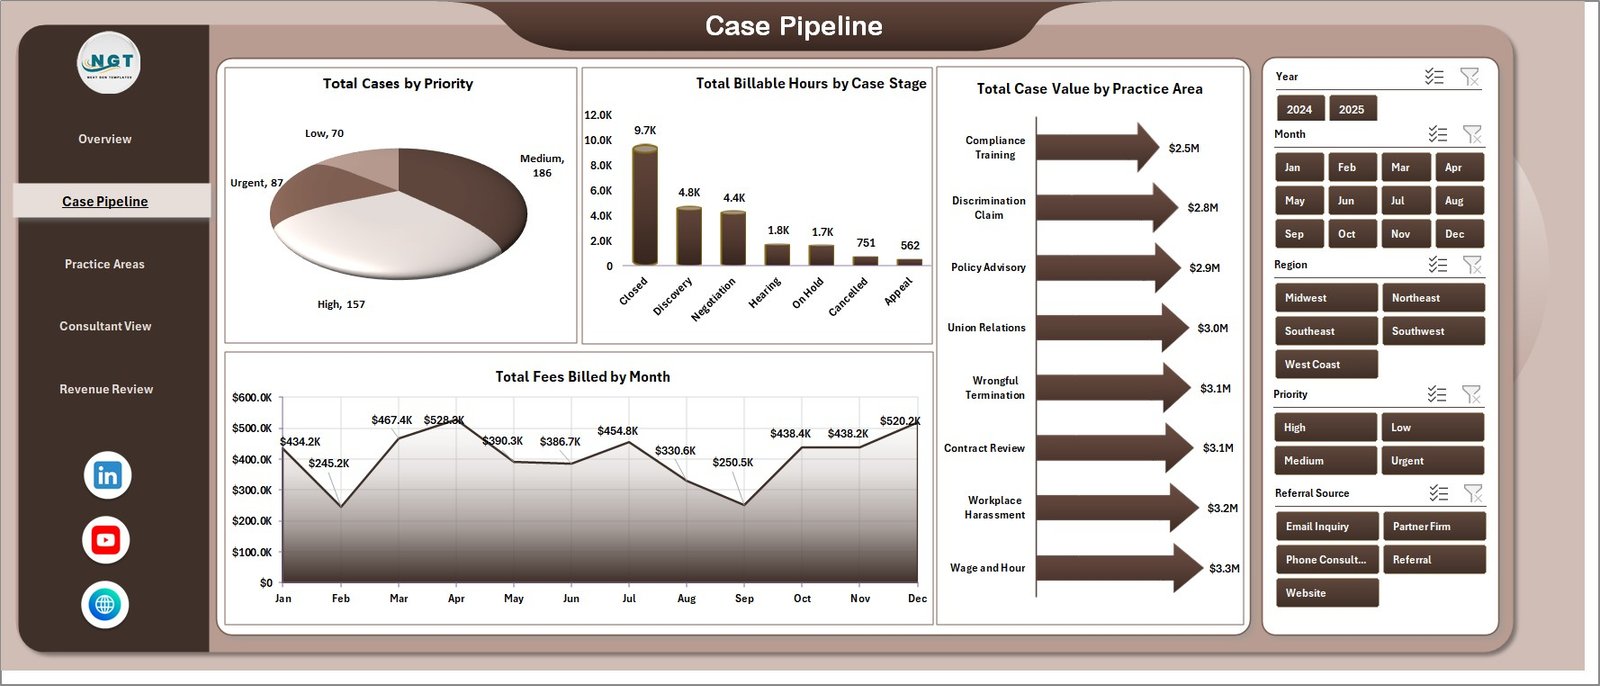
Case Pipeline
3. Practice Areas
The Practice Areas sheet reviews the legal service mix from multiple angles. Total Cases by Client Type shows whether work is concentrated among employers, employees, corporate clients, or other client groups. Total Fees Billed by Region helps compare geographic contribution.
Total Billable Hours by Month shows workload over time, and Total Cases by Outcome helps teams understand how matters are resolved. This page is useful for monthly practice reviews and client-segment planning.
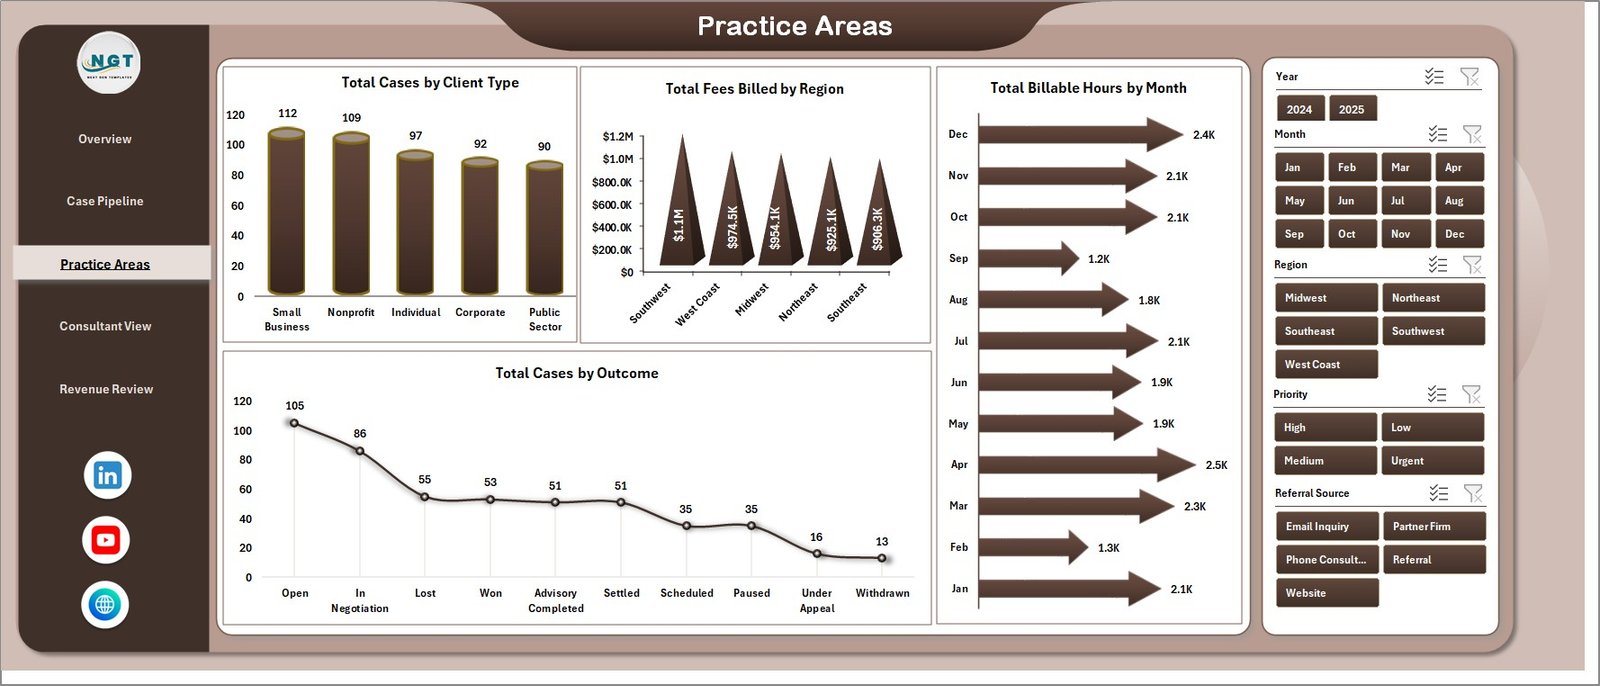
Practice Areas
4. Consultant View
The Consultant View page is helpful for managers who review consultant performance, referral sources, and matter turnaround. Avg. Closure Days by Priority shows whether urgent matters are closing faster or slower than expected. Total Cases by Referral Source shows where work enters the practice.
Total Case Value by Region compares regional opportunity, while Total Fees Billed by Priority connects billing with matter urgency. This page is especially helpful for consultants, coordinators, and senior advisors who need to explain performance drivers.
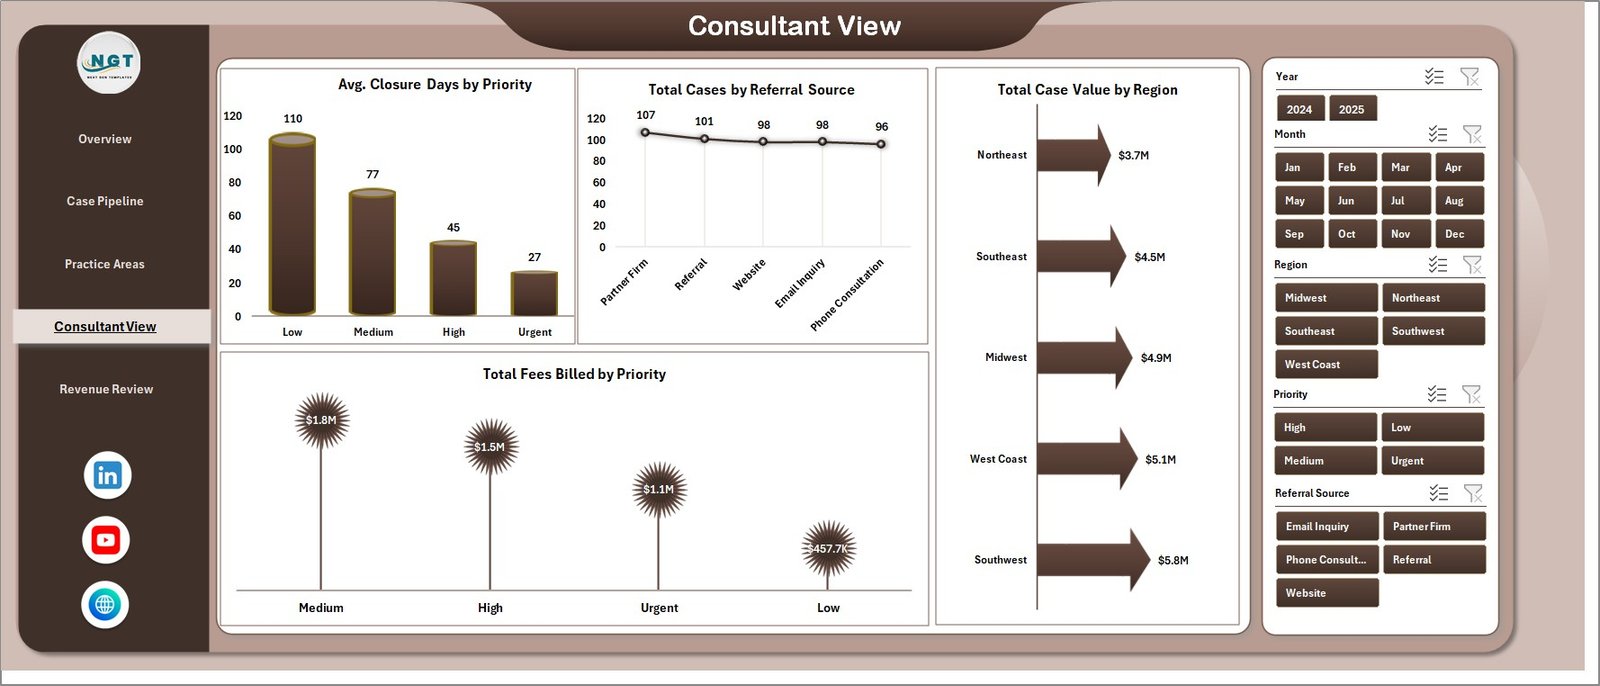
Consultant View
5. Revenue Review
The Revenue Review page gives finance and practice leaders a focused view of billing quality. Avg. Fee per Case by Month shows whether fee levels are changing over time. Total Billable Hours by Year shows whether workload is increasing or decreasing.
Realization Rate % by Client Type helps compare billing efficiency across client groups. This is useful when the team wants to understand where billed fees align with case value and effort.
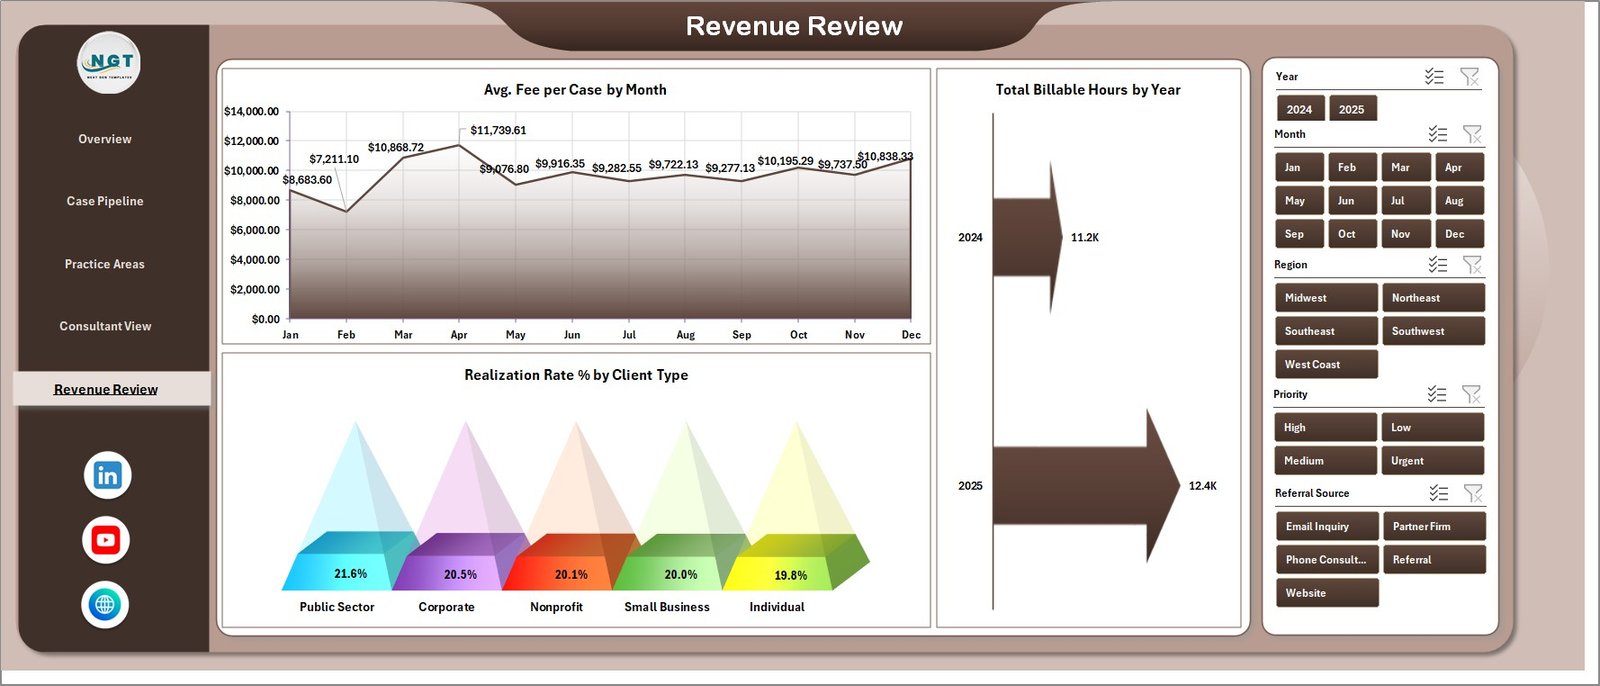
Revenue Review
6. Data Sheet Tab
The Data Sheet is the input area. Users can paste or type their employment law case records into the same structure provided in the workbook. Once the data is updated, the dashboard can be refreshed from Excel’s Data tab.
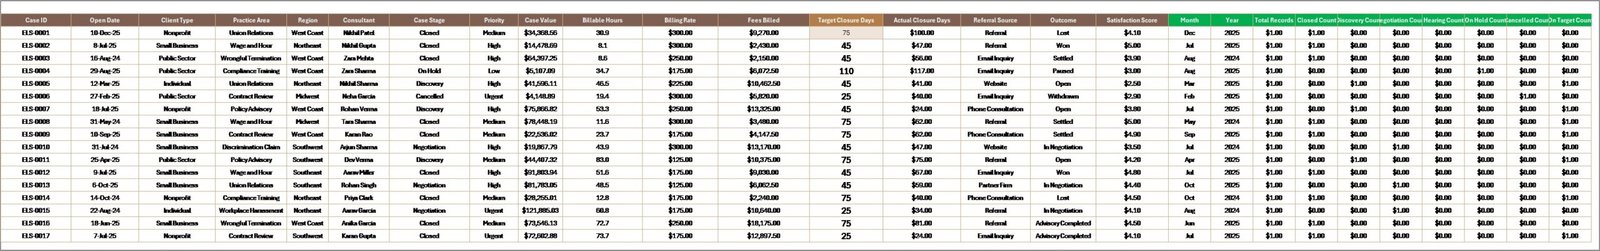
Data Sheet tab
7. Support Sheet
The Support Sheet contains the pivot tables used to create the dashboard pages. After updating the Data Sheet, users can click Refresh All in Excel and let the pivots, cards, and charts update. This sheet can be hidden for a cleaner end-user experience.
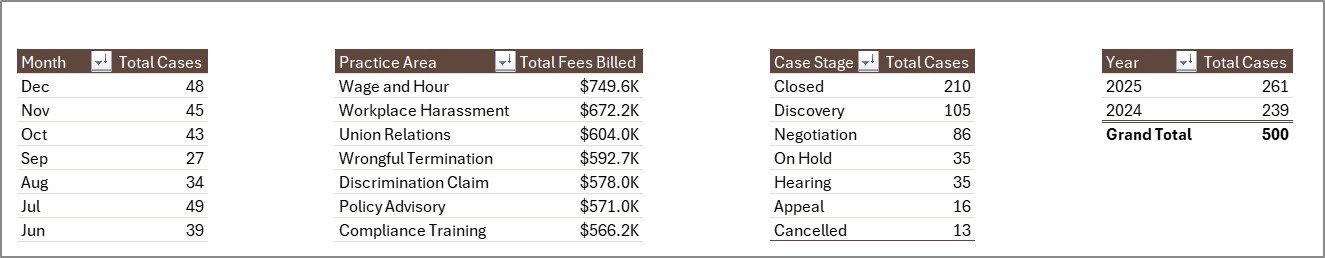
Support sheet tab
Employment Law Services Dashboard in Excel vs. Google Sheets vs. Paid Legal CRM/SaaS – Feature Comparison
| Feature | Employment Law Services Dashboard in Excel | Google Sheets Alternative | Paid Legal CRM/SaaS |
|---|---|---|---|
| Cost | $17.99 one-time | Low software cost, but dashboard must be built | Monthly or annual subscription |
| Platform | Microsoft Excel | Google Sheets in browser | Vendor web app |
| Setup time | Replace data and refresh | Requires manual dashboard setup | Requires onboarding and configuration |
| Real-time collaboration | Possible with OneDrive/SharePoint | Native collaboration | Usually included |
| Mobile access | Excel mobile or shared workbook | Google Sheets app | Vendor app or browser |
| Customizable fields | Fully editable workbook | Fully editable but must be managed carefully | Limited by vendor settings |
| Share with link | Available through Microsoft 365 | Available through Google Drive | Usually requires user accounts |
| Employment law analytics | Built around cases, stages, fees, hours, outcomes, and realization | Manual build required | May require higher-tier reporting |
| Year-1 cost at 5 users | $17.99 plus Excel/Microsoft licensing already used | Low software cost, more build time | Often hundreds or thousands |
Who Should Use This Template
This template is best for employment law practices, legal consultants, HR advisory firms, labor relations teams, in-house legal coordinators, and compliance service providers that already track case records and want a clearer reporting layer.
It is not intended to replace a legal practice management system. If your team needs trust accounting, document automation, secure client portals, court filing automation, e-signatures, or matter-level security workflows, you will still need a dedicated legal platform.
Real-World Use Cases
Anita, employment law partner: Anita reviews Total Case Value, Total Fees Billed, and Realization Rate % before monthly partner meetings. The dashboard gives her a concise view of revenue and workload without asking staff to prepare separate reports.
Marcus, HR legal consultant: Marcus filters by client type and practice area to see which advisory services are growing. He uses the Case Pipeline page to explain where clients need more support.
Priya, practice coordinator: Priya checks Total Cases by Priority and Avg. Closure Days by Priority to follow up on urgent matters and reduce delays.
Advantages of Employment Law Services Dashboard in Excel
- Works in a familiar Excel environment.
- Uses pivot-driven dashboard logic for refreshable analysis.
- Includes multiple slicers for quick filtering.
- Combines operational, billing, and client satisfaction metrics.
- Keeps the Data Sheet separate from dashboard pages for easier updates.
- Can be customized for your own practice areas, regions, stages, and client types.
Opportunities for Improvement
For larger legal teams, the next step could be connecting this workbook to a central database, SharePoint list, or exported billing system. Teams may also add more granular consultant-level analysis, target vs. actual billing, or a monthly PDF reporting workflow. The template gives a strong starting point, while Excel keeps the structure open for customization.
Best Practices
- Keep the same column order in the Data Sheet when adding new case records.
- Refresh all pivots after each data update.
- Use consistent naming for practice areas, stages, regions, outcomes, and client types.
- Hide the Support Sheet after setup if end users only need the dashboard pages.
- Review realization rate and billable hours together, not in isolation.
- Back up the workbook before making structural changes.
Explore Relevant Templates
Explore the Employment Law Services Dashboard in Excel product page, or compare it with related legal analytics templates like Cyber Law Advisory Dashboard in Excel and Cyber Law Advisory Dashboard in Power BI. You can also browse more Excel dashboard templates on NextGenTemplates.
Frequently Asked Questions
What KPIs are included in the Employment Law Services Dashboard in Excel?
The main KPI cards show Total Cases, Total Case Value, Total Fees Billed, Total Billable Hours, and Avg. Client Satisfaction.
How many dashboard pages are included?
The workbook includes 5 dashboard pages: Overview, Case Pipeline, Practice Areas, Consultant View, and Revenue Review. It also includes Data and Support sheets.
Can I use my own case data?
Yes. Add your own records to the Data Sheet in the same format and refresh the workbook.
What is the Support Sheet for?
The Support Sheet contains pivot tables that power the dashboard. You can keep it hidden after setup.
Does this replace legal practice management software?
No. It is an analytics dashboard for Excel, not a full legal CRM, billing system, client portal, or document management platform.
Do I need macros?
No macros are required for the dashboard workflow described here. The main process is updating data and refreshing pivots.
About the Author
Built by PK – Microsoft Certified Professional with 15+ years of Excel, Google Sheets, and Power BI experience. Founder of NextGenTemplates, reaching 300K+ subscribers across YouTube channels. Every template is hand-built and tested before release.
Conclusion
The Employment Law Services Dashboard in Excel is a practical reporting workbook for teams that want clearer visibility into cases, fees, billable hours, outcomes, practice areas, and realization rate without moving to a full legal SaaS platform. It is simple enough for Excel users, structured enough for monthly review, and flexible enough to adapt to your own employment law service data.
Visit YouTube.com/@PKAnExcelExpert for more Excel dashboard tutorials.