Industrial Gas Production Dashboard in Power BI helps plant managers, production supervisors, quality leaders, safety teams, and finance analysts track industrial gas performance from one interactive Power BI report. The dashboard includes 5 report pages, 4 KPI cards, 20 visuals, and multiple slicers for fast filtering. Instead of reviewing revenue, target volume, purity pass rate, energy cost, gross profit, operator performance, and safety incidents in separate files, teams can use one reporting view for production meetings and management reviews.
Industrial gas operations run on tight control of output, purity, cost, and reliability. A small increase in energy cost or a small drop in purity pass rate can change profit and customer service results. This Power BI dashboard is designed to make those signals easier to see, compare, and explain. It is a downloadable Power BI template that can be opened in Power BI Desktop, connected to prepared data, and adjusted for your reporting process. You can learn more about the application on Microsoft Learn’s Power BI Desktop overview.
Click here to view the Industrial Gas Production Dashboard in Power BI.
Key Features of Industrial Gas Production Dashboard in Power BI
- 5 report pages: Overview, Production, Cost Analysis, Quality, and Operations.
- 4 high-level KPI cards: Total Revenue, Total Energy Cost, Total Target Volume, and Gross Profit.
- 20 focused visuals: Review revenue, energy cost, target volume, production volume, gross profit, purity pass rate, safety incidents, shifts, plants, regions, gas types, operators, and production units.
- Multiple slicers: Filter the report quickly during daily, weekly, and monthly production reviews.
- Power BI editing: Change fields, visuals, labels, pages, and colors in Power BI Desktop.
- Management reporting structure: Separate pages support executive overview, production control, cost analysis, quality review, and operational execution.
Dashboard Pages Explanation
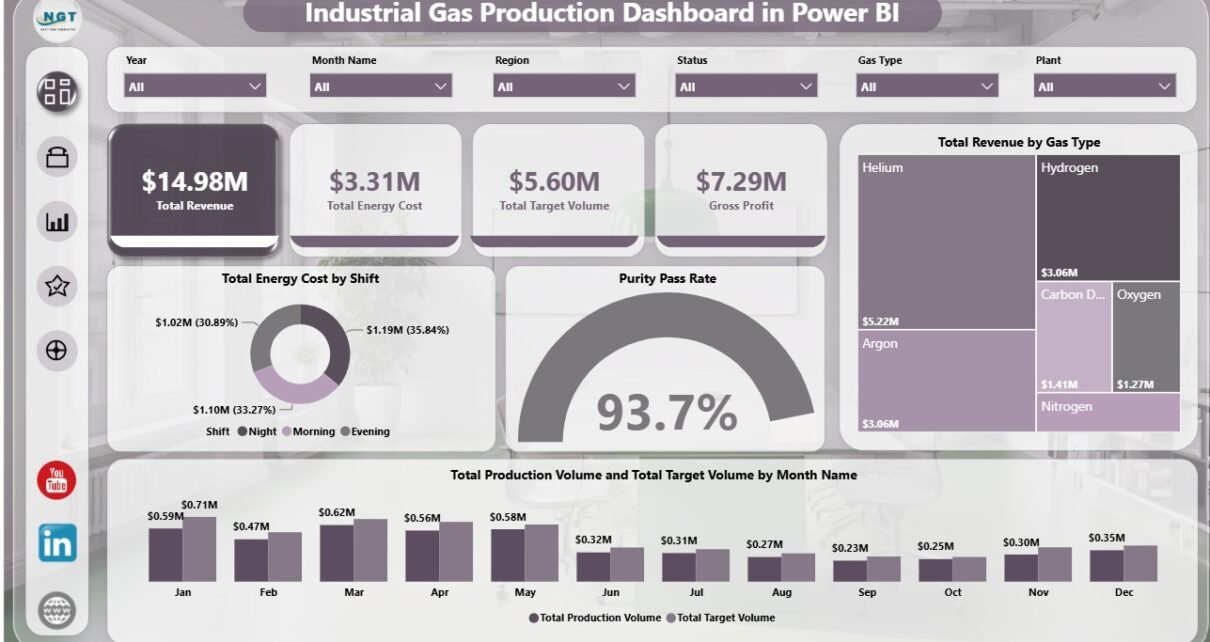
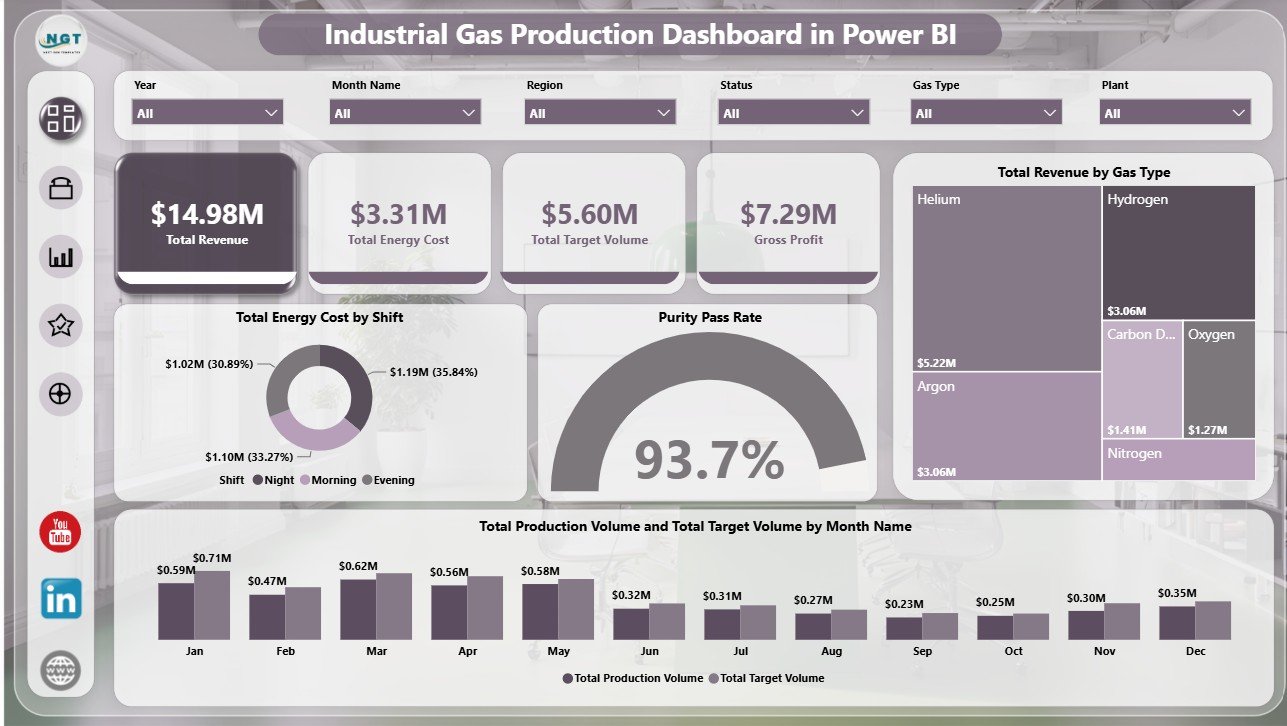
1. Overview Page
The Overview page gives the leadership view of industrial gas production performance. The top KPI cards show Total Revenue, Total Energy Cost, Total Target Volume, and Gross Profit so decision-makers can review financial, cost, and production status quickly.
Total Energy Cost by Shift compares energy cost across shifts. This helps operations teams spot high-cost shifts and review whether scheduling, equipment load, or process behavior needs attention.
Purity Pass Rate by Overall Production connects quality performance with total production. It shows whether output is being achieved while maintaining acceptable purity results.
Total Revenue by Gas Type highlights the gas categories that contribute the most revenue. It is useful for product mix review, commercial planning, and margin discussions.
Total Production Volume and Total Target Volume by Month Name compares actual output with planned targets by month. Managers can use it to identify seasonal movement, production gaps, and months that need follow-up.
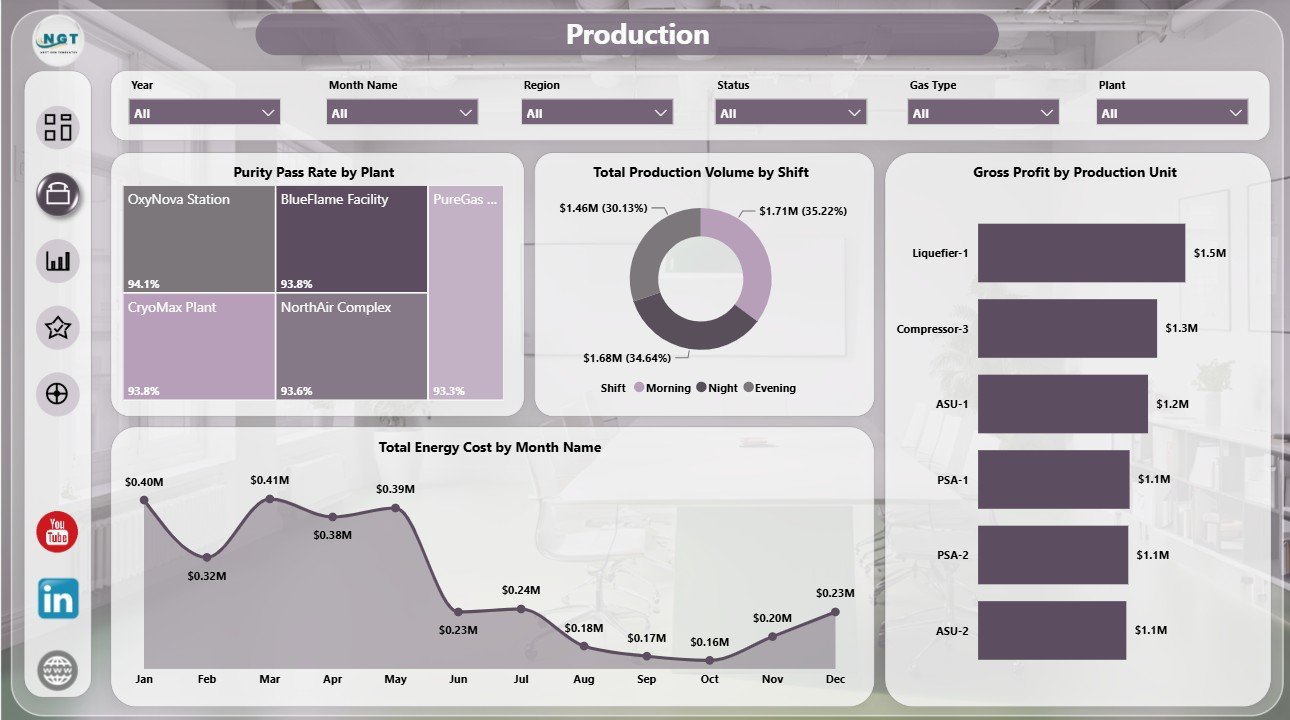
2. Production
The Production page focuses on plant and shift performance. Purity Pass Rate by Plant compares quality pass performance across plants and helps quality leaders identify locations that need deeper review.
Total Production Volume by Shift shows how production volume is distributed across shifts. Gross Profit by Production Unit identifies which units create the strongest margin, and Total Energy Cost by Month Name shows whether energy cost is increasing, decreasing, or stable over time.
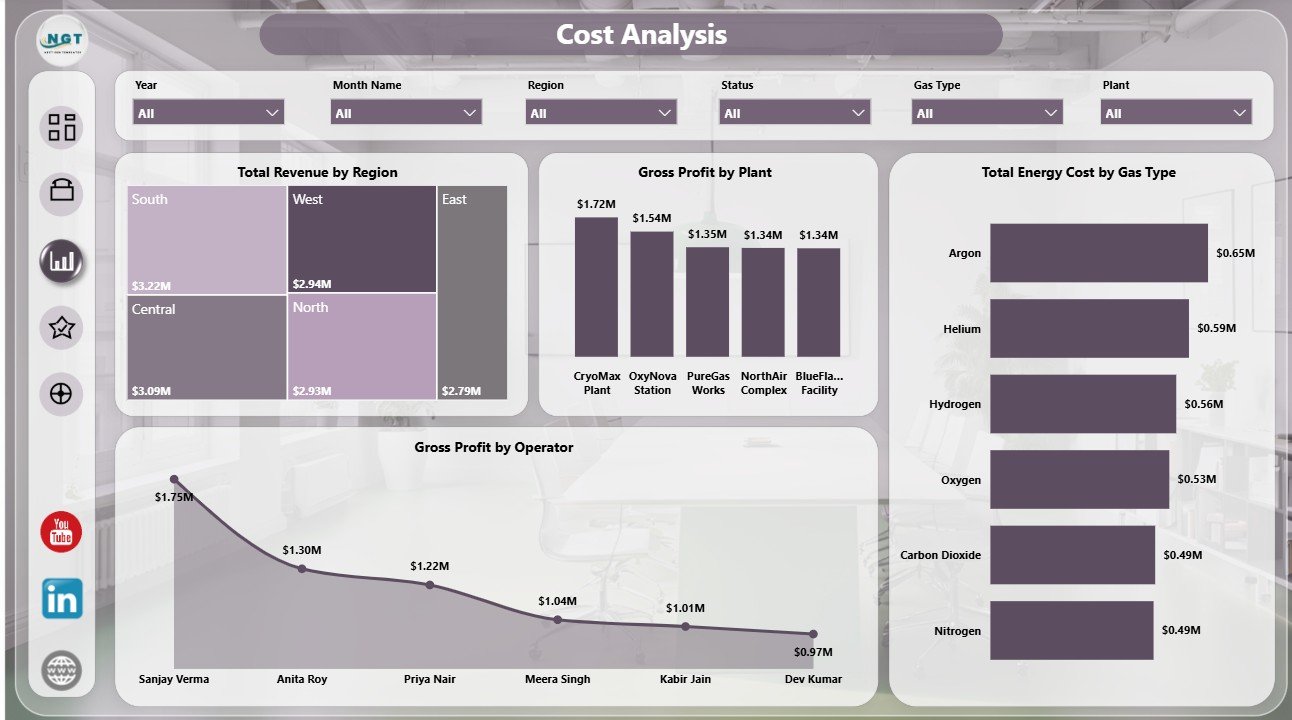
3. Cost Analysis
The Cost Analysis page is built for finance and operations review. Total Revenue by Region compares regional contribution and helps commercial teams see where revenue is concentrated.
Gross Profit by Plant shows plant-level margin performance. Total Energy Cost by Gas Type identifies which gas categories carry higher energy cost, while Gross Profit by Operator adds operator-level visibility for accountability and coaching conversations.
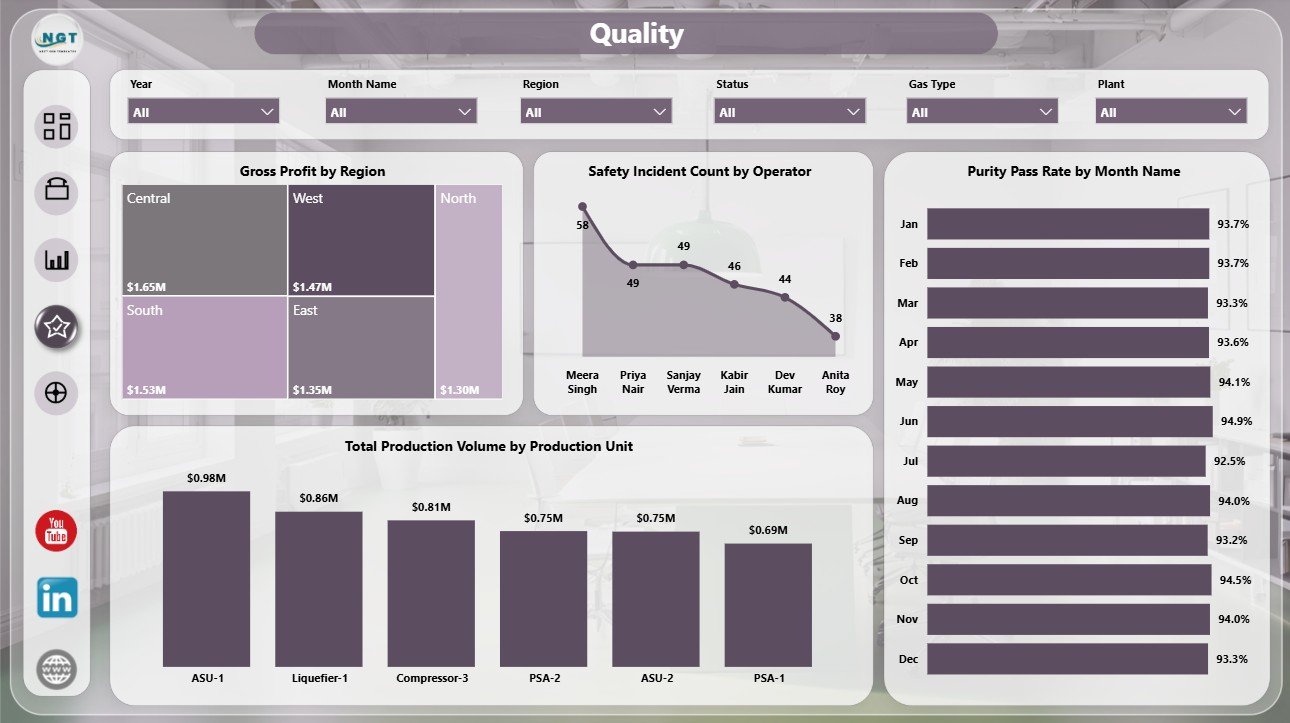
4. Quality
The Quality page combines profit, safety, purity, and production-unit output. Gross Profit by Region helps connect regional business performance with operating results.
Safety Incident Count by Operator supports safety review by showing operator-level incident concentration. Purity Pass Rate by Month Name tracks quality movement over time, and Total Production Volume by Production Unit compares output across production units.
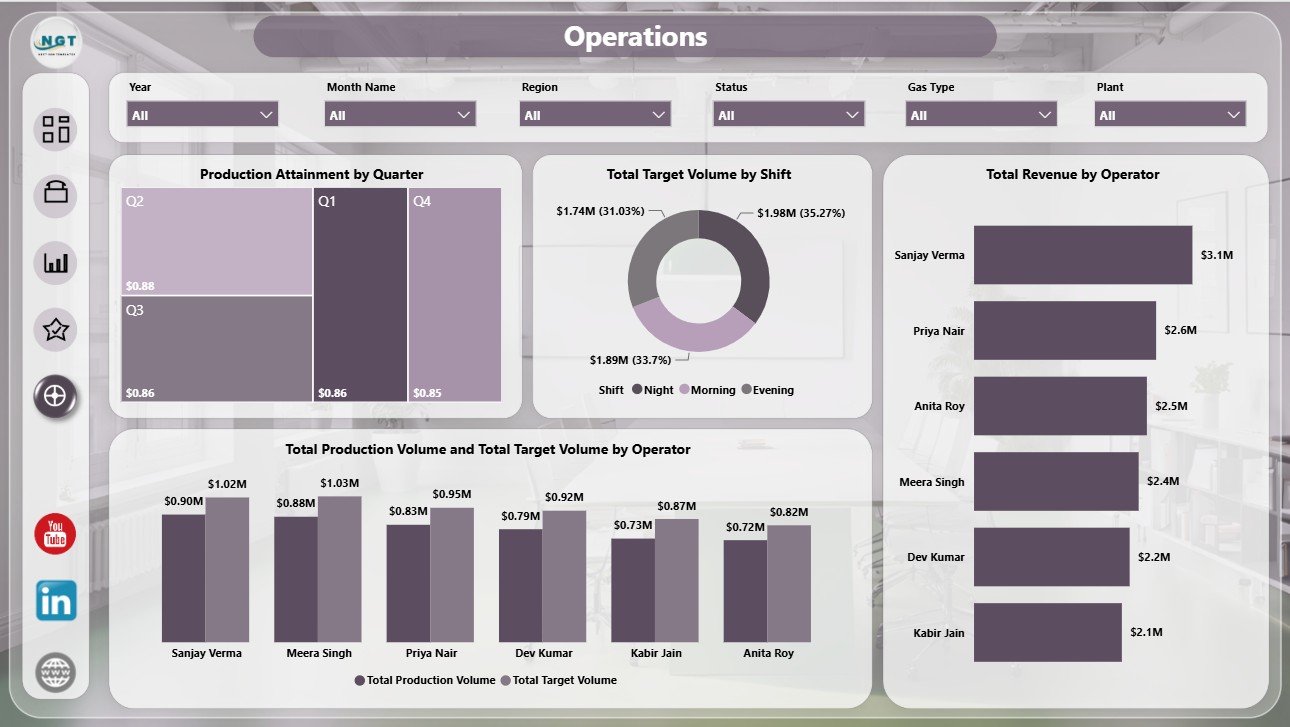
5. Operations
The Operations page supports execution review. Production Attainment by Quarter shows how quarterly performance compares with plan. Total Target Volume by Shift shows planned output across shifts and supports resource discussion.
Total Revenue by Operator adds a commercial view by operator. Total Production Volume and Total Target Volume by Operator compares actual output with target output so managers can see where follow-up is needed.
Industrial Gas Production Dashboard in Power BI vs. Tableau vs. Paid CRM/SaaS – Feature Comparison
| Feature | This Power BI Dashboard | Tableau Alternative | Paid Operations SaaS |
|---|---|---|---|
| Cost | $17.99 one-time template | Requires Tableau license | Monthly or annual subscription |
| Platform | Power BI Desktop and Power BI Service | Tableau Desktop or Tableau Cloud | Vendor cloud system |
| Setup time | Open PBIX and replace or connect data | Build workbook and model | Implementation and configuration |
| Real-time team collaboration | Possible through Power BI Service | Possible through Tableau Cloud | Usually included |
| Mobile access | Available after publishing | Available after publishing | Usually included |
| Customizable fields | Editable model and report visuals | Editable with Tableau skills | Depends on plan and permissions |
| Share with link | Possible with Power BI permissions | Possible with Tableau permissions | Usually role controlled |
| Year-1 cost at 5 users | $17.99 plus existing Power BI licensing | Often much higher | Often hundreds or thousands |
| Industrial gas metrics | Revenue, energy, targets, production, purity, safety, shifts, plants, operators, regions, and gas types | Must be configured | Depends on vendor module |
Who Should Use This Template
This template is useful for industrial gas producers, oxygen and nitrogen plants, air separation units, specialty gas companies, production supervisors, plant managers, operations analysts, finance analysts, quality leaders, and safety managers. It works best when the team already has structured data and wants a clear Power BI reporting layer.
It is not a plant control system, SCADA replacement, MES replacement, ERP transaction tool, tank telemetry system, or dispatch planning system. Use it for analysis and reporting after your operational data has been collected and prepared.
Real-World Use Cases
Amit, Plant Manager: uses the Overview and Operations pages before weekly meetings to check production volume, target volume, shift performance, and quarterly attainment.
Priya, Quality Lead: reviews the Production and Quality pages to monitor purity pass rate by plant, purity trend by month, and safety incident concentration by operator.
Daniel, Finance Analyst: uses the Cost Analysis page to compare revenue by region, gross profit by plant, energy cost by gas type, and gross profit by operator.
Advantages of Industrial Gas Production Dashboard in Power BI
- It brings production, cost, quality, safety, and operator metrics into one report.
- It gives leadership a fast overview without rebuilding visuals each month.
- It supports drill-style review through separate pages for production, cost, quality, and operations.
- It can be customized in Power BI Desktop for local terminology and data sources.
- It is a one-time template purchase, not a recurring software subscription from NextGenTemplates.
Opportunities for Improvement
The dashboard depends on the quality of the source data. If your production records have missing plant names, inconsistent gas type labels, or incomplete shift information, the report will need data cleanup first. Larger teams may also want to connect the PBIX to a governed data source, create scheduled refresh in Power BI Service, and define role-level access for sensitive financial or operator-level information.
Best Practices
- Keep plant, gas type, operator, shift, region, and production unit names consistent.
- Validate Total Revenue, Total Energy Cost, Total Target Volume, and Gross Profit before presenting the report.
- Refresh the report on a fixed daily, weekly, or monthly schedule.
- Use slicers during meetings instead of creating separate report copies for each audience.
- Document calculation definitions so production, finance, and quality teams use the same KPI language.
Explore Relevant Templates
You may also like Industrial Gas Production Dashboard in Excel, Rubber Industry Dashboard in Power BI, and Footwear Manufacturing Dashboard in Excel. You can browse more templates in the Power BI Dashboard category.
Frequently Asked Questions
What does the Industrial Gas Production Dashboard in Power BI track?
It tracks revenue, energy cost, target volume, gross profit, production volume, purity pass rate, safety incidents, shifts, plants, regions, gas types, operators, and production units.
How many pages are included?
The report includes 5 pages: Overview, Production, Cost Analysis, Quality, and Operations.
Do I need Power BI Desktop?
Yes. The dashboard is designed as a Power BI file, so you should open and edit it in Power BI Desktop.
Can I connect my own data?
Yes. You can replace or connect the sample data with your own industrial gas production data and refresh the report.
Can I customize the visuals?
Yes. You can edit fields, chart types, colors, labels, and page layouts in Power BI Desktop.
Is this a subscription product?
No. It is a downloadable template sold as a one-time purchase on NextGenTemplates.
About the Author
Built by PK – Microsoft Certified Professional with 15+ years of Excel, Google Sheets, and Power BI experience. Founder of NextGenTemplates, reaching 300K+ subscribers across YouTube channels. Every template is hand-built and tested before release.
Conclusion
The Industrial Gas Production Dashboard in Power BI gives industrial gas teams a practical way to review production output, target volume, revenue, energy cost, gross profit, purity, safety, shifts, plants, operators, and regions from one report. It is especially useful for teams that want a ready Power BI structure instead of starting from a blank canvas.
Visit our YouTube channel to learn step-by-step Excel, Power BI, and dashboard tutorials: Youtube.com/@PKAnExcelExpert.