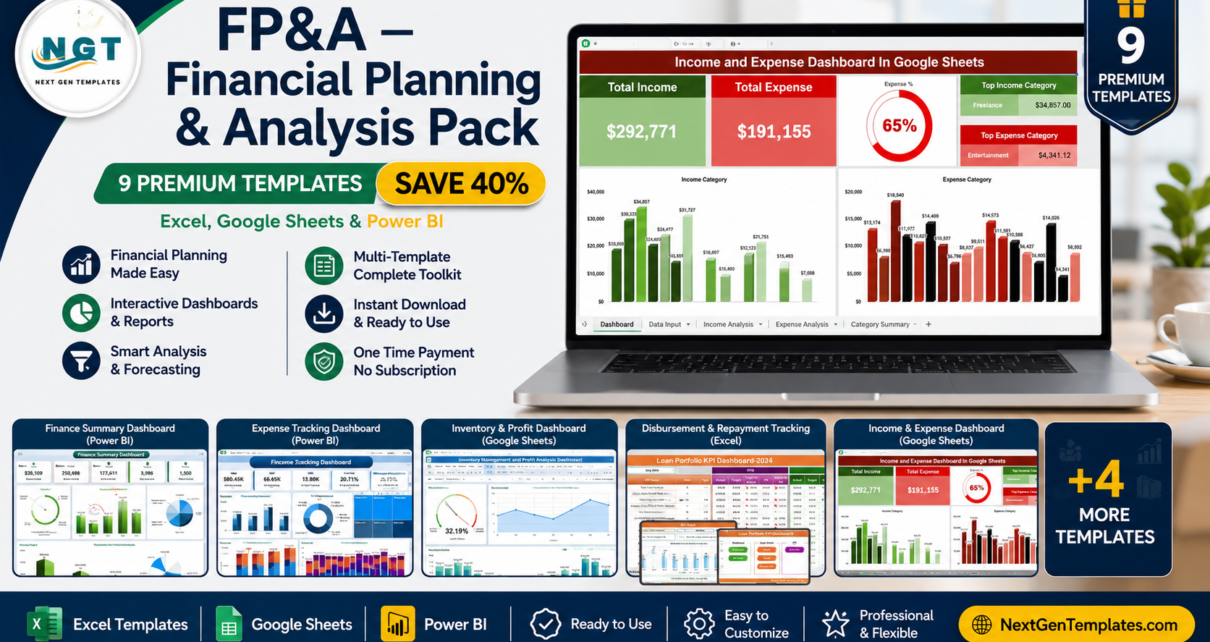
If you run financial planning and analysis, you already know the pain: juggling separate spreadsheets for income tracking, a different tool for revenue analysis, yet another for loan or procurement reporting. The FP&A — Financial Planning & Analysis Pack solves that by bundling 9 premium finance dashboards across Excel, Google Sheets and Power BI into one complete toolkit. Buy them individually and you’d pay $143.91 — with this bundle you pay just $85.99 and save 40% ($57.92). Explore all our dashboard templates or jump straight to the FP&A Pack.
🔑 Key Features of the FP&A — Financial Planning & Analysis Pack
This pack is built for finance teams who need a 360° view of performance without stitching together a dozen disconnected files. Here is what makes it stand out:
📊 Complete FP&A Coverage — From high-level finance summaries to granular procurement and freight cost control, the nine dashboards cover income, expenses, cash flow, revenue, profitability, loans, inventory, and vendor spend in one place.
🧩 Three Platforms, One Pack — Whether your team lives in Excel, collaborates in Google Sheets, or presents in Power BI, this bundle has a native template for each workflow. No need to convert files or learn a new tool.
💰 Built-In Savings — The nine templates retail for $143.91 individually. As a bundle they are just $85.99, a straight 40% saving that pays for itself on the first report you build.
⚙️ Plug-and-Play Setup — Each dashboard ships with sample data and pre-built charts, KPI cards, pivot tables and slicers. Replace the sample data with your own and everything updates automatically — no formulas to rewrite and no macros required for the Excel and Google Sheets files.
📈 Decision-Ready Visuals — Interactive charts, variance analysis, target-vs-actual comparisons and trend lines turn raw numbers into the insights leadership actually asks for.
🔍 Drill-Down Filtering — Slicers and filters let you slice by department, region, fund type, vendor, payment method, month and more, so you can answer questions on the spot.
📦 What’s Included in the FP&A Pack
Here is every template inside the bundle, with a quick look at what each one does.
1. Finance Summary Dashboard in Excel
A complete financial overview covering income, expenses, profit margins and cash flow — the perfect command center for finance managers and business owners. View template →
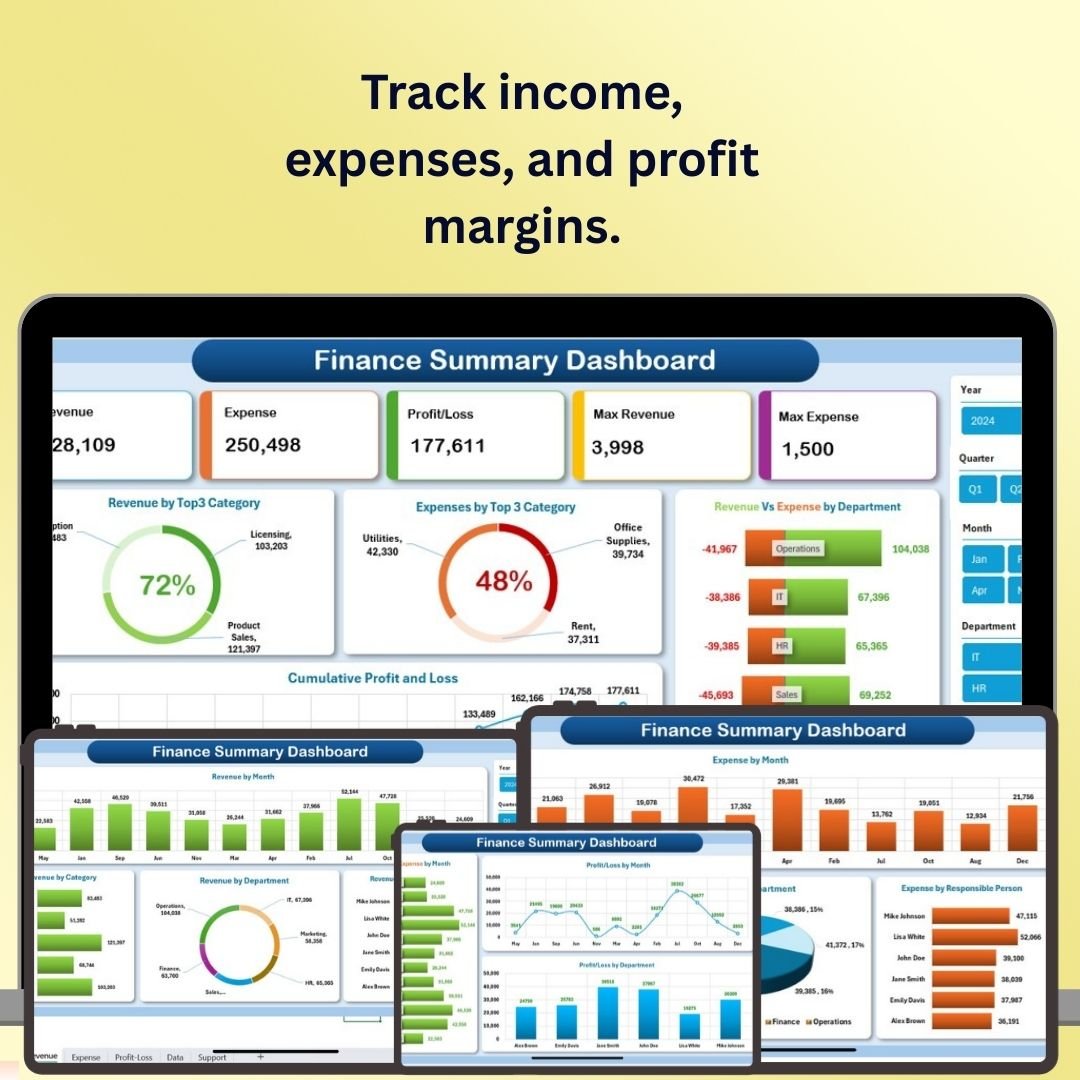
Finance Summary Dashboard in Excel
2. Expense Tracking Dashboard in Power BI
Track, analyze and optimize spending across departments, categories, vendors and projects with interactive Power BI visuals and CY-vs-PY variance analysis. View template →
3. Income and Expense Dashboard in Google Sheets
A real-time, cloud-friendly tracker for income and expenses with automatic categorization, net-savings calculations and visual summaries — ideal for freelancers and small businesses. View template →
 Income and Expense Dashboard in Google Sheets
4. Loan Portfolio KPI Dashboard in Excel
Monitor disbursements, repayments, default rates and portfolio growth, and classify loans by status to spot risk early — built for lenders, finance institutions and analysts. View template →
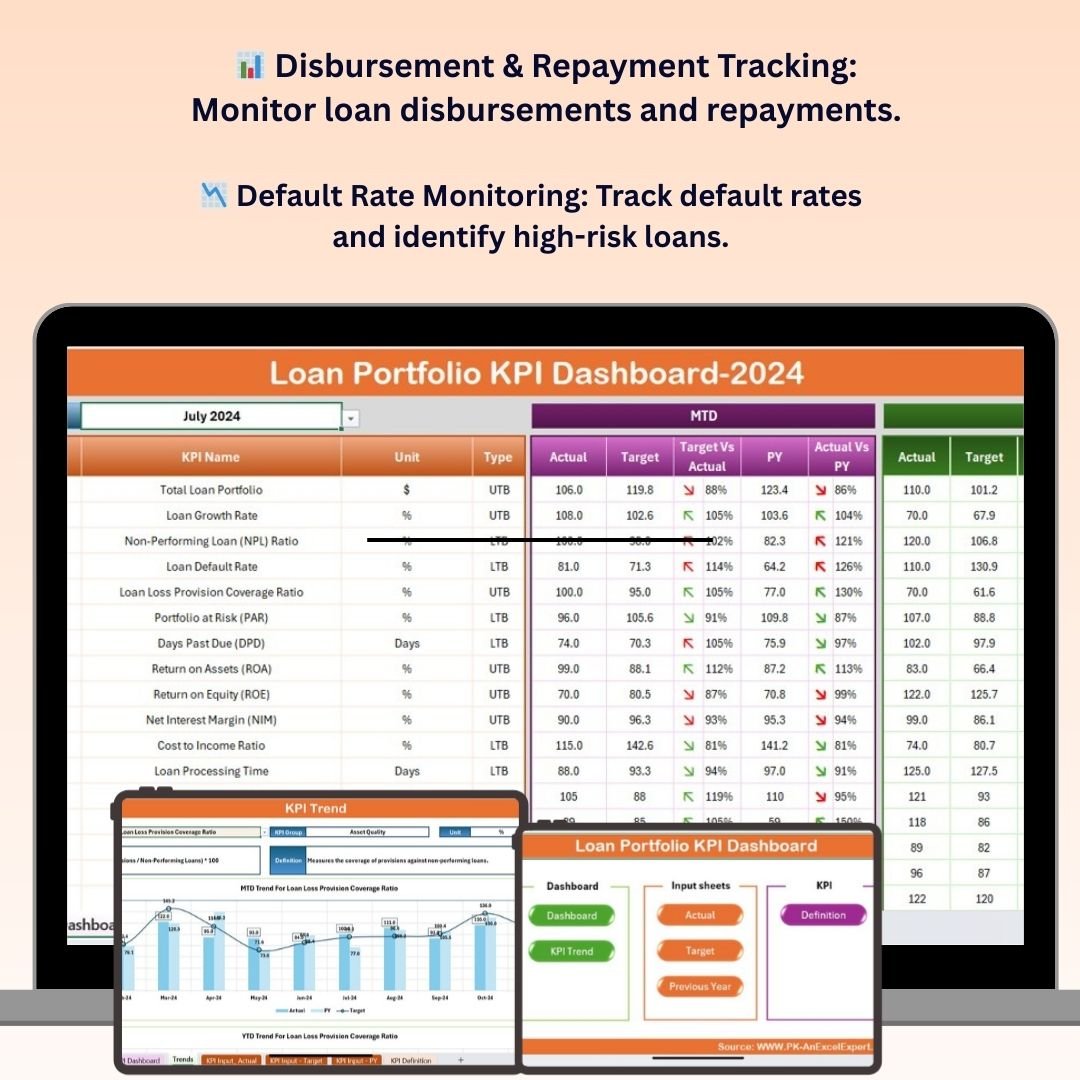 Loan Portfolio KPI Dashboard in Excel
5. Inventory Management and Profit Analysis Dashboard in Google Sheets
Track stock levels while automatically calculating profit margins, gross profit and turnover — a dual-purpose tool for retailers, e-commerce sellers and warehouse managers. View template →
 Inventory Management and Profit Analysis Dashboard in Google Sheets
6. Freight Cost KPI Dashboard in Excel
Track total freight costs, cost per shipment, delivery times and carrier performance to cut logistics spend and streamline supply-chain operations. View template →
 Freight Cost KPI Dashboard in Excel
7. Procurement Cost Analysis Dashboard in Excel
A real-time view of purchase orders, total spend, vendor performance and departmental budgets, with category and payment-term insights to optimize procurement. View template →
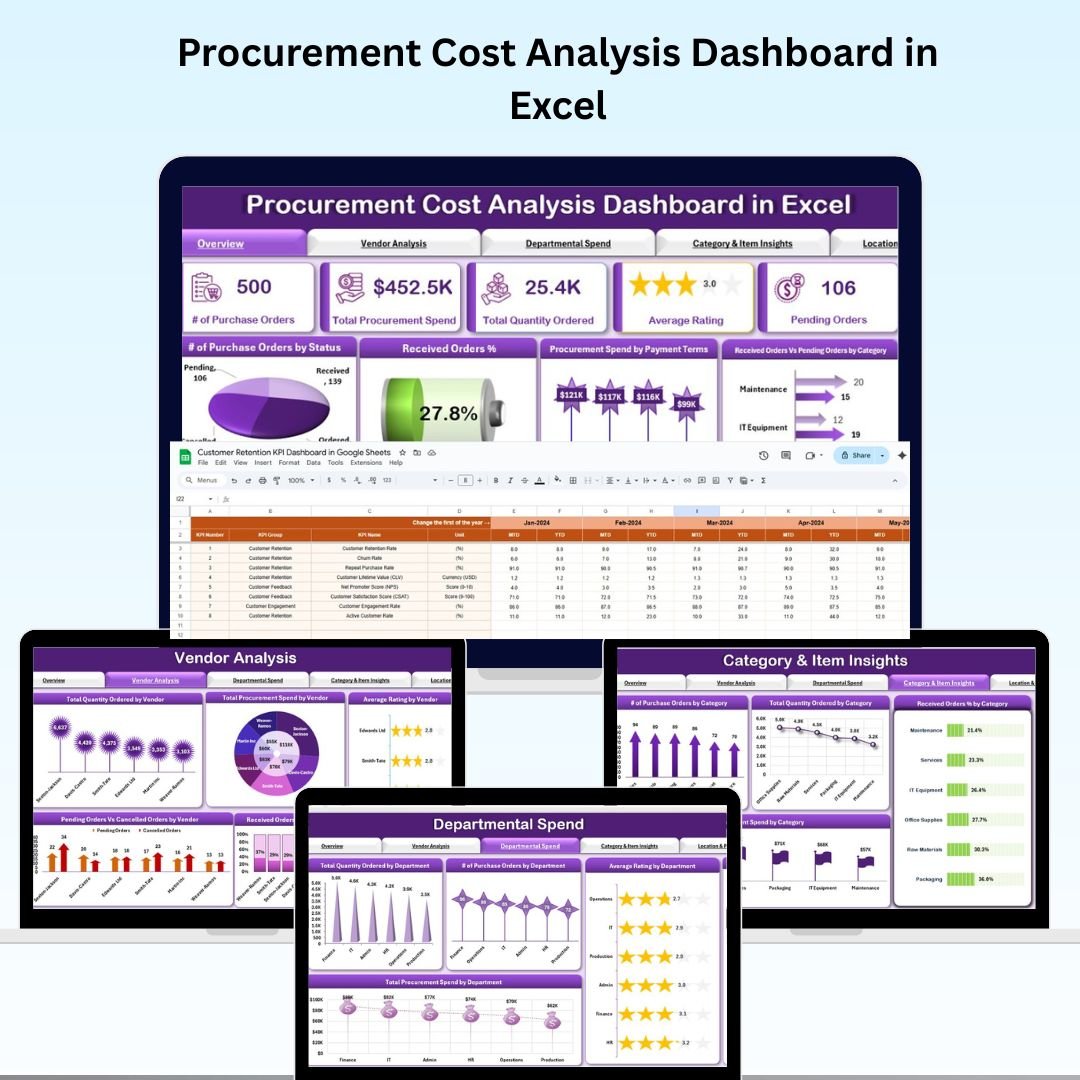 Procurement Cost Analysis Dashboard in Excel
8. Revenue Analysis Dashboard in Power BI
Five pages of revenue intelligence — overview, region, sales channel, product and monthly trends — with KPI cards for total revenue, profit margin % and target achievement. View template →
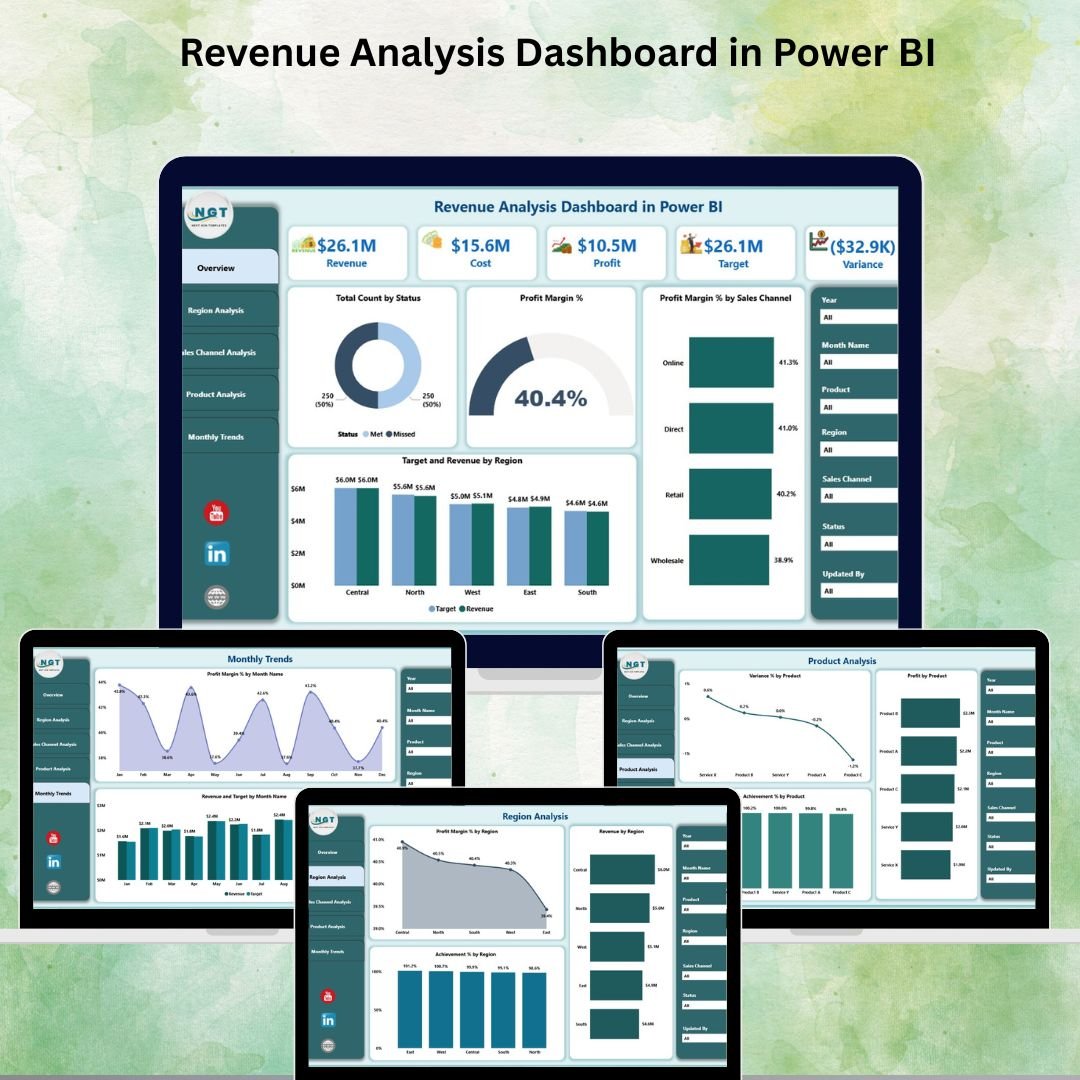 Revenue Analysis Dashboard in Power BI
9. Church Finance Dashboard in Excel
Purpose-built for ministries and nonprofits to track tithes, offerings, departmental expenses and donor contributions across 5 interactive pages and 19 charts. View template →
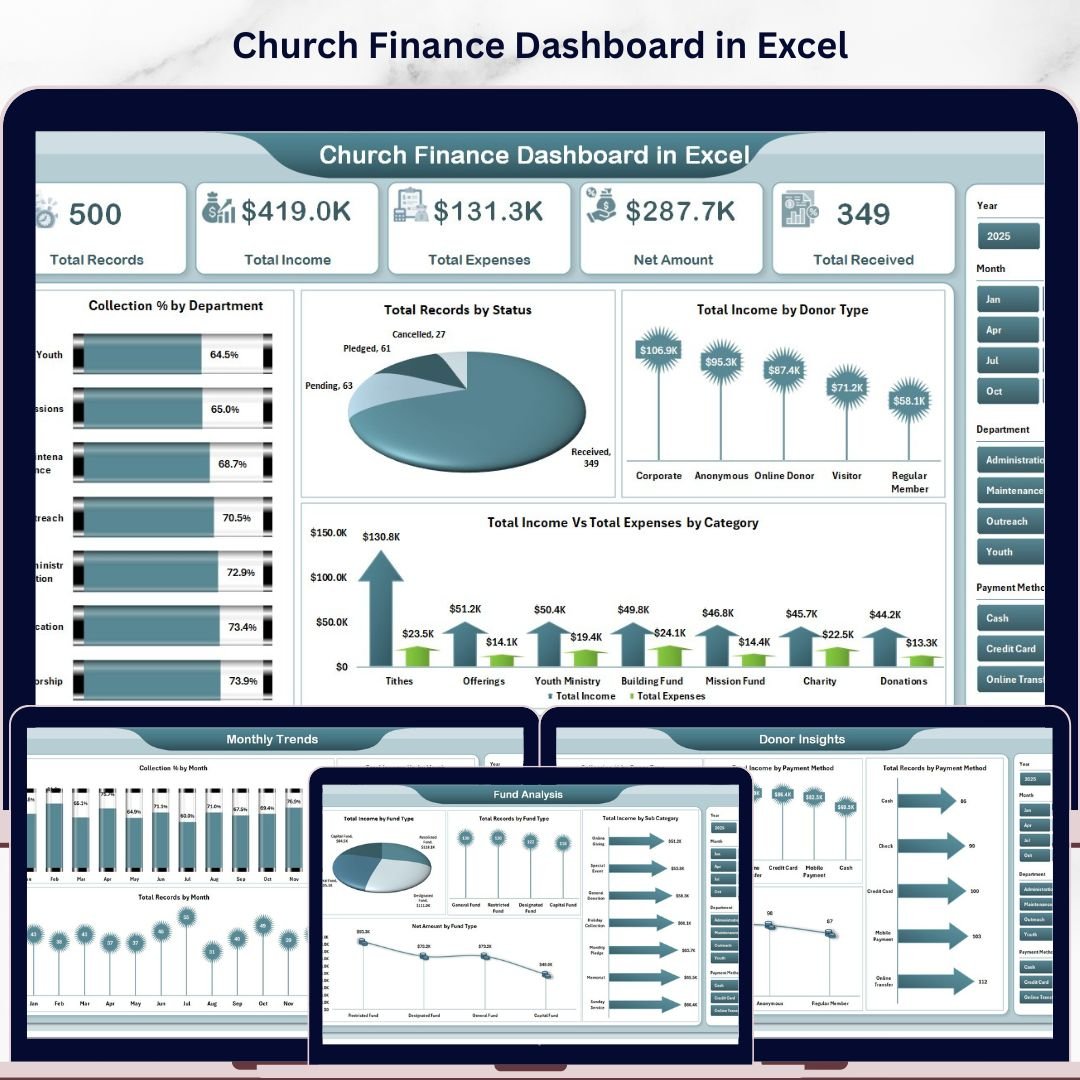 Church Finance Dashboard in Excel
💡 Smart Comparison — Individual vs Bundle
| # | Template | Platform | Individual Price |
|---|---|---|---|
| 1 | Finance Summary Dashboard | Excel | $17.99 |
| 2 | Expense Tracking Dashboard | Power BI | $17.99 |
| 3 | Income & Expense Dashboard | Google Sheets | $9.99 |
| 4 | Loan Portfolio KPI Dashboard | Excel | $12.99 |
| 5 | Inventory Mgmt & Profit Analysis | Google Sheets | $17.99 |
| 6 | Freight Cost KPI Dashboard | Excel | $12.99 |
| 7 | Procurement Cost Analysis | Excel | $17.99 |
| 8 | Revenue Analysis Dashboard | Power BI | $17.99 |
| 9 | Church Finance Dashboard | Excel | $17.99 |
| Individual Total | $143.91 | ||
| FP&A Bundle Price | $85.99 (Save 40%) | ||
🚀 Advantages of Buying the Bundle
One purchase, full coverage. Instead of evaluating, buying and downloading nine separate products, you get the entire FP&A stack in a single transaction — and a single folder you can roll out to your team.
Consistency across reports. Because the dashboards share a design philosophy, your monthly board pack looks coherent whether a chart came from Excel, Google Sheets or Power BI.
Lower cost per template. At $85.99 for nine dashboards, your effective price is under $10 each — far below the individual average, and a fraction of what custom-built dashboards or subscription BI tools cost.
✅ Best Practices for Deploying the Pack
Start with the Finance Summary Dashboard as your top-level view, then layer in the specialist dashboards (revenue, loans, procurement, freight) as your reporting needs grow. Keep one master data-entry sheet per template, refresh on a fixed cadence (weekly or monthly), and use the slicers to build saved views for each stakeholder group. For Power BI files, connect the demo dataset to your live source so dashboards update automatically.
🔗 Explore More Templates
Browse the full Dashboard Templates collection, the Power BI Dashboards, or grab the complete FP&A — Financial Planning & Analysis Pack.
❓ Frequently Asked Questions
What is included in the FP&A — Financial Planning & Analysis Pack?
The pack includes 9 premium finance dashboards: Finance Summary, Expense Tracking, Income & Expense, Loan Portfolio KPI, Inventory Management & Profit Analysis, Freight Cost KPI, Procurement Cost Analysis, Revenue Analysis and Church Finance — spanning Excel, Google Sheets and Power BI.
How much do I save with the bundle?
Bought individually the nine templates cost $143.91. The bundle is $85.99, a 40% saving of $57.92.
Which software do I need?
You’ll need Microsoft Excel for the Excel templates, a Google account for the Google Sheets templates, and free Microsoft Power BI Desktop for the Power BI dashboards. No coding or macros are required.
Do I need advanced skills to use these dashboards?
No. Each template comes with sample data and pre-built visuals. You simply replace the sample data with your own and the dashboards update automatically.
Is this a one-time purchase or a subscription?
It is a one-time purchase. You download the templates and own them — no recurring fees.
Can I customize the dashboards for my organization?
Yes. Every dashboard is fully editable, so you can change categories, departments, fund types and branding to match your business.
🎯 Get the Complete FP&A Toolkit Today
Stop paying for nine separate templates and stop stitching together disconnected files. The FP&A — Financial Planning & Analysis Pack gives finance teams everything they need to plan, track and present — across Excel, Google Sheets and Power BI — for one low price.
🎥 Visit our YouTube channel for step-by-step video tutorials: Youtube.com/@PKAnExcelExpert