International Arbitration Panels Dashboard in Excel is a ready-to-use workbook for arbitration teams that need clear reporting across claim amount, award amount, legal cost, case status, region, institution, seat, panel type, risk level, outcome, recovery percentage, settlement percentage, delayed cases, and satisfaction. The dashboard includes 7 worksheet tabs, 5 dashboard pages, 5 headline cards, 20 chart views, multiple slicers, a Data Sheet, and a Support Sheet. Instead of rebuilding arbitration reports manually, users can update the Data Sheet, refresh the workbook, and review case performance in minutes.
Excel remains a practical analytics layer for many legal and arbitration teams because it is familiar, editable, and widely available through Microsoft 365. Microsoft also documents slicers as a visual way to filter table and PivotTable data, which supports the interactive filtering workflow used in this dashboard. Reference: Microsoft Support on using slicers to filter data.
Click here to purchase International Arbitration Panels Dashboard in Excel
Key Features of International Arbitration Panels Dashboard in Excel
- 5 KPI cards for Total Claim Amount, Total Legal Cost, Total Cases, Avg. Satisfaction, and Delayed Cases.
- 5 dashboard pages covering Overview, Institution, Regional, Case Risk, and Outcomes analysis.
- Claim vs award reporting by institution, month, year, and status.
- Institution and seat review for case duration, panel type, legal cost, and regional exposure.
- Risk and outcome analysis by risk level, claim type, outcome, industry, region, and settlement performance.
- Interactive slicers for quick filtering across available arbitration fields.
- Data and Support sheets for structured data entry and pivot-based refresh logic.
Dashboard Pages Explanation
1. Overview Page
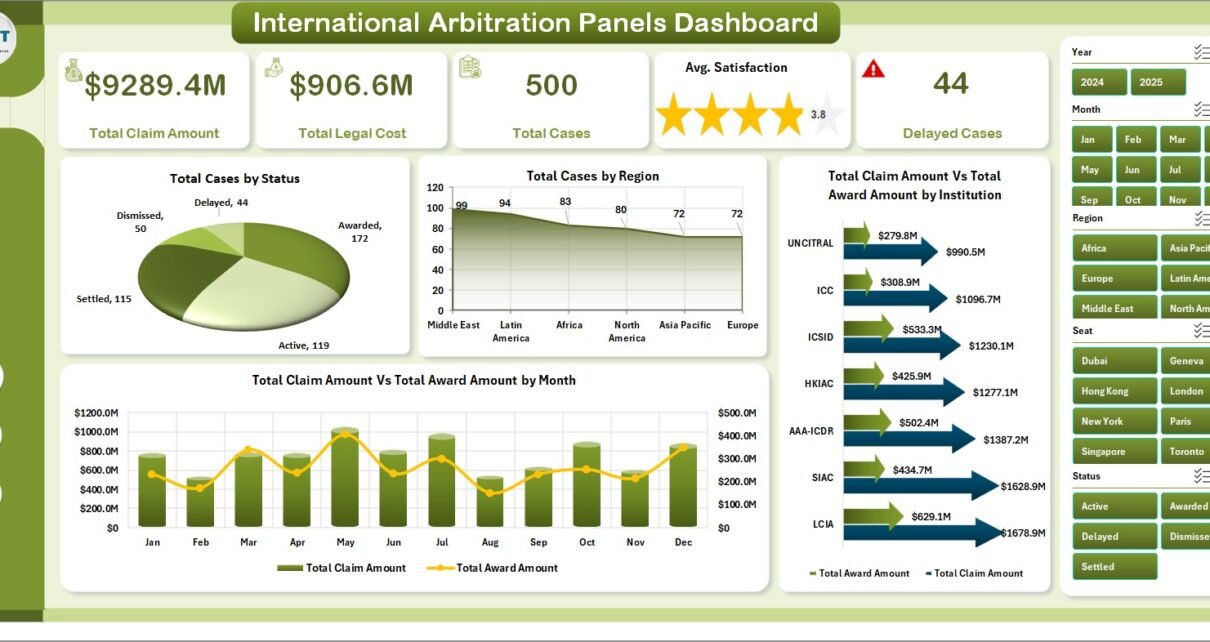
The Overview Page gives leadership a high-level arbitration snapshot. At the top, cards show Total Claim Amount, Total Legal Cost, Total Cases, Avg. Satisfaction, and Delayed Cases.
Total Cases by Status: This chart shows the distribution of arbitration matters by status. It helps users understand active, pending, settled, awarded, delayed, or closed case movement quickly.
Total Cases by Region: This visual compares case volume across regions. It helps identify where arbitration work is concentrated and where teams may need more attention.
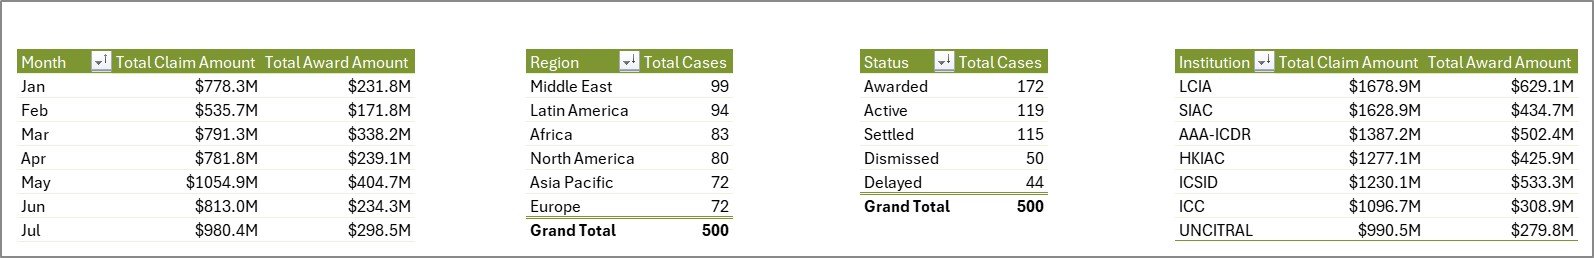
Total Claim Amount Vs Total Award Amount by Institution: This chart compares financial claim value against award value by institution. It helps teams review institution-level recovery outcomes.
Total Claim Amount Vs Total Award Amount by Month: This monthly trend compares claim and award movement over time. It supports recurring review of value, recovery, and arbitration timing patterns.

Click here to purchase International Arbitration Panels Dashboard in Excel
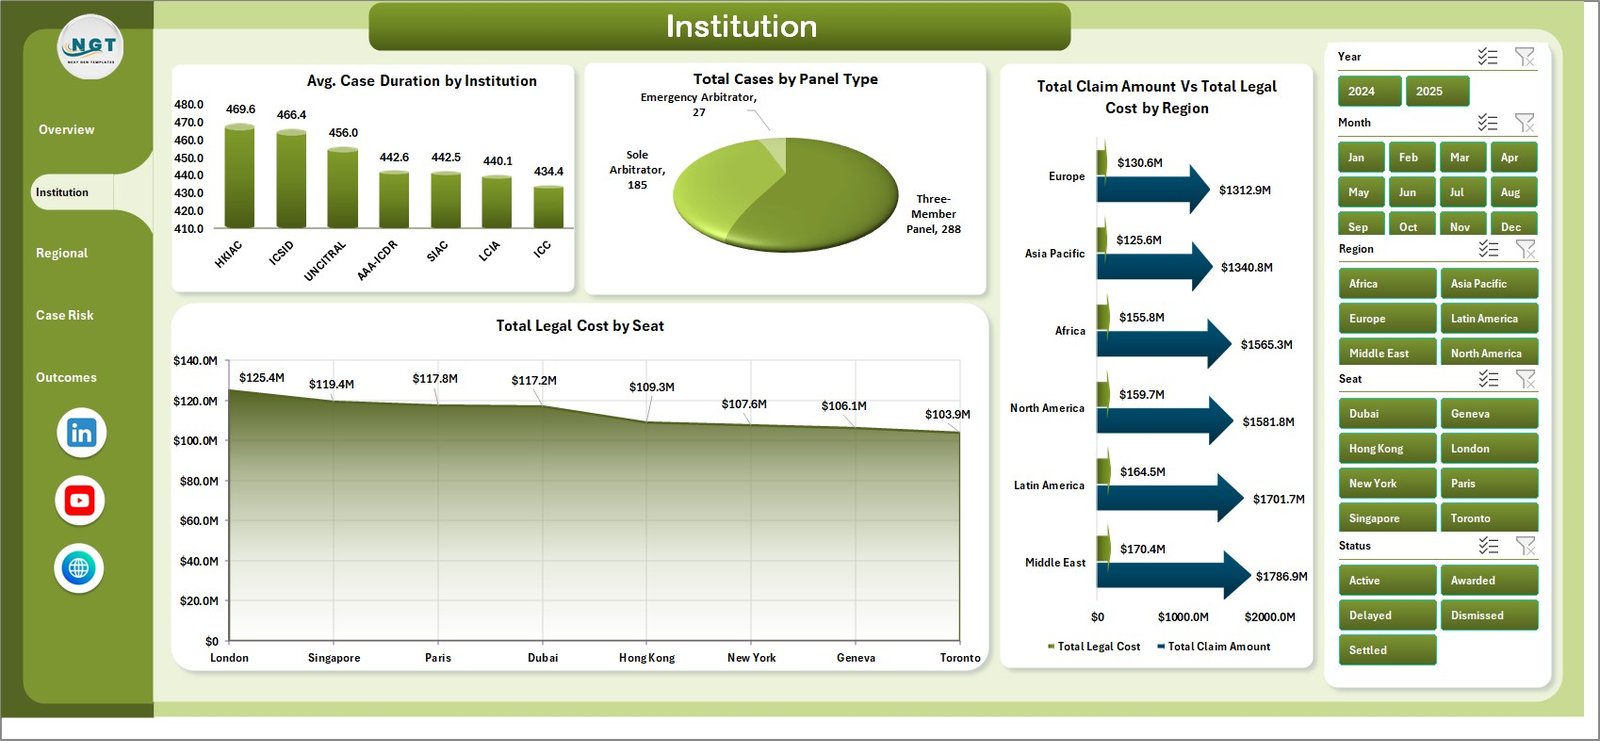
2. Institution
The Institution page focuses on institutional performance, panel structure, legal cost, and regional financial exposure.
Avg. Case Duration by Institution: This chart compares average case duration by institution. It helps users identify where cases may close faster or require longer administration.
Total Cases by Panel Type: This visual shows the case mix by panel type. It supports review of sole arbitrator, three-member panel, and other panel structures.
Total Claim Amount Vs Total Legal Cost by Region: This chart compares claim value and legal cost by region. It helps teams identify regions where legal spending may be high relative to claim value.
Total Legal Cost by Seat: This chart ranks arbitration seats by legal cost. It supports budget review and seat-level cost comparison.
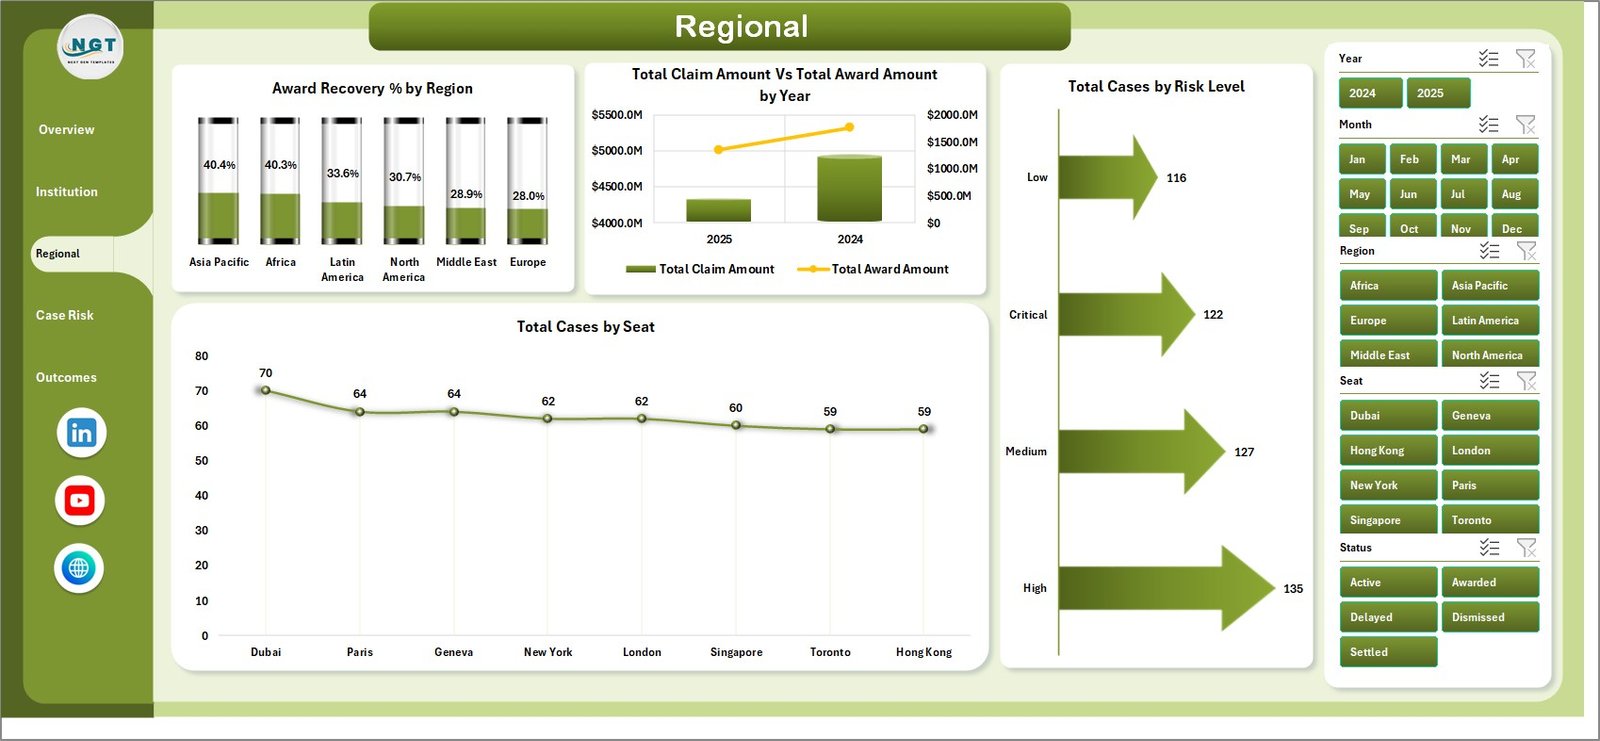
3. Regional
The Regional page gives users a geographic view of recovery percentage, claim and award value, risk level, and seat distribution.
Award Recovery % by Region: This chart shows award recovery performance by region. It helps teams compare how much claimed value is recovered across different markets or jurisdictions.
Total Claim Amount Vs Total Award Amount by Year: This chart compares annual claim amount and award amount. It helps users review year-over-year value and outcome trends.
Total Cases by Risk Level: This visual groups arbitration cases by risk level. It helps managers see whether high-risk matters are increasing or concentrated.
Total Cases by Seat: This chart compares case count by arbitration seat. It helps identify which seats are most frequently used.
4. Case Risk
The Case Risk page is useful for reviewing cycle time, claim type exposure, outcome mix, and settlement behavior by industry.
Avg. Case Duration by Risk Level: This chart compares average duration across risk bands. It helps teams understand whether high-risk matters are also creating longer timelines.
Total Claim Amount by Claim Type: This visual shows financial exposure by claim type. It helps users identify the dispute categories with the highest claim value.
Total Cases by Outcome: This chart groups cases by outcome. It supports review of awarded, settled, dismissed, withdrawn, pending, or other outcome categories.
Settlement % by Industry: This chart compares settlement percentage by industry. It helps identify sectors where negotiated outcomes are more common.

5. Outcomes
The Outcomes page connects case status, industry, region, and month with financial recovery and settlement behavior.
Total Claim Amount Vs Total Award Amount by Status: This chart compares claim and award values across case statuses. It helps users understand how financial outcomes vary by lifecycle stage.
Award Recovery % by Industry: This visual compares recovery percentage across industries. It helps teams spot sectors with stronger or weaker award conversion.
Settlement % by Region: This chart compares settlement performance by region. It helps identify where disputes are more likely to resolve through settlement.
Settlement % by Month: This trend tracks monthly settlement percentage. It helps users identify periods where settlement activity increased or slowed.

6. Data Sheet Tab
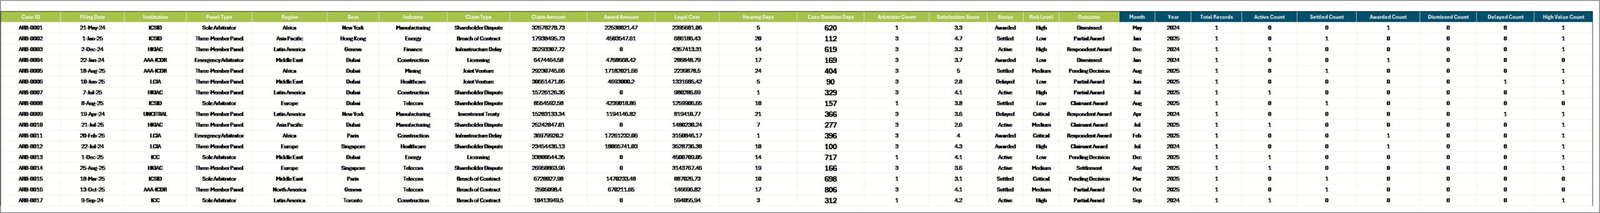
The Data Sheet is the input layer. Add arbitration case data in the same format as the sample records. Consistent institution, region, seat, risk level, status, outcome, claim type, industry, month, and year fields are important because the dashboard uses pivot tables and slicers.
7. Support Sheet
The Support Sheet contains multiple pivot tables used to create the entire dashboard dynamically. After updating the Data Sheet, go to the Data tab in the Excel Ribbon and click Refresh All. All pivots and charts refresh together. You can keep this sheet hidden during normal use.
International Arbitration Panels Dashboard in Excel vs. Google Sheets vs. Paid CRM/SaaS – Feature Comparison
| Feature | International Arbitration Panels Dashboard in Excel | Google Sheets alternative | Paid legal SaaS |
|---|---|---|---|
| Cost | $17.99 one-time | Template cost or manual build | Monthly or annual subscription |
| Platform | Microsoft Excel | Google Sheets | Vendor cloud platform |
| Setup time | Replace data and refresh | Import records and adjust formulas | Implementation and onboarding |
| Real-time team collaboration | Available through OneDrive or SharePoint | Native collaboration | Usually included by plan |
| Mobile access | Excel mobile or web for light review | Google Sheets mobile app | Vendor app or browser |
| Customizable fields | Editable workbook, charts, and pivots | Editable with permissions | Often limited by vendor settings |
| Year-1 cost at 5 users | $17.99 plus Excel licensing if needed | Low software cost plus setup time | Often hundreds or thousands |
| Arbitration analytics | Built-in pages for claim, award, cost, institution, region, seat, risk, outcome, and settlement review | Custom setup required | Depends on module and plan |
Who Should Use This Template
This dashboard is useful for arbitration law firms, dispute resolution teams, case administrators, legal operations teams, finance analysts, corporate legal departments, arbitration consultants, and practice leaders who need a practical Excel reporting layer for arbitration portfolios.
It is not a full legal practice management platform, e-filing system, document repository, hearing calendar, billing system, or client portal. It works best when your team already has structured arbitration data and wants a clean dashboard for recurring review.
Real-World Use Cases
Priya, Finance Analyst: She reviews claim amount, award amount, legal cost, and recovery percentage before preparing monthly arbitration portfolio notes.
Daniel, Legal Operations Manager: He uses Institution and Regional pages to compare duration, seat cost, risk level, and regional case concentration.
Anita, Arbitration Partner: She uses the Outcomes page to review settlement percentage, award recovery, and status-level financial movement before leadership meetings.
Advantages of International Arbitration Panels Dashboard in Excel
- Faster recurring reporting: Prebuilt cards, charts, slicers, and dashboard pages reduce manual report preparation.
- Familiar platform: Most legal and finance teams already know Excel.
- Editable model: Users can adjust fields, pivots, charts, labels, colors, and worksheets.
- Clear refresh workflow: Update the Data Sheet, click Refresh All, and review the dashboard pages.
Opportunities for Improvement
This is an Excel reporting template, not a live arbitration management application. It does not collect filings, store evidence, send reminders, manage permissions, or automate hearing workflows. Teams can improve it further by adding Power Query cleanup steps, extra slicers, custom formulas, or organization-specific risk scoring.
Best Practices
- Keep institution, region, seat, status, risk level, claim type, outcome, and industry names consistent.
- Refresh the workbook after every major data update.
- Keep the Support Sheet protected or hidden for everyday users.
- Back up the workbook before changing pivot tables or dashboard layouts.
- Use slicers during review meetings instead of creating many duplicate reports.
Explore Relevant Templates
- International Arbitration Panels Dashboard in Excel – the template covered in this article.
- Intellectual Property Law Firms Dashboard in Excel – IP legal analytics in Excel.
- Employment Law Services Dashboard in Excel – employment law case and revenue reporting.
- Cyber Law Advisory Dashboard in Excel – cyber legal advisory analytics.
- Browse Excel dashboard templates.
Frequently Asked Questions
What does the International Arbitration Panels Dashboard in Excel track?
It tracks claim amount, award amount, legal cost, cases, satisfaction, delayed cases, institution, panel type, region, seat, status, risk level, claim type, outcome, industry, recovery percentage, and settlement percentage.
Can I replace the sample data?
Yes. Replace or add records in the Data Sheet, keep the same format, then click Refresh All so the pivot tables, charts, cards, and slicers update.
Does this workbook require macros?
No macro workflow is required for normal dashboard use. The dashboard uses Excel data, pivot tables, pivot charts, slicers, and refresh logic.
Can I customize the dashboard?
Yes. You can edit fields, formulas, pivots, charts, slicers, colors, labels, and worksheet layouts inside Excel.
Is this a full arbitration management system?
No. It is a reporting dashboard template. It does not replace case management, e-filing, document storage, reminders, billing, or client communication tools.
Is this a one-time purchase?
Yes. The dashboard is sold as a one-time downloadable Excel template from NextGenTemplates.
About the Author
Built by PK – Microsoft Certified Professional with 15+ years of Excel, Google Sheets, and Power BI experience. Founder of NextGenTemplates, reaching 300K+ subscribers across YouTube channels. Every template is hand-built and tested before release.
Conclusion
The International Arbitration Panels Dashboard in Excel gives arbitration teams a practical way to review claims, awards, legal costs, cases, institutions, regions, seats, risks, outcomes, recovery, and settlement data without building a dashboard from scratch.
Use it when you need a clear Excel workbook for arbitration portfolio review, legal operations reporting, finance analysis, institution comparison, and outcome tracking. Visit YouTube.com/@PKAnExcelExpert for step-by-step Excel tutorials.