Franchise management is all about tracking the performance of your franchise locations effectively. With Excel's powerful capabilities, you can now
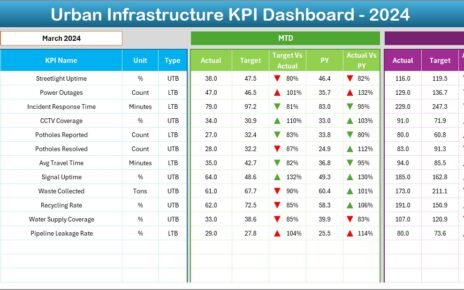
Urban infrastructure plays a major role in the growth, safety, and comfort of any city. Roads, water supply, waste management,
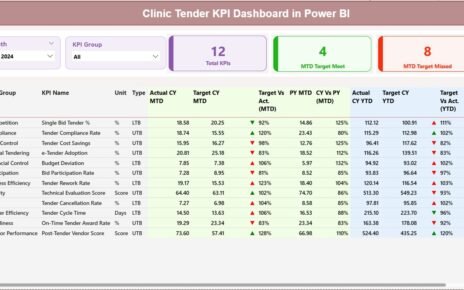
Managing clinic tenders without structured performance tracking often creates delays, cost overruns, compliance gaps, and poor visibility. However, modern clinics