Home>Blogs>Charts and Visualization>Quick Analysis Tool in Microsoft Excel
Quick Analysis Tool
Charts and Visualization Excel Tips and Tricks

Quick Analysis Tool in Microsoft Excel

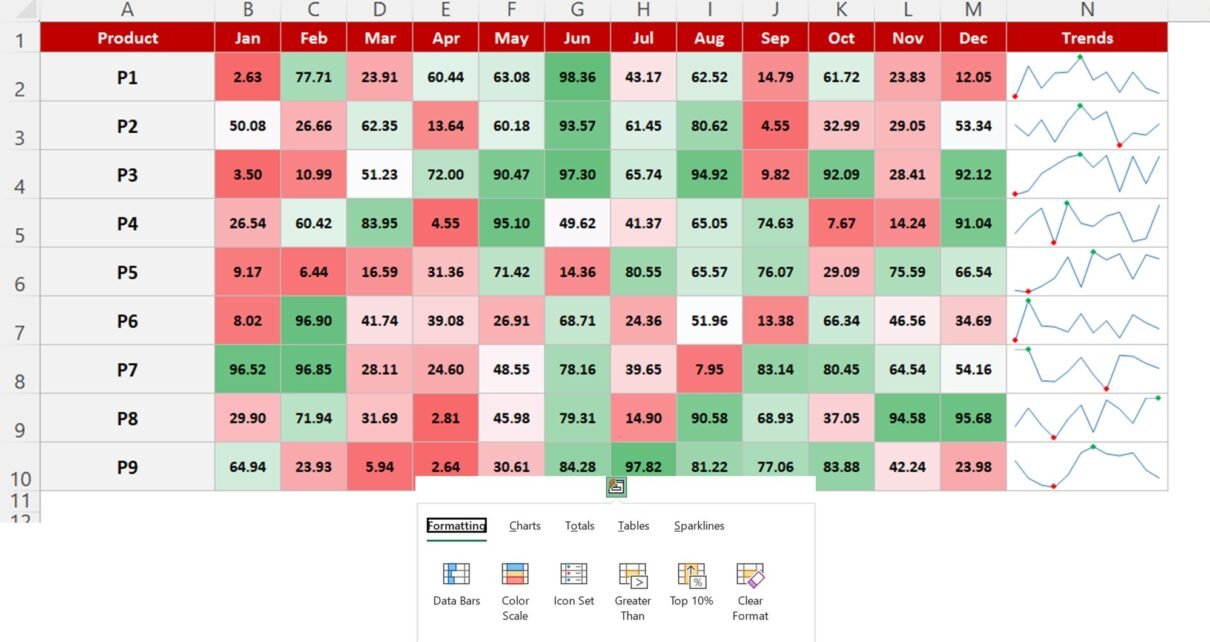
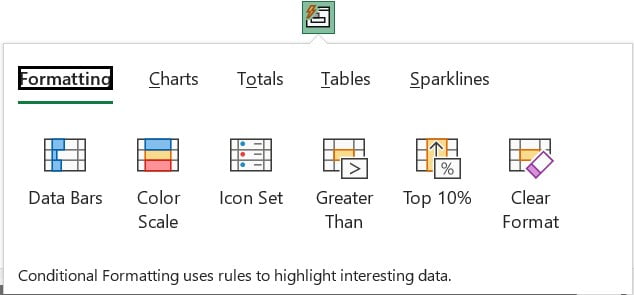
Quick Analysis Tool is used to apply the quick conditional formatting, Quick Charts, add Totals, Quick Pivot Tables and to add quick Sparklines in selected data.

Quick Analysis Tool in Microsoft Excel

After selecting the data, you can press Ctrl+Q Shortcut key to open this tool.
 

Quick Analysis Tool
Quick Analysis Tool


Note: This feature is available in Excel 2013 and above version only.

Visit our YouTube channel to learn step-by-step video tutorials

Youtube.com/@PKAnExcelExpert

Watch the step-by-step video tutorial:

Click here to download the practice file

Looking for ready-made Excel Chart Templates?
Browse finished, fully working templates you can use with your own data straight away.
Want to master these skills step by step? Join the video course Excel Pivot Tables & Dashboards: Basic to Advanced.
PK
Meet PK, the founder of PK-AnExcelExpert.com! With over 15 years of experience in Data Visualization, Excel Automation, and dashboard creation. PK is a Microsoft Certified Professional who has a passion for all things in Excel. PK loves to explore new and innovative ways to use Excel and is always eager to share his knowledge with others. With an eye for detail and a commitment to excellence, PK has become a go-to expert in the world of Excel. Whether you're looking to create stunning visualizations or streamline your workflow with automation, PK has the skills and expertise to help you succeed. Join the many satisfied clients who have benefited from PK's services and see how he can take your Excel skills to the next level!
https://www.pk-anexcelexpert.com