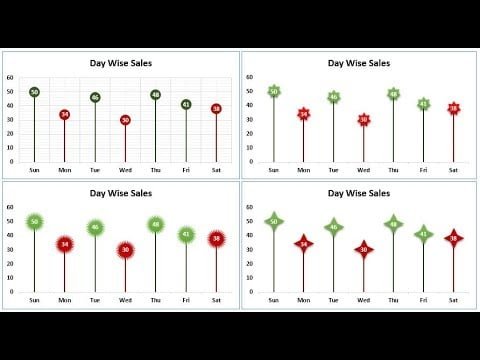
Home>Blogs>Charts and Visualization>Conditional Formatting in a Lollipop Chart in Excel>Video Thumbnail: Info-graphics: Conditional Formatting in Lollipop Chart || Learn 4 different Variants of this Chart
Video Thumbnail: Info-graphics: Conditional Formatting in Lollipop Chart || Learn 4 different Variants of this Chart
08
Jul 2024
0Comments Off on Video Thumbnail: Info-graphics: Conditional Formatting in Lollipop Chart || Learn 4 different Variants of this Chart
PK
Meet PK, the founder of PK-AnExcelExpert.com! With over 15 years of experience in Data Visualization, Excel Automation, and dashboard creation. PK is a Microsoft Certified Professional who has a passion for all things in Excel. PK loves to explore new and innovative ways to use Excel and is always eager to share his knowledge with others. With an eye for detail and a commitment to excellence, PK has become a go-to expert in the world of Excel. Whether you're looking to create stunning visualizations or streamline your workflow with automation, PK has the skills and expertise to help you succeed. Join the many satisfied clients who have benefited from PK's services and see how he can take your Excel skills to the next level!
https://www.pk-anexcelexpert.com
Related Articles
ERP Consulting KPI Dashboard in Power BI
ERP consulting firms operate in a fast-moving and highly competitive environment. Projects demand precision. Clients expect timely delivery. Meanwhile, leadership
Power Grid KPI Dashboard in Excel
Introduction In the evolving landscape of the power grid industry, decision-makers need efficient tools to monitor key performance indicators (KPIs)
Shipping Port KPI Dashboard in Excel
Shipping ports are vital hubs for global trade and logistics, facilitating the movement of goods across countries and continents. Given


