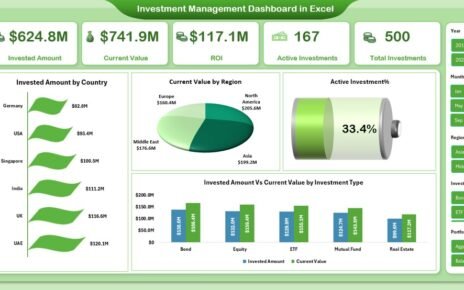
Managing investments without clarity always leads to missed opportunities and delayed decisions. Therefore, investors, analysts, portfolio managers, and finance teams
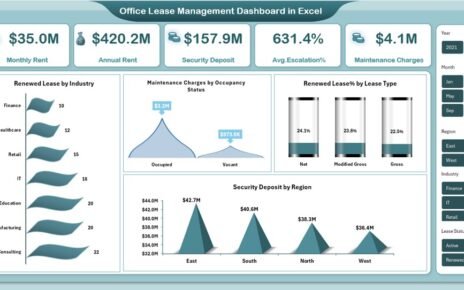
Managing office leases feels complex. Companies deal with multiple properties, different lease types, security deposits, maintenance charges, and escalation clauses.
In today’s digital-first world, IT infrastructure serves as the backbone of business operations. Companies rely on robust IT systems to