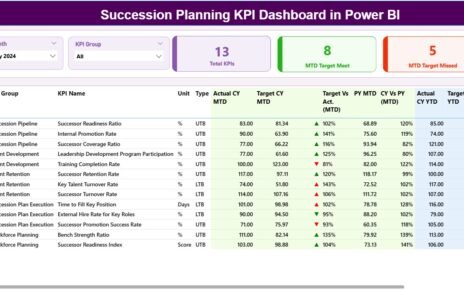
The Succession Planning KPI Dashboard in Power BI is a ready-to-use 3-page dashboard that tracks every succession KPI you care
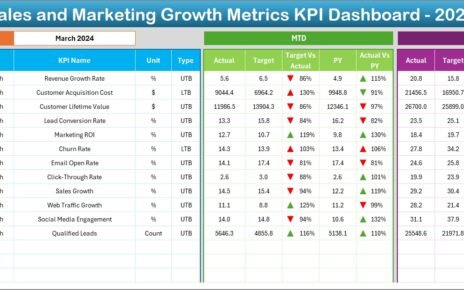
In today's fast-paced and data-driven business world, tracking performance is not just a good practice—it's essential. That's where the Sales
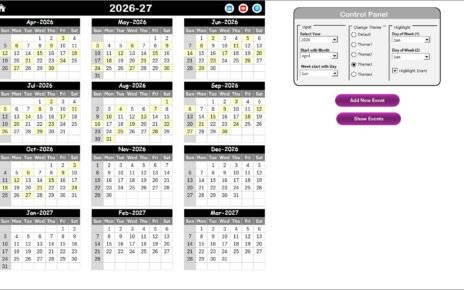
Retail businesses operate in a fast-moving environment. Regulations change. Deadlines approach quickly. Audits arrive without warning. However, many retail teams