Laboratories depend on precision, speed, and compliance. However, many labs still track instrument performance manually. As a result, teams spend hours compiling reports. Moreover, managers struggle to monitor downtime, utilization rates, calibration compliance, and performance gaps.
So, how can you monitor laboratory instrument KPIs in real time with accuracy and clarity?
The answer is simple.
You need a Laboratory Instruments KPI Dashboard in Power BI.
This ready-to-use Power BI dashboard transforms raw Excel data into powerful visual insights. Instead of checking multiple sheets, you can analyze MTD and YTD performance instantly. Furthermore, you can compare targets, track year-over-year growth, and detect performance issues immediately.
In this detailed guide, you will learn:
-
What a Laboratory Instruments KPI Dashboard in Power BI is
-
Why laboratories need it
-
A complete explanation of all 3 dashboard pages
-
How Excel data integrates into Power BI
-
Advantages of Laboratory Instruments KPI Dashboard in Power BI
-
Best Practices for the Laboratory Instruments KPI Dashboard
-
Frequently Asked Questions with Answers
Let us explore everything step by step.
Click to Purchases Laboratory Instruments KPI Dashboard in Power BI
What Is a Laboratory Instruments KPI Dashboard in Power BI?
A Laboratory Instruments KPI Dashboard in Power BI is an interactive performance monitoring tool built using Microsoft Power BI. It connects to an Excel file where you enter KPI data. Then, it visualizes performance metrics dynamically.
Instead of static reports, you get:
-
Real-time KPI performance tracking
-
MTD (Month-to-Date) analysis
-
YTD (Year-to-Date) analysis
-
Target vs Actual comparison
-
Current Year vs Previous Year comparison
-
Drill-through KPI definitions
Therefore, you gain complete visibility into laboratory instrument performance.
Moreover, Power BI allows interactive filtering and drill-down capabilities. As a result, you make faster and smarter decisions.
Why Do Laboratories Need a KPI Dashboard in Power BI?
Laboratories handle sensitive equipment and high compliance standards. Consequently, even small performance gaps can cause delays, financial losses, or regulatory risks.
However, without a centralized dashboard:
-
Managers miss declining trends
-
Maintenance teams react too late
-
Targets remain unclear
-
Performance comparisons take too long
Therefore, a Laboratory Instruments KPI Dashboard becomes essential.
It helps you:
-
Monitor KPI status instantly
-
Identify underperforming instruments
-
Track maintenance and calibration compliance
-
Compare performance with historical data
-
Improve accountability across teams
Furthermore, visual dashboards improve clarity. Instead of reviewing raw numbers, you see clear indicators and trends.
What Pages Are Included in the Laboratory Instruments KPI Dashboard?
This Power BI solution includes 3 interactive pages:
-
Summary Page
-
KPI Trend Page
-
KPI Definition Page (Drill-Through Page)
Let us understand each page in detail.
Click to Purchases Laboratory Instruments KPI Dashboard in Power BI
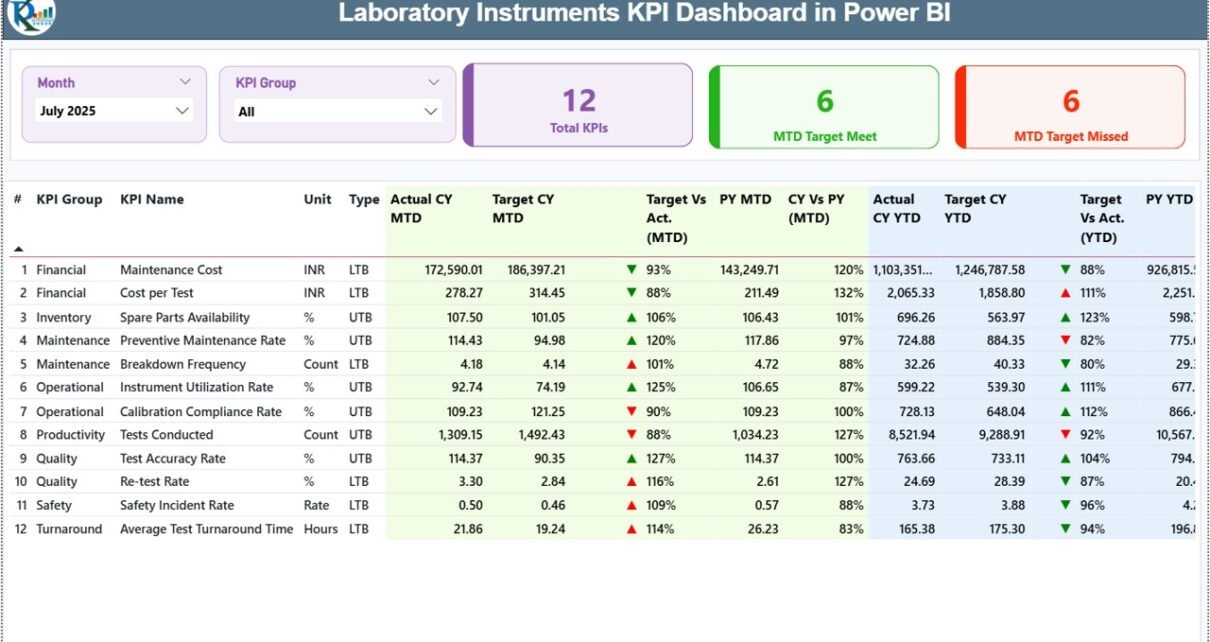
1️⃣ What Does the Summary Page Show?
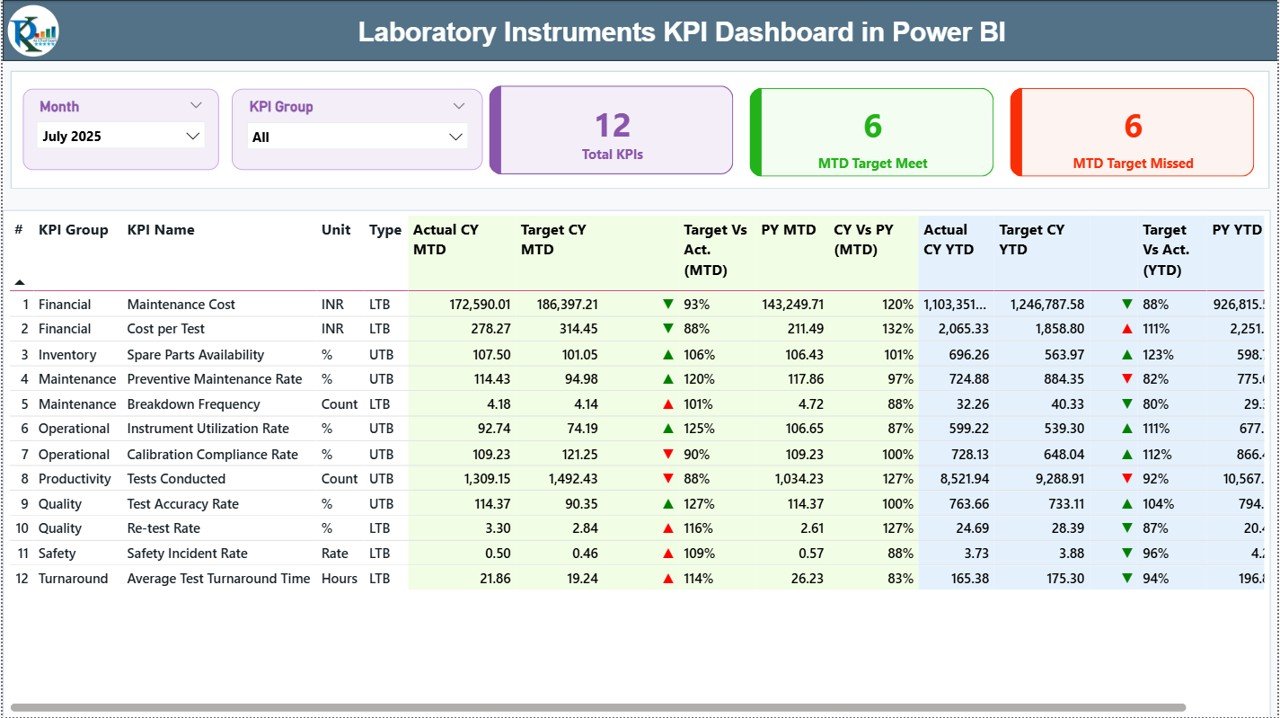
The Summary Page acts as the main performance overview page.
🔹 Slicers Available
At the top of the dashboard, you will find:
-
Month Slicer
-
KPI Group Slicer
These slicers allow dynamic filtering. Therefore, you can instantly analyze performance for a specific month or KPI category.
🔹 KPI Cards Display
The dashboard shows 3 important KPI cards:
-
Total KPIs Count
-
MTD Target Meet Count
-
MTD Target Missed Count
These cards provide quick performance insight. For example, if 18 out of 25 KPIs meet targets, you immediately understand performance strength.
🔹 Detailed KPI Table
Below the cards, you will find a detailed performance table containing:
-
KPI Number (Sequence number)
-
KPI Group
-
KPI Name
-
Unit of Measurement
-
Type (LTB or UTB)
-
Actual CY MTD
-
Target CY MTD
-
MTD Icon (▲ Green / ▼ Red)
-
Target vs Actual (MTD %)
-
PY MTD
-
CY vs PY (MTD %)
-
Actual CY YTD
-
Target CY YTD
-
YTD Icon
-
Target vs Actual (YTD %)
-
PY YTD
-
CY vs PY (YTD %)
🔹 KPI Type Explanation
-
LTB (Lower the Better) – Example: Downtime Hours
-
UTB (Upper the Better) – Example: Utilization Rate
Therefore, the dashboard evaluates performance correctly based on KPI type.
🔹 Icon Indicators
The ▲ (Green) and ▼ (Red) icons instantly show KPI status. As a result, managers detect issues quickly without analyzing every number.
Click to Purchases Laboratory Instruments KPI Dashboard in Power BI
2️⃣ What Does the KPI Trend Page Display?

The KPI Trend Page provides visual performance analysis.
On the left side, you will find a KPI Name slicer.
Once you select a KPI, the page displays:
-
MTD Combo Chart (Actual, Target, PY)
-
YTD Combo Chart (Actual, Target, PY)
These combo charts show performance trends over time.
For example:
If downtime increases for three consecutive months, the chart clearly shows an upward trend. Therefore, you can plan corrective action immediately.
Moreover, trend analysis supports long-term performance planning.
3️⃣ What Is the KPI Definition Page?

The KPI Definition Page works as a drill-through page. It remains hidden from the main navigation.
From the Summary Page, you can right-click on a KPI and drill through to view:
-
KPI Formula
-
KPI Definition
-
KPI Unit
-
KPI Type
This feature improves transparency.
Furthermore, auditors and quality teams can verify KPI logic instantly.
To return, simply click the back button located at the top left corner.
Click to Purchases Laboratory Instruments KPI Dashboard in Power BI
How Does Excel Data Connect to This Power BI Dashboard?
This dashboard uses an Excel file as a data source.
You must fill three worksheets:
1️⃣ Input_Actual Sheet
Here, you enter:
-
KPI Name
-
Month (First date of month)
-
MTD Actual Number
-
YTD Actual Number
Once updated, Power BI refreshes and displays the latest performance.
2️⃣ Input_Target Sheet
Here, you enter:
-
KPI Name
-
Month
-
MTD Target Number
-
YTD Target Number
Therefore, you can measure target achievement accurately.
3️⃣ KPI Definition Sheet
Here, you define:
-
KPI Number
-
KPI Group
-
KPI Name
-
Unit
-
Formula
-
Definition
-
Type (LTB / UTB)
This structure ensures consistency and clarity.
What KPIs Can You Track in This Dashboard?
You can track:
-
Instrument Utilization Rate (%)
-
Equipment Availability (%)
-
Downtime Hours
-
Preventive Maintenance Completion (%)
-
Calibration Compliance Rate (%)
-
Breakdown Frequency
-
Average Repair Time
-
Error Rate (%)
-
Cost per Test
-
Rework Rate (%)
For example, if equipment availability falls below 95%, you can investigate immediately.
Click to Purchases Laboratory Instruments KPI Dashboard in Power BI
Advantages of Laboratory Instruments KPI Dashboard in Power BI
Now, let us explore the key advantages.
1️⃣ Real-Time Monitoring
You refresh data and instantly view updated performance.
2️⃣ Clear Target Tracking
The dashboard calculates Target vs Actual automatically.
3️⃣ Year-over-Year Comparison
You compare current year performance with previous year data.
4️⃣ Visual KPI Indicators
Icons and charts simplify performance evaluation.
5️⃣ Centralized Data Structure
All KPI information remains structured and organized.
6️⃣ Improved Accountability
Teams clearly see which KPIs meet or miss targets.
7️⃣ Audit Transparency
Drill-through definitions improve compliance documentation.
8️⃣ Scalable Design
You can easily add new KPIs or modify groups.
Click to Purchases Laboratory Instruments KPI Dashboard in Power BI
Best Practices for the Laboratory Instruments KPI Dashboard
To maximize effectiveness, follow these best practices.
1️⃣ Update Data Monthly
Enter MTD and YTD numbers consistently.
2️⃣ Use First Date of Month
Always use the first date of the month for consistency.
3️⃣ Define KPIs Clearly
Document formulas properly in the KPI Definition sheet.
4️⃣ Review Trends Regularly
Analyze the KPI Trend page instead of only checking summary data.
5️⃣ Set Realistic Targets
Set achievable targets to ensure accurate evaluation.
6️⃣ Validate Data Accuracy
Double-check Excel inputs before refreshing Power BI.
7️⃣ Train Your Team
Ensure users understand LTB and UTB logic.
How Does This Dashboard Improve Laboratory Performance?
This dashboard improves laboratory performance because:
-
It reduces reporting time
-
It increases visibility
-
It improves compliance tracking
-
It encourages proactive maintenance
-
It highlights performance risks early
Consequently, laboratories operate more efficiently.
Who Should Use This Dashboard?
This dashboard benefits:
-
Laboratory Managers
-
Hospital Diagnostic Centers
-
Pharmaceutical Labs
-
Research Institutions
-
Equipment Maintenance Teams
-
Quality Assurance Departments
Moreover, any organization that relies on laboratory instruments can use this dashboard effectively.
Conclusion
Laboratories require precision, speed, and transparency. However, manual reporting slows decision-making and increases risk.
The Laboratory Instruments KPI Dashboard in Power BI offers a powerful and structured solution. It centralizes KPI tracking, simplifies comparisons, and highlights performance trends clearly.
Furthermore, its Excel-based input structure ensures easy data management. Meanwhile, Power BI provides interactive visualization and drill-through analysis.
If you want real-time monitoring, improved compliance, and better operational control, this dashboard delivers exactly that.
Click to Purchases Laboratory Instruments KPI Dashboard in Power BI
Frequently Asked Questions with Answers
1️⃣ What software do I need to use this dashboard?
You need Microsoft Power BI Desktop and Microsoft Excel.
2️⃣ Can I add more KPIs?
Yes. You can add new KPIs in the Excel data file and update the model.
3️⃣ Does the dashboard update automatically?
After refreshing Power BI, it updates based on the latest Excel data.
4️⃣ What does LTB and UTB mean?
LTB means Lower the Better. UTB means Upper the Better.
5️⃣ Can small laboratories use this dashboard?
Yes. Both small and large laboratories can use it effectively.
6️⃣ How often should I update the data?
You should update data monthly. However, you can update it more frequently if required.
Click to Purchases Laboratory Instruments KPI Dashboard in Power BI
Visit our YouTube channel to learn step-by-step video tutorials