The airline industry runs on precision, efficiency, and real-time decision-making. With tight schedules, fluctuating fuel prices, and complex operations, airlines
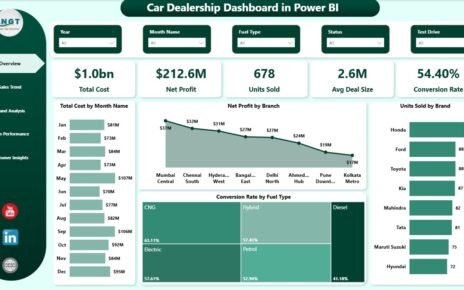
A dealership is a margin business disguised as a volume business. You can move 200 cars a month and still
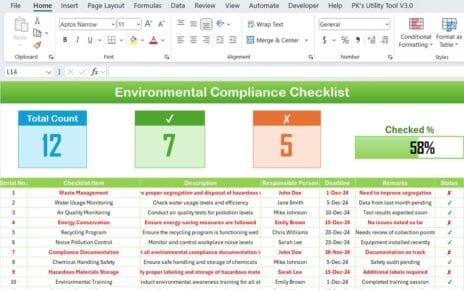
In this article, we will take an in-depth look at what an Environmental Compliance Checklist is, its benefits, and best