In today’s fast-paced business world, every company wants to ensure their employees are growing, performing, and staying engaged. Tracking human
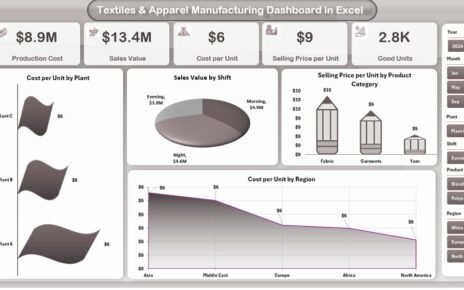
The textiles and apparel industry operates in a highly competitive, cost-sensitive, and volume-driven environment. Every day, manufacturers track production output,
Managing team tasks, meetings, and project activities requires clear planning and proper scheduling. Teams often struggle to track important deadlines,