Managing multiple projects without clear visibility always creates confusion, delays, and cost overruns. Moreover, project managers, PMO heads, and leadership teams constantly struggle to track budgets, timelines, priorities, and performance when data stays scattered across multiple Excel files or tools. However, when organizations use a structured Project Management Office (PMO) Dashboard in Excel, they gain instant clarity, control, and confidence in decision-making.
Therefore, in this detailed and SEO-friendly guide, you will learn what a PMO Dashboard in Excel is, how it works, why organizations need it, its complete sheet-wise structure, advantages, best practices, and frequently asked questions. Additionally, this article uses simple language, practical explanations, and real-world logic so you can apply it immediately.Project Management Office (PMO) Dashboard in Excel
Click to buy Project Management Office (PMO) Dashboard in Excel
What Is a Project Management Office (PMO) Dashboard in Excel?
A Project Management Office (PMO) Dashboard in Excel is a centralized reporting and monitoring tool that tracks project performance metrics in one place. Instead of reviewing dozens of project reports, emails, or spreadsheets, the PMO team views all key project indicators through interactive charts and KPIs.
Moreover, because the dashboard runs in Microsoft Excel, it remains flexible, cost-effective, and easy to maintain. As a result, organizations of all sizes prefer Excel-based PMO dashboards for portfolio-level visibility.
What Does a PMO Dashboard Track?
A PMO Dashboard in Excel typically tracks:
- Planned vs actual budget
- Planned vs actual duration
- Cost variance and variance percentage
- Project status and priority
- Department-wise and manager-wise performance
- Monthly trends for cost and budget
Because of this, PMO leaders can quickly identify risks, delays, and overruns before they impact business outcomes.Project Management Office (PMO) Dashboard in Excel
Why Do Organizations Need a PMO Dashboard in Excel?
Project-based organizations always handle multiple clients, departments, and project managers. However, without a centralized dashboard, tracking progress becomes reactive instead of proactive.
Key Reasons to Use a PMO Dashboard
- First, it provides real-time project visibility
- Second, it reduces manual reporting effort
- Third, it highlights cost overruns early
- Moreover, it supports data-driven decisions
- Finally, it improves stakeholder communication
Therefore, a PMO Dashboard in Excel acts as a single source of truth for all project-related insights.
How Does a PMO Dashboard in Excel Work?
A PMO Dashboard in Excel works by converting raw project data into visual insights. First, project-level data gets captured in structured tables. Then, pivot tables and charts summarize this data. Finally, slicers allow users to filter results by department, manager, client, priority, or time period.Project Management Office (PMO) Dashboard in Excel
Typical Workflow
- Enter or import project data into Excel
- Validate planned and actual values
- Calculate variances and averages
- Refresh pivot tables
- Analyze insights on dashboard pages
As a result, users always see updated insights with minimal effort.
Overview of the PMO Dashboard in Excel Structure
This ready-to-use PMO Dashboard in Excel includes multiple analytical sheet tabs. Each sheet focuses on a specific area of project performance. Therefore, users can drill down into details while maintaining a high-level overview.
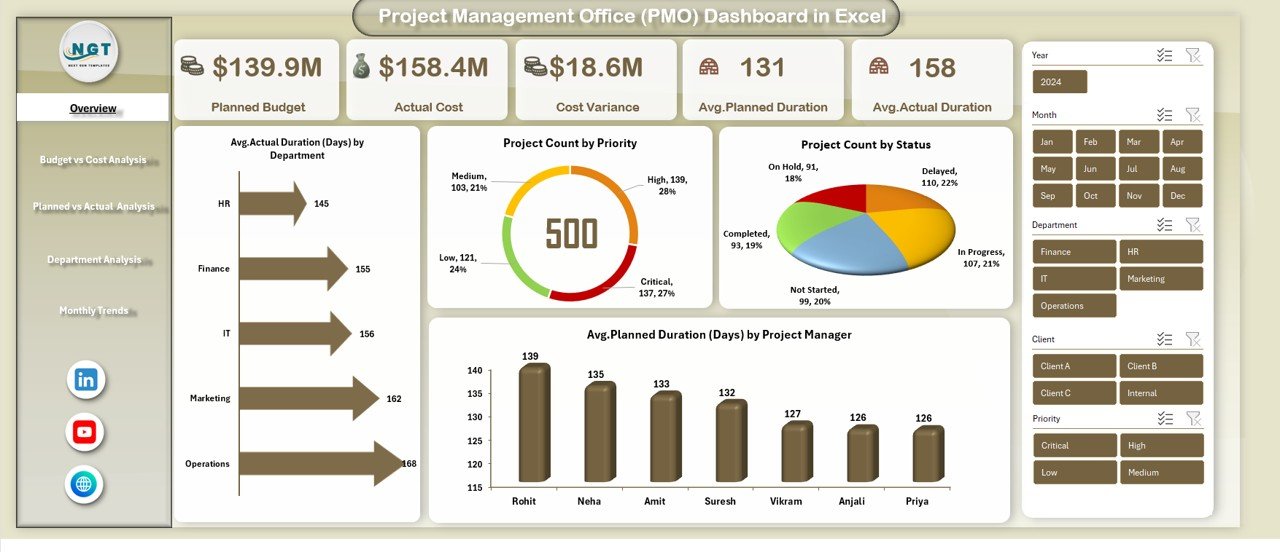
Overview Sheet Tab
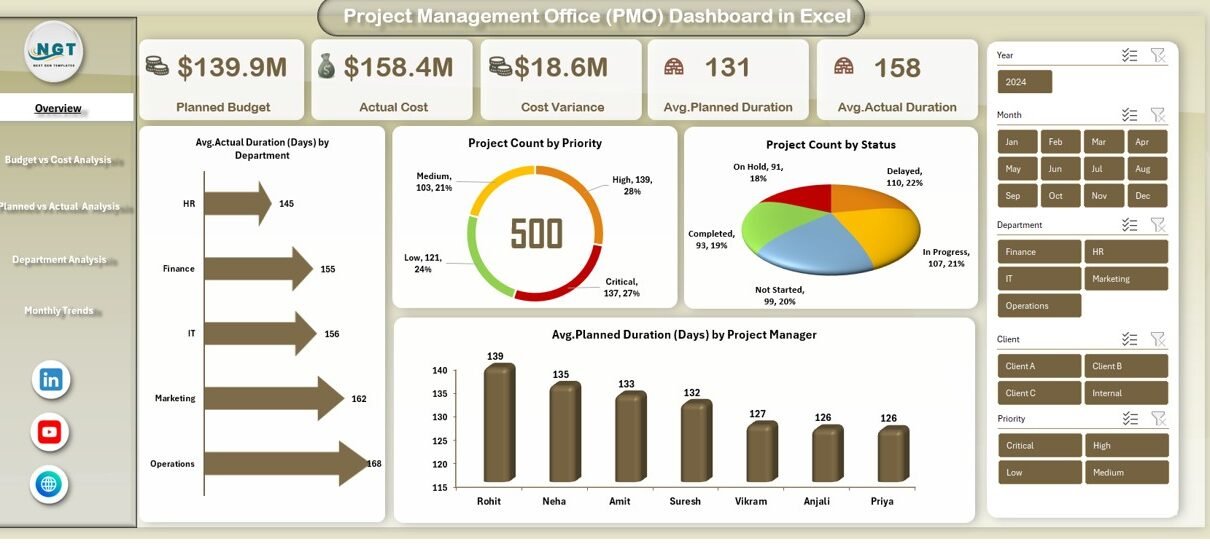
The Overview sheet acts as the main landing page of the PMO Dashboard. It summarizes overall project health at a glance.
Key KPIs and Visuals on the Overview Sheet
- Planned Budget
Shows the total approved budget for all projects. - Actual Cost
Displays the total cost incurred so far. - Cost Variance
Highlights the difference between planned budget and actual cost. - Average Planned Duration (Days)
Shows the average estimated duration across projects. - Average Actual Duration (Days)
Displays how long projects actually take on average. - Average Actual Duration (Days) by Department
Helps compare delivery speed across departments. - Project Count by Priority
Shows how many projects fall under high, medium, or low priority. - Project Count by Status
Displays ongoing, completed, delayed, or on-hold projects. - Average Planned Duration (Days) by Project Manager
Helps evaluate planning efficiency by project manager.
Because of this layout, stakeholders quickly understand overall performance without diving into raw data.
Click to buy Project Management Office (PMO) Dashboard in Excel
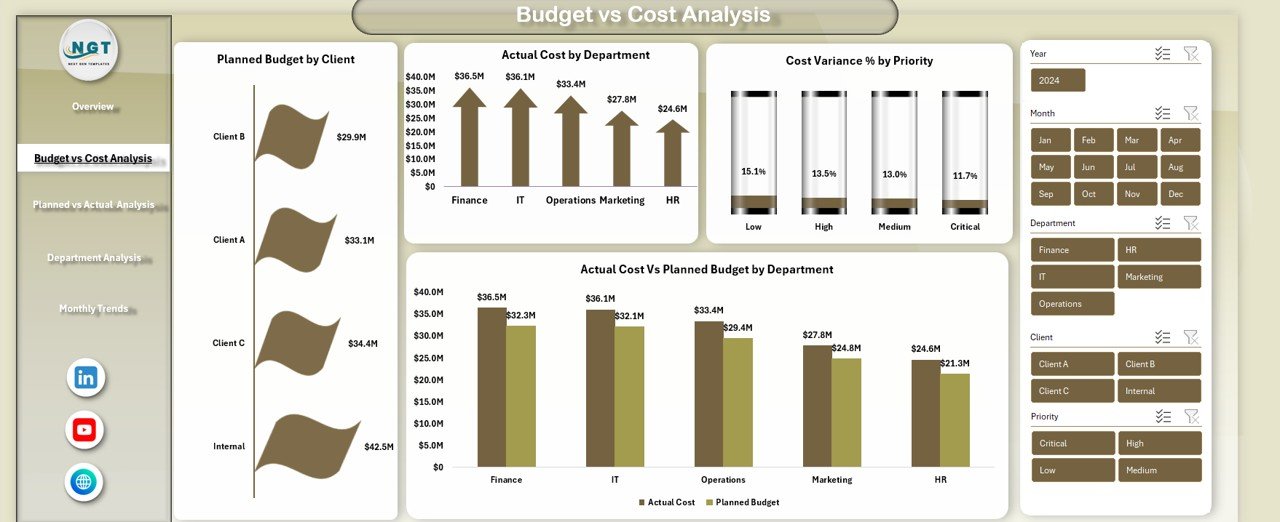
Budget vs Cost Analysis Sheet
The Budget vs Cost Analysis sheet focuses on financial control. It compares planned budgets with actual costs across multiple dimensions.
Insights Available in This Sheet
- Planned Budget by Client
Identifies high-value clients and budget distribution. - Actual Cost by Department
Shows which departments consume more resources. - Cost Variance % by Priority
Highlights financial risk across priority levels. - Actual Cost vs Planned Budget by Department
Reveals which departments overspend or underspend.
Therefore, this sheet supports better financial planning and cost optimization.
Click to buy Project Management Office (PMO) Dashboard in Excel
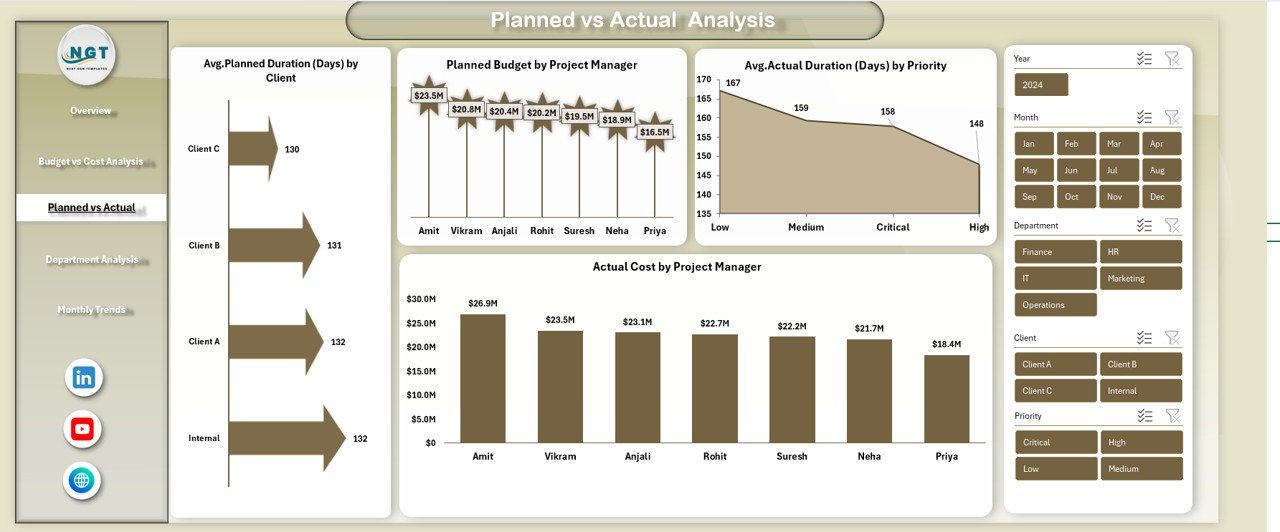
Planned vs Actual Analysis Sheet
The Planned vs Actual Analysis sheet focuses on schedule and cost comparison.
Key Visuals in This Section
- Planned Duration (Days) by Client
Helps evaluate client-specific timelines. - Planned Budget by Project Manager
Shows how budgets distribute across managers. - Actual Cost by Project Manager
Highlights spending patterns per manager. - Actual Duration (Days) by Priority
Reveals whether high-priority projects deliver faster.
As a result, PMO leaders can identify planning gaps and execution delays.
Click to buy Project Management Office (PMO) Dashboard in Excel
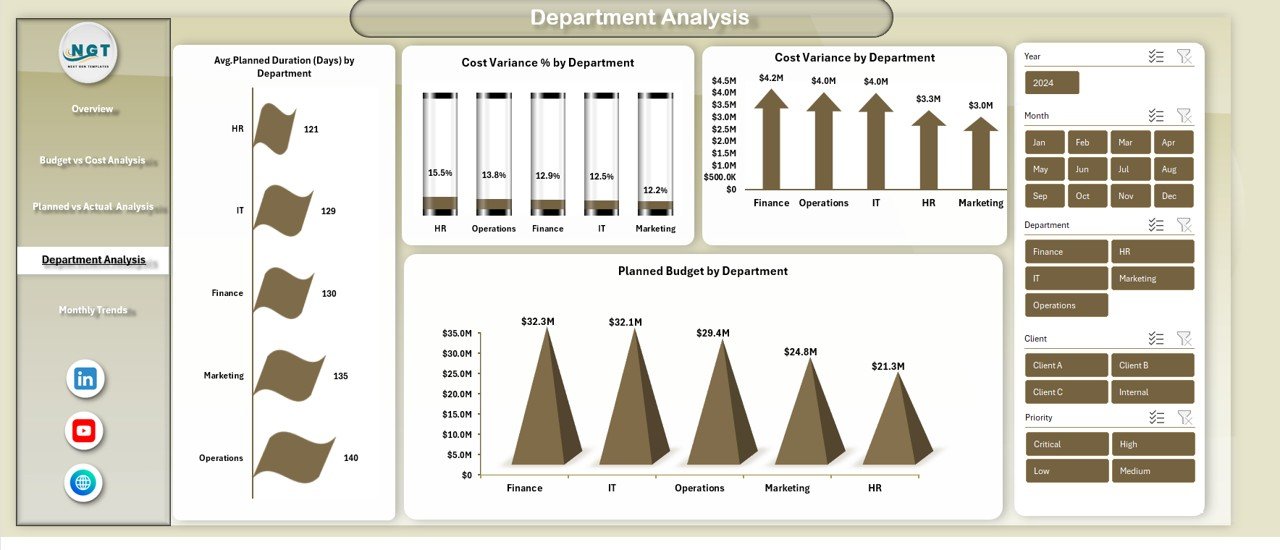
Department Analysis
The Department Analysis sheet provides department-level performance insights. This view helps leadership evaluate efficiency and accountability.
Metrics Included in Department Analysis
- Average Planned Duration (Days) by Department
- Cost Variance % by Department
- Cost Variance by Department
- Planned Budget by Department
Because of this, organizations can balance workloads and control departmental costs more effectively.
Click to buy Project Management Office (PMO) Dashboard in Excel
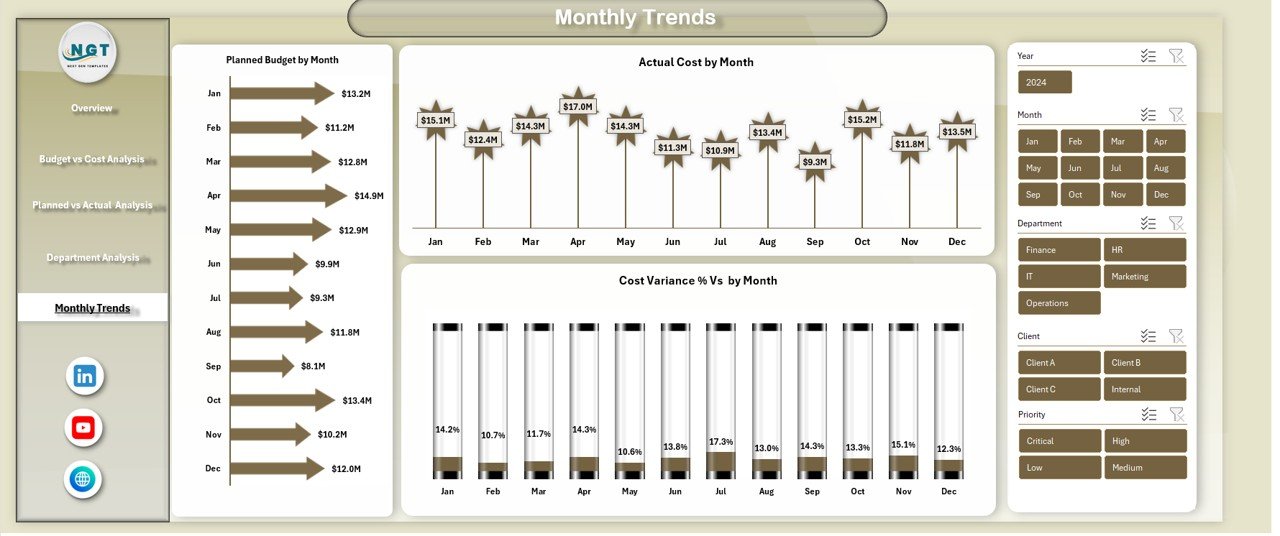
Monthly Trends
The Monthly Trends sheet tracks performance over time. Instead of static views, this section reveals patterns and seasonality.
Monthly Trend Visuals
- Planned Budget by Month
Shows how budgets distribute across months. - Actual Cost by Month
Highlights spending trends. - Cost Variance % by Month
Identifies months with high overruns.
Therefore, PMO teams can forecast risks and adjust future plans.
Click to buy Project Management Office (PMO) Dashboard in Excel
Advantages of Project Management Office (PMO) Dashboard in Excel
Using a PMO Dashboard in Excel delivers multiple benefits across the organization.
Key Advantages
- Centralized Project Visibility
All project metrics appear in one dashboard. - Time-Saving Reporting
Automated calculations reduce manual effort. - Better Cost Control
Variance analysis highlights overspending early. - Improved Decision-Making
Visual insights support faster actions. - Flexible and Customizable
Excel allows easy customization based on needs. - No Additional Software Cost
Works with standard Microsoft Excel.
Because of these advantages, Excel-based PMO dashboards remain highly popular.
Best Practices for the Project Management Office (PMO) Dashboard in Excel
Following best practices ensures accuracy, usability, and long-term success.
Best Practices You Should Follow
- Use consistent data formats across all sheets
- Keep raw data separate from dashboards
- Use clear KPI definitions
- Limit charts to meaningful insights
- Refresh data regularly
- Protect formulas and pivot tables
- Use slicers for easy filtering
- Maintain version control
As a result, your PMO Dashboard stays reliable and easy to use.
Who Can Use a PMO Dashboard in Excel?
A PMO Dashboard in Excel suits multiple roles and industries.
Ideal Users
- PMO Heads and Directors
- Project Managers
- Portfolio Managers
- Finance Teams
- Operations Leaders
- Consulting Firms
- IT and Engineering Organizations
Because Excel remains widely accessible, adoption becomes easy.
When Should You Implement a PMO Dashboard?
Organizations should implement a PMO Dashboard when:
- Project count increases
- Budgets become complex
- Stakeholders demand transparency
- Manual reporting consumes time
- Projects face frequent overruns
Therefore, early adoption always delivers better control.
Conclusion: Why a PMO Dashboard in Excel Is a Smart Choice
A Project Management Office (PMO) Dashboard in Excel transforms scattered project data into structured insights. Instead of reactive reporting, organizations gain proactive control over budgets, timelines, and performance. Moreover, the dashboard’s multiple analytical sheets—Overview, Budget vs Cost, Planned vs Actual, Department Analysis, and Monthly Trends—ensure complete portfolio visibility.
Because Excel remains flexible, affordable, and powerful, this dashboard becomes an ideal solution for organizations that want clarity without complexity.
Frequently Asked Questions (FAQs) About Project Management Office (PMO) Dashboard in Excel
What is the main purpose of a PMO Dashboard in Excel?
The main purpose is to provide centralized visibility into project performance, budgets, timelines, and risks.
Can small organizations use a PMO Dashboard in Excel?
Yes, small and mid-sized organizations benefit greatly because Excel offers low-cost implementation.
Does this dashboard require advanced Excel skills?
No, basic Excel knowledge is enough to use and maintain the dashboard.
How often should the PMO Dashboard be updated?
You should update it weekly or monthly, depending on project activity.
Can the dashboard handle multiple departments and managers?
Yes, the dashboard supports department-wise, manager-wise, and client-wise analysis.
Is the PMO Dashboard customizable?
Yes, Excel allows full customization of KPIs, charts, and layouts.
Does this dashboard support trend analysis?
Yes, the Monthly Trends sheet provides time-based insights.
Can this dashboard replace project management software?
While it does not replace full PM tools, it complements them with powerful reporting.
Visit our YouTube channel to learn step-by-step video tutorials
Watch the step-by-step video tutorial:
Click to buy Project Management Office (PMO) Dashboard in Excel