Vocational training plays a vital role in building job-ready skills across industries. Training institutes, skill development centers, NGOs, and corporate learning teams all rely on accurate data to evaluate training effectiveness. However, many organizations still manage training data using scattered spreadsheets, manual reports, and disconnected files. As a result, decision-making becomes slow, unclear, and error-prone.
That is exactly where a Vocational Training Dashboard in Excel makes a powerful difference.
In this in-depth guide, you will learn what a Vocational Training Dashboard in Excel is, why organizations need it, how it works, and how each dashboard page supports smarter training decisions. Moreover, you will explore its advantages, best practices, opportunities for improvement, and frequently asked questions—explained in simple and practical language.
Click to Purchases Vocational Training Dashboard in Excel
What Is a Vocational Training Dashboard in Excel?
A Vocational Training Dashboard in Excel is a ready-to-use, interactive reporting solution that transforms raw training data into meaningful insights. It visually tracks key metrics such as training progress, attendance, assessment scores, training duration, and fees—all in one centralized dashboard.
Instead of reviewing long Excel tables or static reports, users can analyze training performance through dynamic charts, slicers, and summary cards. Consequently, training managers can make faster and more confident decisions.
This dashboard uses Excel’s native features such as Pivot Tables, Pivot Charts, slicers, and formulas. Therefore, it does not require advanced technical skills or external tools.
Why Do Training Institutes Need a Vocational Training Dashboard in Excel?
Training institutes handle large volumes of data every month. They track learners, courses, trainers, attendance, assessments, and payments. However, when teams rely on manual tracking, several challenges appear.
Here is why a Vocational Training Dashboard in Excel becomes essential:
-
Training data stays scattered across multiple sheets
-
Performance tracking takes too much time
-
Management lacks real-time visibility
-
Reporting errors increase
-
Decision-making slows down
However, when organizations adopt a structured Excel dashboard, they centralize data, automate analysis, and improve transparency. As a result, training quality and operational efficiency improve significantly.
How Does a Vocational Training Dashboard in Excel Work?
The dashboard connects directly to a structured data sheet. Once users update the data, all charts and metrics refresh automatically. Moreover, slicers allow users to filter data by month, training center, course category, or trainer name.
The dashboard also includes a Page Navigator, located on the left side. This feature enables smooth navigation between analytical pages without scrolling through multiple sheets. Consequently, users save time and focus only on the insights they need.
What Are the Key Features of the Vocational Training Dashboard in Excel?
This ready-to-use dashboard includes several powerful features designed for clarity and ease of use.
✔ Page Navigator for Easy Navigation
The Page Navigator appears on the left side of the dashboard. It allows users to move instantly between different analysis pages. Therefore, users avoid confusion and improve productivity.
✔ Right-Side Slicers for Interactive Analysis
Each page includes slicers on the right side. These slicers help users filter data dynamically by relevant dimensions such as month, training center, course category, or trainer name.
✔ KPI Cards for Quick Insights
The Overview page includes KPI cards that highlight key performance indicators. These cards give decision-makers instant visibility into overall training performance.
✔ Pivot-Based Charts
All charts rely on Pivot Tables and Pivot Charts. As a result, users can modify data, add records, or adjust filters without breaking the dashboard.
What Insights Does the Overview Page Provide?
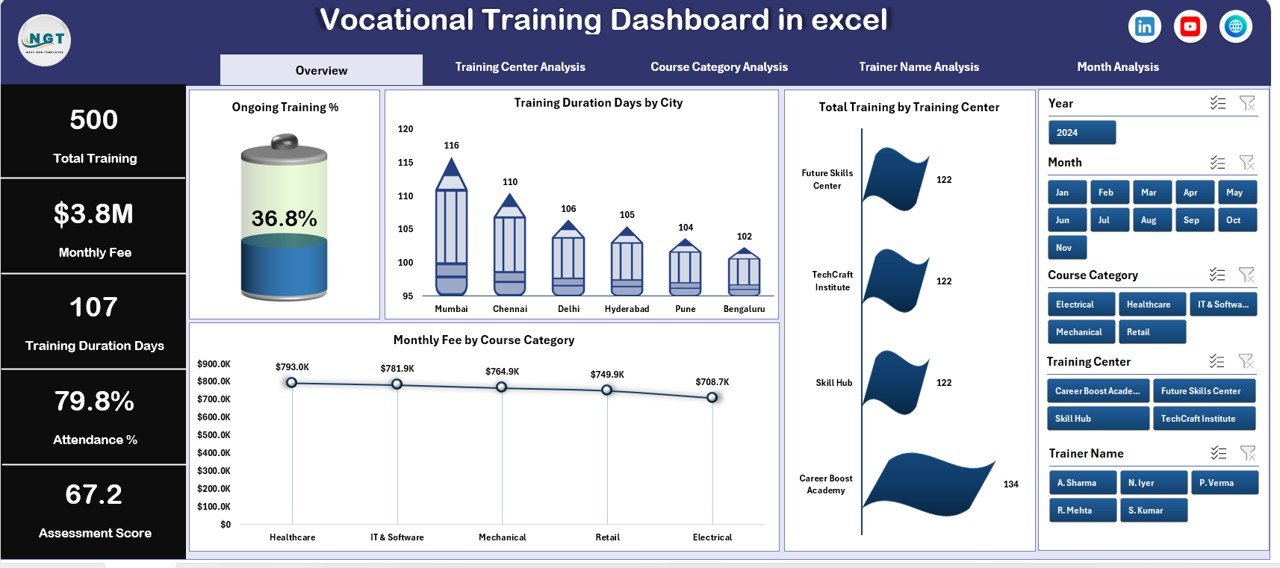
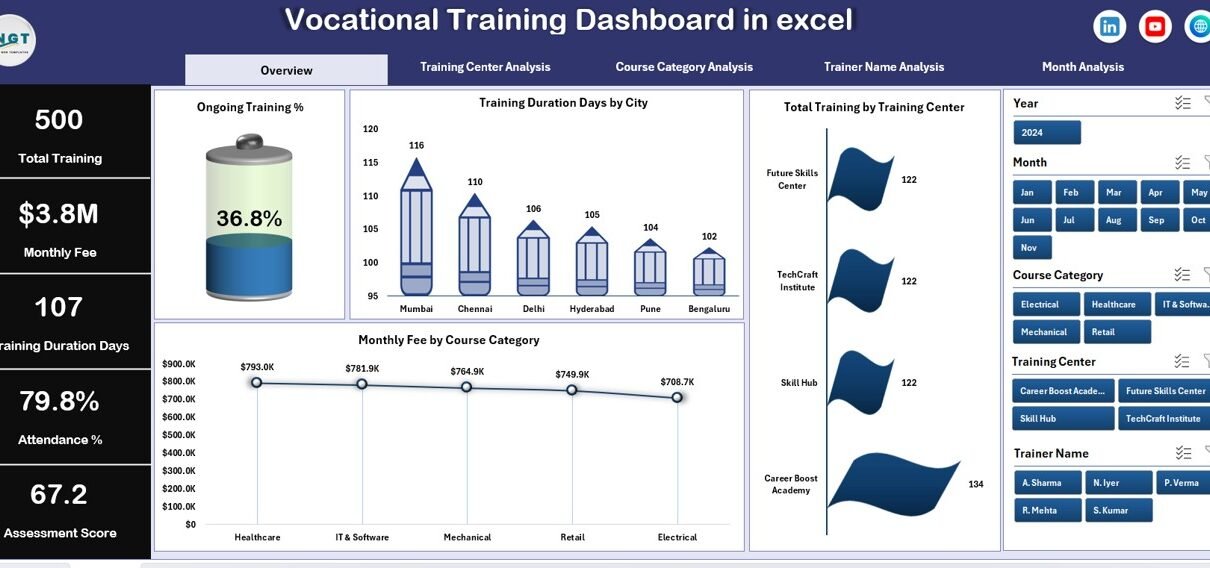
The Overview Page serves as the main control center of the dashboard. It presents a high-level snapshot of vocational training performance.
Key Elements of the Overview Page
-
Ongoing Training %
This metric shows how many trainings remain active. It helps management monitor current workload and capacity. -
Training Duration Days by City
This chart compares training duration across different cities. As a result, planners can identify regions with longer or shorter programs. -
Total Training by Training Center
This visual highlights how many training programs each center delivers. It supports performance comparison across centers. -
Monthly Fee by Course Category
This chart tracks revenue trends by course category. Therefore, institutes can identify high-value programs quickly. -
Click to Purchases Vocational Training Dashboard in Excel
Together, these visuals give stakeholders a clear overview before they dive deeper into detailed analysis.
How Does the Training Center Analysis Page Help Decision-Makers?
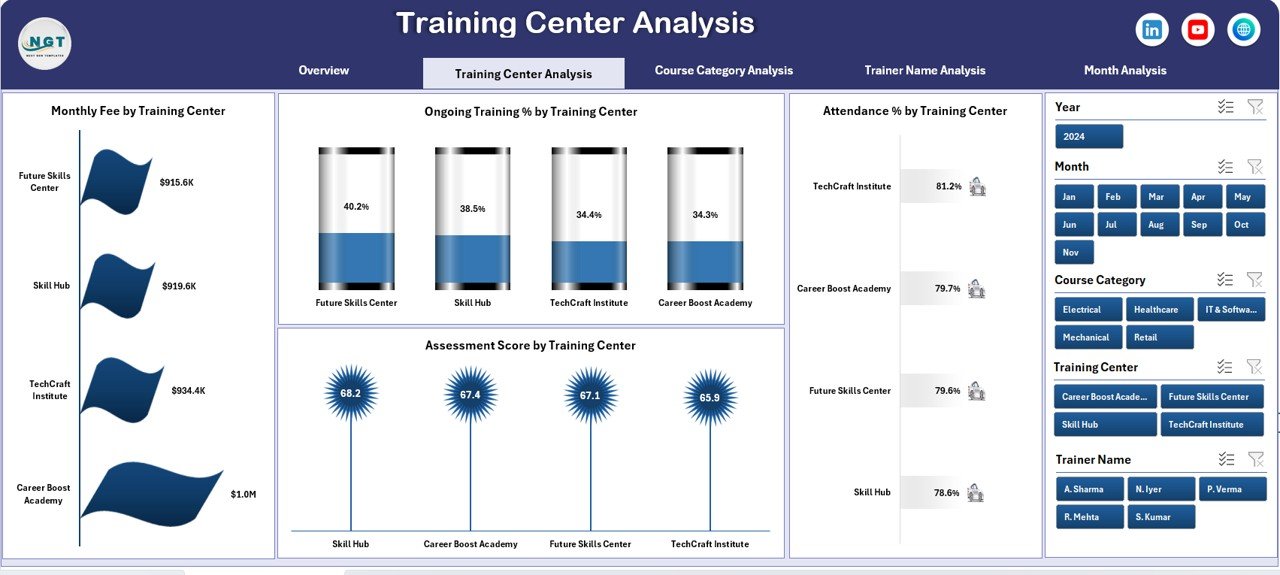
The Training Center Analysis page focuses on performance at the center level. It helps management compare centers based on engagement, outcomes, and revenue.
Key Charts on the Training Center Analysis Page
-
Monthly Fee by Training Center
This chart shows which centers generate the highest revenue. As a result, financial planning becomes easier. -
Ongoing Training % by Training Center
This metric highlights operational load at each center. Therefore, managers can balance resources effectively. -
Attendance % by Training Center
Attendance plays a critical role in training success. This chart helps identify centers that require engagement improvement. -
Assessment Score by Training Center
This visual compares learning outcomes across centers. Consequently, quality gaps become visible.
By using this page, decision-makers can quickly identify top-performing centers and areas needing improvement.
Why Is Course Category Analysis Important?
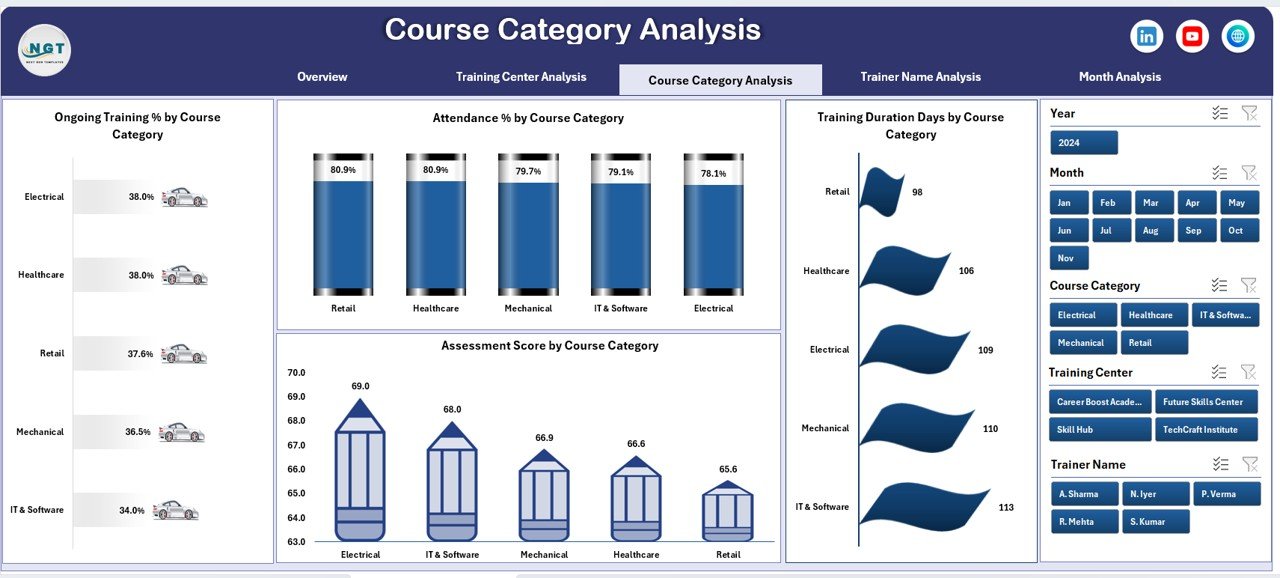
Different course categories perform differently. Some courses attract more learners, while others deliver better outcomes. Therefore, analyzing performance by course category becomes crucial.
Key Charts on the Course Category Analysis Page
-
Ongoing Training % by Course Category
This chart shows how many learners remain active in each category. -
Attendance % by Course Category
This visual highlights learner engagement across categories. -
Training Duration Days by Course Category
This metric helps institutes evaluate whether course durations align with outcomes. -
Assessment Score by Course Category
This chart compares learning effectiveness across programs.
As a result, institutes can refine course offerings and improve curriculum design.
How Does Trainer Name Analysis Improve Training Quality?
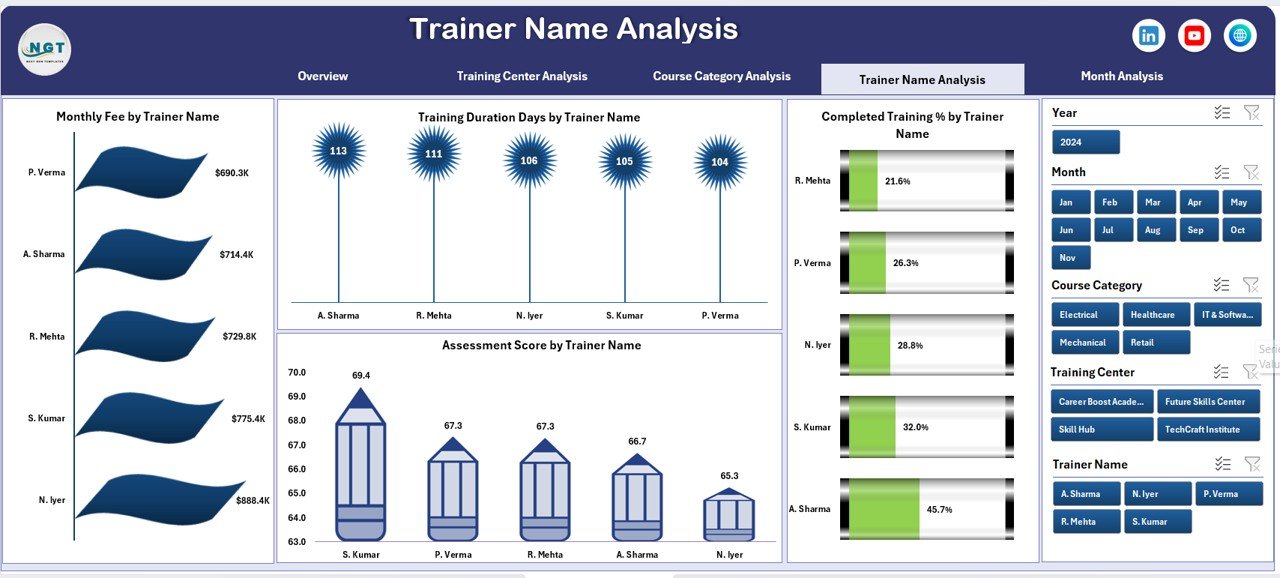
Trainers directly influence learner outcomes. Therefore, analyzing trainer-level performance helps organizations maintain training quality.
Key Charts on the Trainer Name Analysis Page
-
Monthly Fee by Trainer Name
This chart shows revenue contribution by trainer-led programs. -
Training Duration Days by Trainer Name
This visual helps evaluate efficiency and delivery style. -
Completed Training % by Trainer Name
Completion rates reflect learner satisfaction and trainer effectiveness. -
Assessment Score by Trainer Name
This metric highlights trainers who deliver strong learning outcomes.
With this analysis, institutes can recognize high-performing trainers and support those who need improvement.
What Does the Month Analysis Page Reveal?
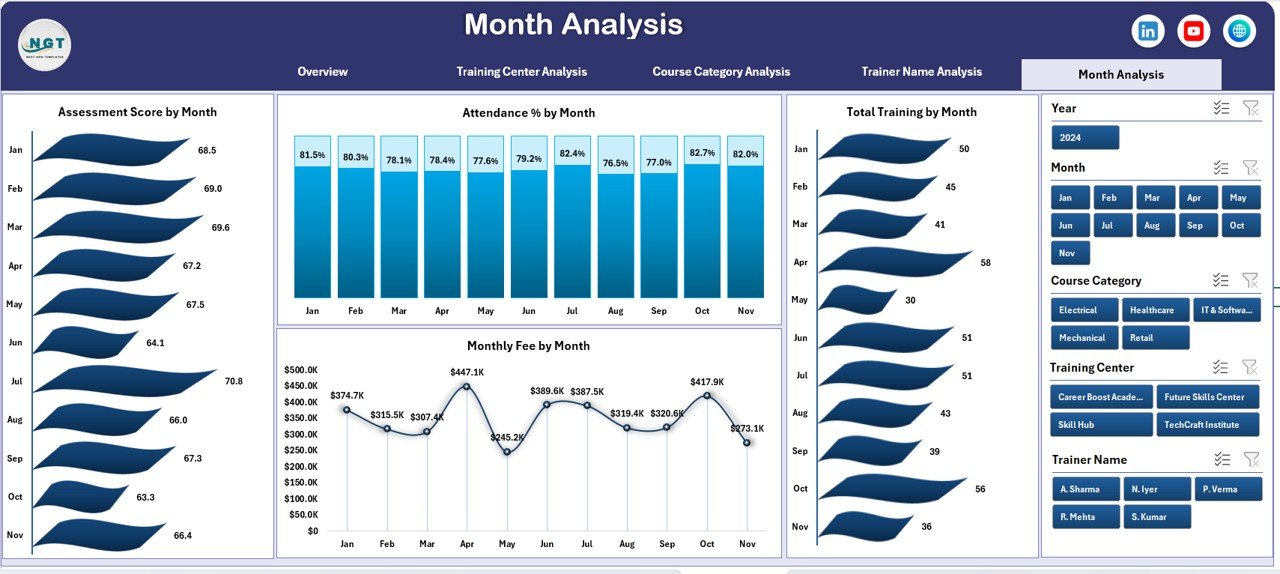
Trends over time matter just as much as static performance. The Month Analysis page tracks how training metrics evolve month by month.
Key Charts on the Month Analysis Page
-
Assessment Score by Month
This chart shows whether learning outcomes improve or decline over time. -
Attendance % by Month
This visual helps identify seasonal patterns in learner engagement. -
Total Training by Month
This metric tracks training volume growth. -
Monthly Fee by Month
This chart highlights revenue trends across months.
Therefore, organizations can plan future training cycles more effectively.
How Does the Data Sheet Support the Dashboard?
Click to Purchases Vocational Training Dashboard in Excel
The Data Sheet acts as the foundation of the entire dashboard. It stores all raw records such as:
-
Training center name
-
Course category
-
Trainer name
-
City
-
Training duration
-
Attendance percentage
-
Assessment score
-
Monthly fee
-
Training status
-
Training month
Once users update this sheet, all Pivot Tables and charts refresh automatically. As a result, reporting remains accurate and up to date.
Advantages of Vocational Training Dashboard in Excel
Using a Vocational Training Dashboard in Excel delivers multiple business and operational benefits.
-
✅ Centralizes all training data in one place
-
✅ Improves visibility across centers, courses, and trainers
-
✅ Saves time on manual reporting
-
✅ Enhances decision-making with visual insights
-
✅ Requires no advanced technical skills
-
✅ Works seamlessly with existing Excel workflows
-
✅ Supports scalability as data grows
Because of these advantages, Excel dashboards remain a preferred choice for training organizations worldwide.
Opportunities for Improvement in Vocational Training Dashboards
Although the dashboard offers strong capabilities, organizations can enhance it further.
-
Add learner demographic analysis
-
Track placement or certification outcomes
-
Include trainer workload metrics
-
Integrate budget vs actual cost analysis
-
Automate data imports using Power Query
By continuously improving the dashboard, institutes can extract even more value from their data.
Best Practices for the Vocational Training Dashboard in Excel
To maximize dashboard effectiveness, organizations should follow these best practices.
✔ Maintain Clean Data
Always validate data before updating the Data Sheet. Clean data ensures accurate insights.
✔ Use Consistent Naming
Standardize names for training centers, courses, and trainers. This practice avoids duplicate values in Pivot Tables.
✔ Refresh Pivot Tables Regularly
After updating data, refresh all Pivot Tables to keep visuals accurate.
✔ Limit Manual Edits on Charts
Avoid editing Pivot Charts manually. Instead, adjust data or Pivot settings.
✔ Train Users on Slicers
Ensure users understand how slicers work. As a result, they can explore insights independently.
Who Should Use a Vocational Training Dashboard in Excel?
This dashboard suits a wide range of users, including:
-
Vocational training institutes
-
Skill development centers
-
Government-funded training programs
-
Corporate learning and development teams
-
NGOs running employment initiatives
-
Educational consultants
Because Excel remains widely available, adoption becomes easy and cost-effective.
Conclusion: Why Should You Use a Vocational Training Dashboard in Excel?
A Vocational Training Dashboard in Excel transforms complex training data into clear, actionable insights. It empowers organizations to monitor performance, improve training quality, and optimize resources—all from one interactive dashboard.
By using structured data, dynamic slicers, and Pivot-based visuals, training managers gain full control over their reporting. As a result, they make faster decisions, improve learner outcomes, and enhance operational efficiency.
If you want a practical, scalable, and easy-to-use analytics solution, this dashboard offers everything you need.
Frequently Asked Questions About Vocational Training Dashboard in Excel
❓ Can beginners use a Vocational Training Dashboard in Excel?
Yes, beginners can use it easily. The dashboard relies on standard Excel features such as slicers and Pivot Charts.
❓ Does this dashboard require macros or VBA?
No, it does not require macros or VBA. It works entirely with native Excel functionality.
❓ Can I customize the dashboard for my institute?
Yes, you can customize charts, metrics, and layouts to match your specific requirements.
❓ How often should I update the data?
You should update data monthly or weekly, depending on your reporting needs.
❓ Can this dashboard handle large datasets?
Yes, Excel can handle thousands of records efficiently when structured properly.
❓ Does the dashboard support multiple training centers?
Yes, it supports unlimited training centers through dynamic filtering.
Visit our YouTube channel to learn step-by-step video tutorials
Click to Purchases Vocational Training Dashboard in Excel
Watch the step-by-step video tutorial: