In today’s competitive market, businesses must move fast. Markets change quickly. Customer preferences shift constantly. Costs rise unexpectedly. Therefore, companies must track performance in real time.
However, many organizations still depend on scattered spreadsheets. As a result, they miss trends. They delay decisions. They struggle to identify profitable regions, sales channels, and product categories.
So, how can you track revenue, COGS, profit, marketing spend, and total units sold in one powerful system?
The answer is simple.
You need a Business Growth Dashboard in Power BI.
In this comprehensive guide, you will learn:
- What a Business Growth Dashboard in Power BI is
- Why growing businesses need it
- Detailed explanation of all 5 dashboard pages
- Key performance metrics to track
- Advantages of Business Growth Dashboard in Power BI
- Best Practices for the Business Growth Dashboard
- Frequently Asked Questions with Answers
Click to buy Business Growth Dashboard in Power BI
What Is a Business Growth Dashboard in Power BI?
A Business Growth Dashboard in Power BI is an interactive analytics tool that helps organizations monitor and improve performance.
It combines financial, operational, and marketing data into one structured report. Therefore, leaders can track growth indicators instantly.
Instead of opening multiple reports, you can:
- Monitor revenue trends
- Compare COGS across regions
- Analyze profit margins
- Track marketing effectiveness
- Measure total units sold
Because Power BI offers dynamic slicers and filters, users can analyze data by region, category, sales channel, and month with just one click.
Why Do Businesses Need a Growth Dashboard?
Every business wants growth. However, growth requires clarity.
Without a structured dashboard:
- Teams rely on manual reports
- Managers wait for updates
- Executives guess performance trends
On the other hand, a Power BI dashboard delivers:
- Real-time visibility
- Interactive analysis
- Data-driven decision-making
- Clear performance comparison
Therefore, companies improve strategy faster and reduce risk.
Pages Included in the Business Growth Dashboard in Power BI
This Business Growth Dashboard contains 5 structured pages. Each page focuses on a specific business area.
Let’s examine each page in detail.
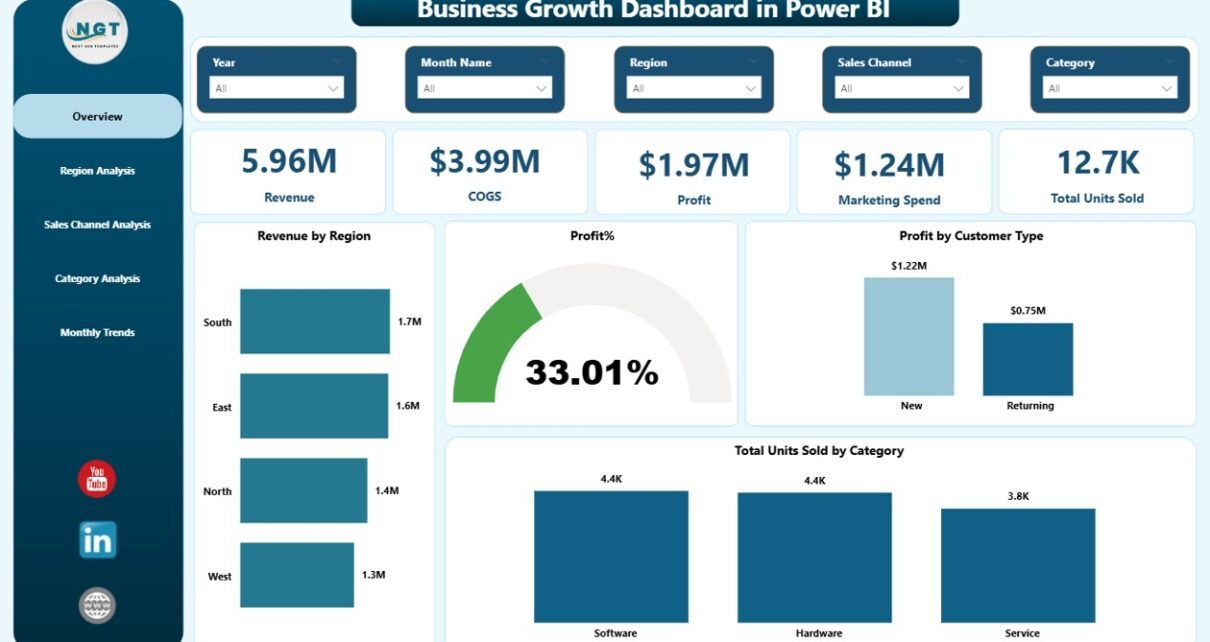
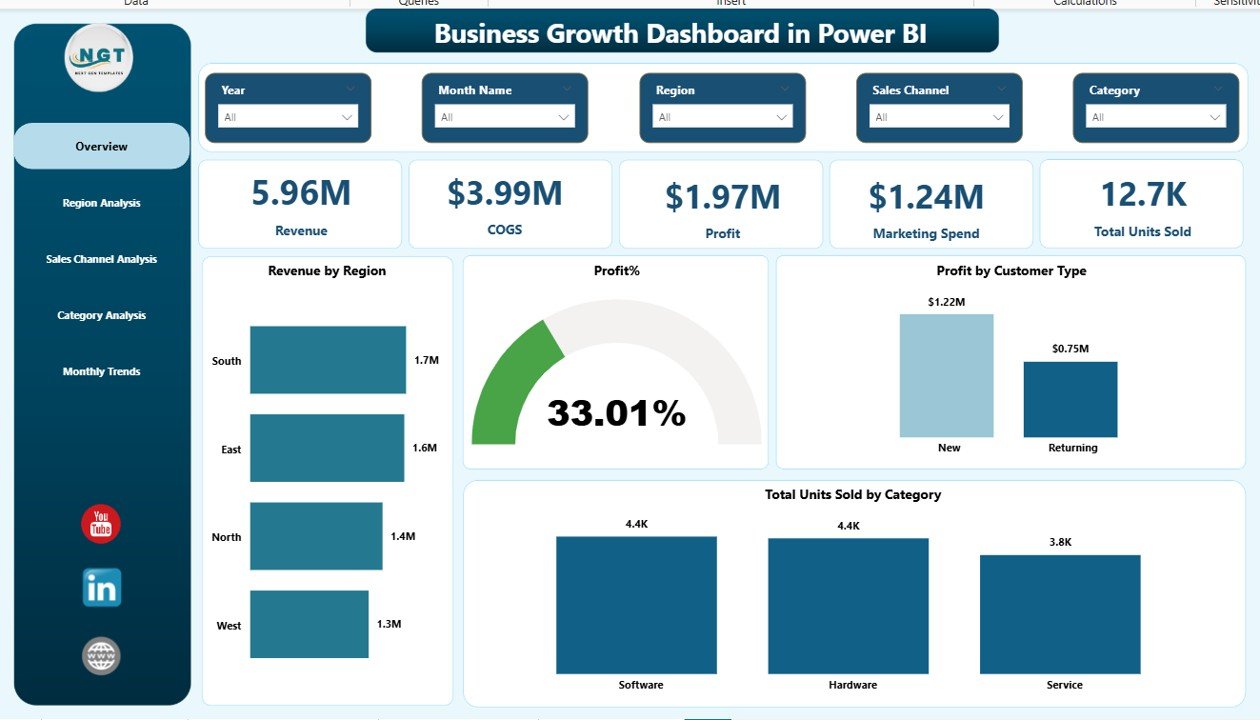
Overview Page – How Is the Business Performing Overall?
The Overview Page acts as the control center. It provides a high-level summary of the entire business.
KPI Cards Included:
- Revenue
- COGS (Cost of Goods Sold)
- Profit
- Marketing Spend
- Total Units Sold
These cards instantly show current performance.
Charts Included:
- Revenue by Region
- Profit %
- Total Units Sold by Category
- Profit by Customer Type
Because this page displays critical metrics in one place, decision-makers can identify growth direction quickly.
For example:
- If revenue increases but profit drops, leaders can review COGS immediately.
- If marketing spend rises but units sold stay flat, managers can adjust campaigns.
Therefore, the Overview page saves time and improves clarity.
Click to buy Business Growth Dashboard in Power BI
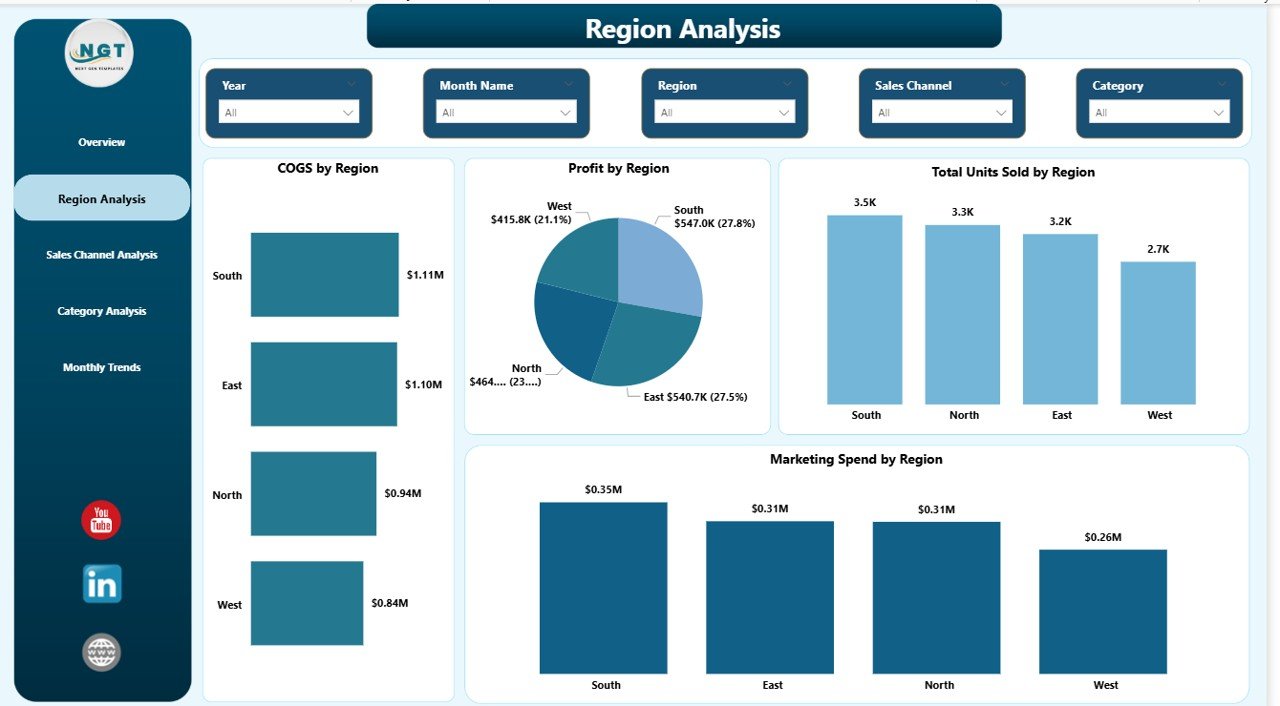
Region Analysis – Which Region Drives Maximum Growth?
Regional performance plays a major role in business growth.
The Region Analysis page allows managers to compare performance across locations.
Key Charts:
- COGS by Region
- Profit by Region
- Total Units Sold by Region
- Marketing Spend by Region
Because regions perform differently, this page helps leaders:
- Identify high-performing regions
- Detect low-profit regions
- Optimize marketing budget allocation
- Improve supply chain planning
For example, if one region generates high revenue but low profit, managers can investigate cost structure. Meanwhile, if another region delivers strong margins, leaders can replicate its strategy.
Therefore, this page supports geographic growth planning.
Click to buy Business Growth Dashboard in Power BI
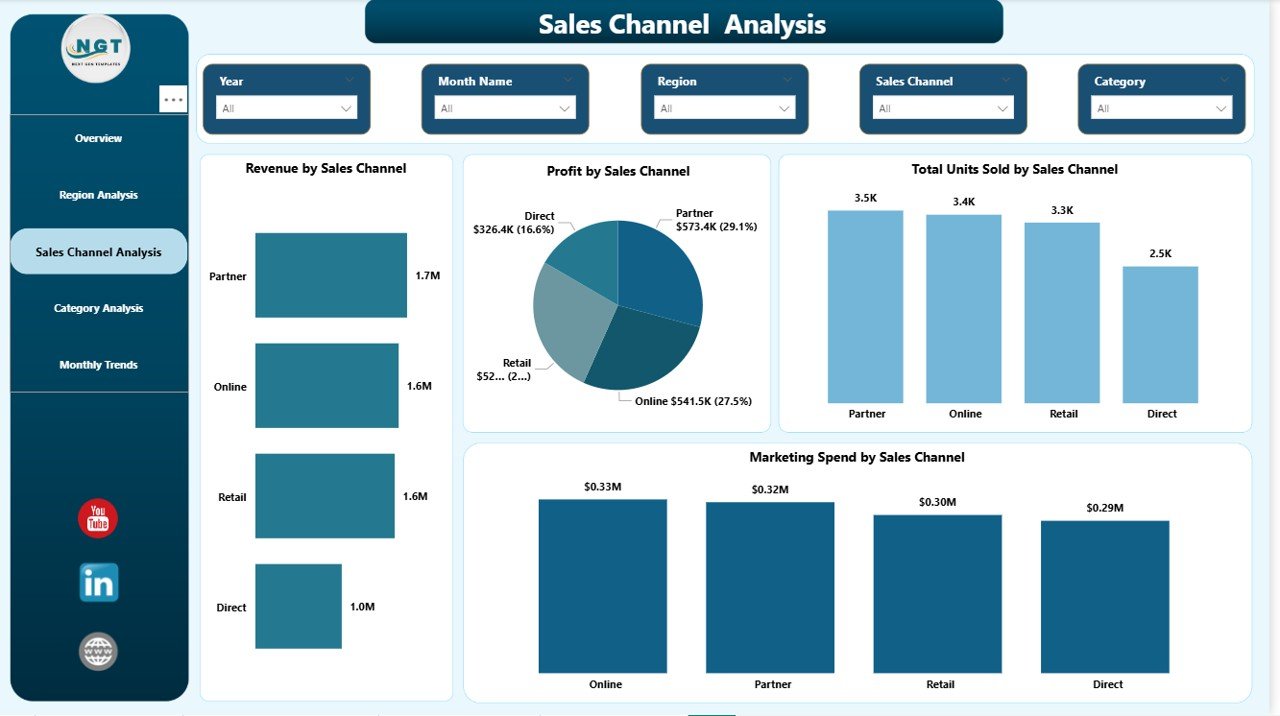
Sales Channel Analysis – Which Channel Performs Best?
Today, businesses sell through multiple channels:
- Online
- Retail
- Distributor
- Wholesale
- Direct Sales
However, not all channels perform equally.
This page includes:
- Revenue by Sales Channel
- Profit by Sales Channel
- Total Units Sold by Sales Channel
Because channel performance impacts strategy, this page helps you:
- Focus on profitable channels
- Improve underperforming channels
- Adjust pricing strategy
- Optimize inventory allocation
For instance, if online sales grow faster than retail, management can increase digital marketing investment.
Therefore, Sales Channel Analysis drives smarter expansion.
Click to buy Business Growth Dashboard in Power BI
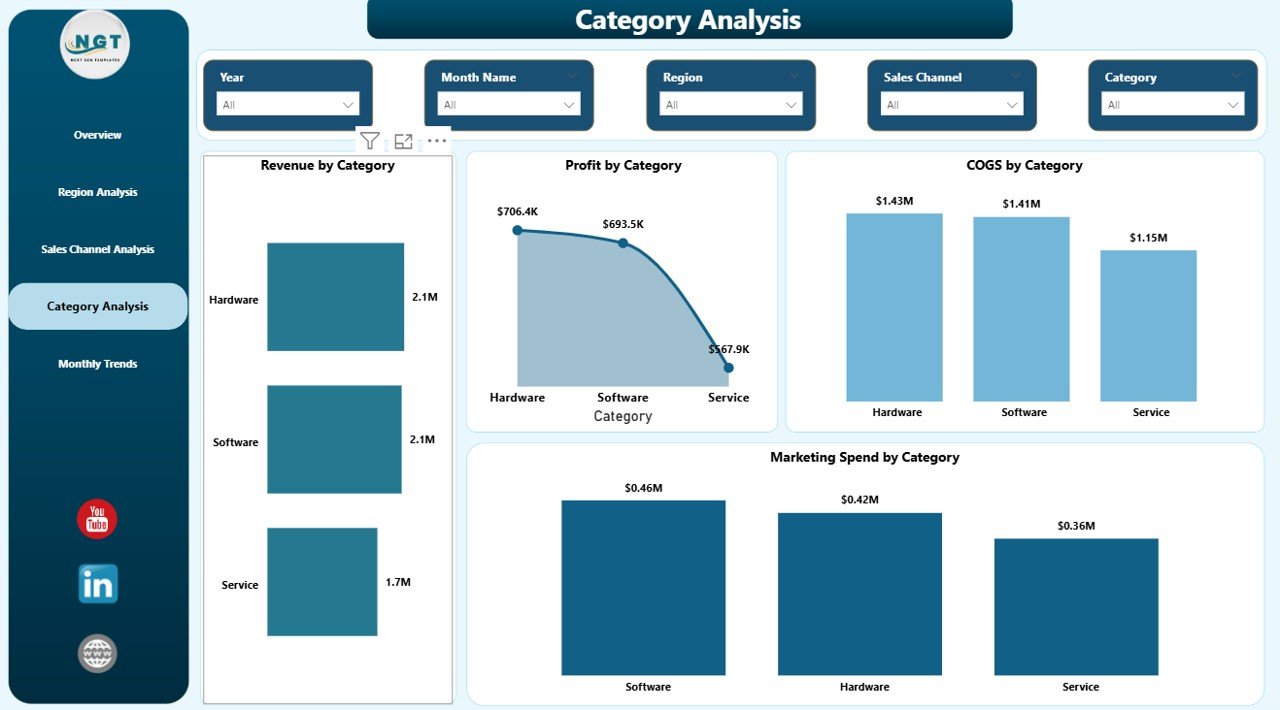
Category Analysis – Which Products Generate Maximum Profit?
Product categories directly impact growth.
The Category Analysis page includes:
- Revenue by Category
- Profit by Category
- COGS by Category
- Marketing Spend by Category
Because every category has different cost and demand patterns, this page helps:
- Identify high-margin products
- Remove low-performing products
- Improve pricing strategy
- Adjust marketing focus
For example, if one category consumes high marketing spend but delivers low profit, leaders can optimize budget allocation.
Therefore, this page improves product portfolio decisions.
Click to buy Business Growth Dashboard in Power BI
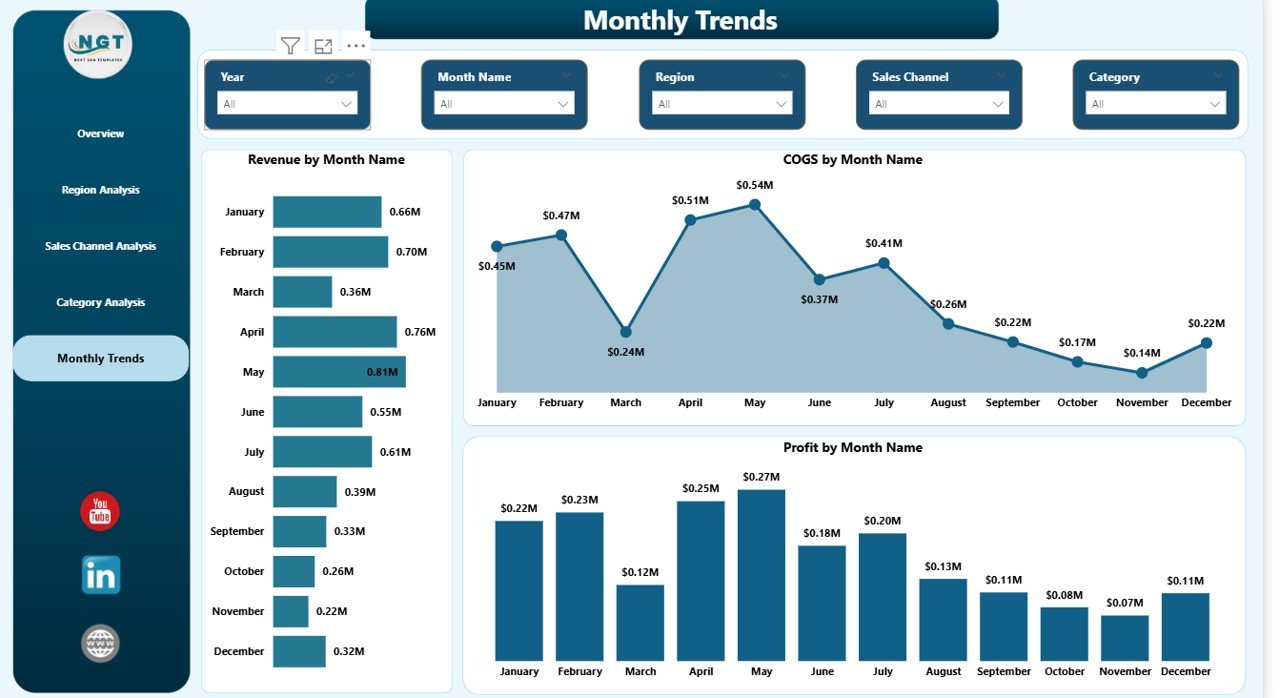
Monthly Trends – Is Growth Consistent Over Time?
Growth requires consistency.
The Monthly Trends page includes:
- Revenue by Month
- COGS by Month
- Profit by Month
Because trends reveal patterns, this page helps you:
- Identify seasonal demand
- Detect sudden cost increases
- Measure marketing impact
- Forecast future growth
For example, if revenue peaks in Q4, teams can prepare inventory early. Meanwhile, if COGS spikes unexpectedly, finance teams can investigate suppliers.
Therefore, this page supports long-term planning.
Click to buy Business Growth Dashboard in Power BI
Key Metrics in a Business Growth Dashboard
Let’s understand the core metrics in detail.
Revenue
Revenue shows total sales income. It measures market demand and pricing effectiveness.
COGS (Cost of Goods Sold)
COGS represents direct production costs. It impacts gross profit directly.
Profit
Profit = Revenue – COGS – Marketing Spend
It measures real business success.
Marketing Spend
Marketing Spend tracks promotional investment. It shows campaign efficiency.
Total Units Sold
Units sold reflect sales volume and customer demand.
Profit %
Profit % = Profit ÷ Revenue × 100
It measures operational efficiency.
Advantages of Business Growth Dashboard in Power BI
Now let’s explore why businesses benefit from this dashboard.
Real-Time Insights
You see updated data instantly. Therefore, you act faster.
Interactive Analysis
You use slicers and filters to analyze specific segments.
Better Financial Control
You monitor revenue, COGS, and profit together.
Smart Marketing Decisions
You compare marketing spend with revenue growth.
Improved Regional Strategy
You identify top-performing locations quickly.
Data-Driven Leadership
You replace assumptions with facts.
Faster Reporting
You eliminate manual Excel reporting delays.
Best Practices for the Business Growth Dashboard
To maximize value, follow these best practices:
Keep Data Clean
Use structured data tables.
Update Data Regularly
Schedule weekly or monthly refresh.
Use Clear Visuals
Avoid overcrowded charts.
Track KPIs Consistently
Focus on 5–10 core metrics.
Compare Periods
Always analyze current vs previous month.
Train Your Team
Ensure managers understand dashboard usage.
How Does Power BI Improve Growth Tracking?
Power BI offers powerful features such as:
- Drill-through analysis
- Dynamic slicers
- Data modeling
- DAX calculations
- Cloud sharing
Because of these features, businesses analyze millions of rows easily.
For example:
A company tracking 50,000 transactions monthly can view trends instantly using Power BI visuals.
Who Can Use This Dashboard?
This dashboard works for:
- Small Businesses
- Medium Enterprises
- Large Corporations
- Sales Managers
- Finance Teams
- Marketing Leaders
- Business Analysts
Therefore, any organization focused on growth can benefit.
How to Implement a Business Growth Dashboard in Power BI?
Follow these simple steps:
- Collect structured data
- Import data into Power BI
- Create relationships
- Build measures using DAX
- Design dashboard pages
- Add slicers
- Publish to Power BI Service
Within 1–2 weeks, businesses can launch a complete growth dashboard.
Conclusion
Every growing business needs clarity. Without clear insights, companies lose opportunities. However, a Business Growth Dashboard in Power BI provides structured visibility.
It tracks revenue, COGS, profit, marketing spend, and units sold in one place.
Moreover, it helps leaders:
- Identify growth drivers
- Improve profit margins
- Optimize marketing budgets
- Monitor regional performance
- Analyze trends over time
Therefore, businesses make smarter and faster decisions.
If you want sustainable growth, you should implement this dashboard today.
Frequently Asked Questions with Answers
- What is a Business Growth Dashboard in Power BI?
It is an interactive reporting tool that tracks revenue, profit, COGS, marketing spend, and units sold.
- How often should I update the dashboard?
You should update it weekly or monthly depending on business volume.
- Can small businesses use this dashboard?
Yes. Small businesses benefit significantly because it simplifies decision-making.
- Does Power BI require coding?
You use basic DAX formulas, but you do not need advanced programming.
- How long does it take to build this dashboard?
You can build a structured dashboard within 1–2 weeks.
- Can I share the dashboard with my team?
Yes. You can publish it to Power BI Service and share securely.
Visit our YouTube channel to learn step-by-step video tutorials
Watch the step-by-step video tutorial:
Click to buy Business Growth Dashboard in Power BI