Road and highway construction projects demand precision. Costs rise fast. Deadlines shift often. Resources move across regions. Therefore, project leaders need complete visibility at every stage.
However, many companies still depend on scattered Excel files and manual reports. As a result, managers struggle to track material cost, equipment expenses, labor spending, and budget performance in real time.
So, how can construction companies monitor performance clearly and make faster decisions?
The answer is simple.
Click to Purchases Road and Highway Construction Dashboard in Power BI
You need a Road and Highway Construction Dashboard in Power BI.
This ready-to-use dashboard helps construction managers track cost, completion percentage, regional performance, project manager efficiency, and monthly trends — all in one powerful Power BI file.
Let us explore everything step by step.
🛣 What Is a Road and Highway Construction Dashboard in Power BI?
A Road and Highway Construction Dashboard in Power BI is an interactive reporting system designed for infrastructure and construction companies. It transforms raw project data into dynamic visual insights.
Instead of reviewing multiple spreadsheets, you can:
-
Track Material Cost
-
Monitor Equipment Cost
-
Analyze Labor Cost
-
Compare Actual vs Budget
-
Measure Completion Percentage
-
Review Performance by Region
-
Evaluate Project Manager Performance
-
Analyze Highway Type Cost Distribution
-
Study Monthly Trends
Because Power BI allows dynamic filtering through slicers, you can instantly switch views by highway type, region, month, or project manager.
As a result, decision-making becomes faster and more accurate.
📊 How Is This Dashboard Structured?
This dashboard includes 5 powerful analytical pages. Each page focuses on a specific angle of project performance.
Let us examine each page in detail.
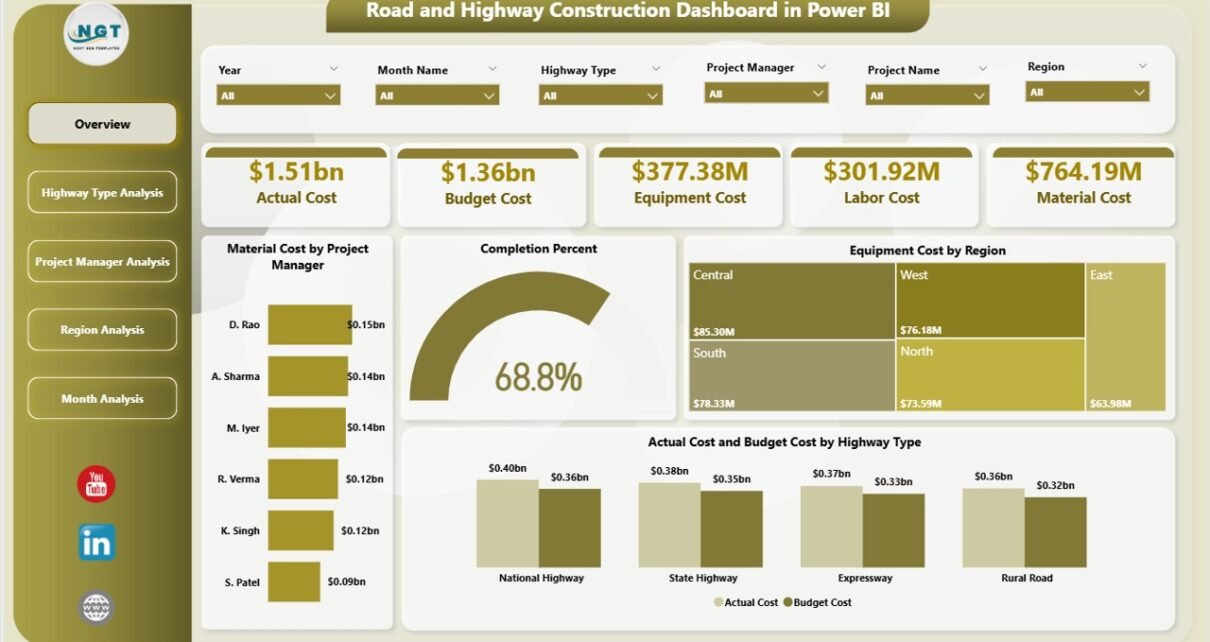
1️⃣ Overview Page – The Command Center
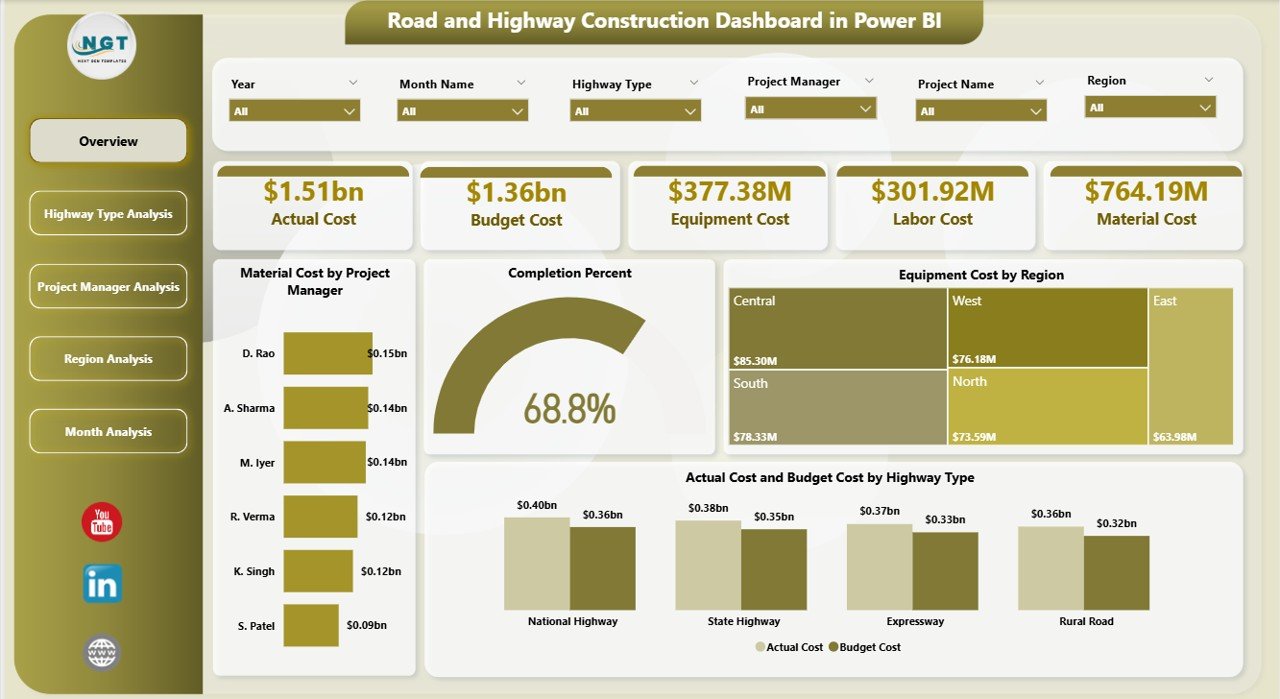
The Overview Page works as the central control panel. It provides a quick snapshot of overall project health.
🔹 Key Features of Overview Page:
-
Interactive Slicers (for filtering data instantly)
-
5 KPI Cards for high-level performance
-
Visual cost comparisons
📌 What Does It Show?
-
Material Cost by Project Manager
-
Completion Percentage
-
Equipment Cost by Region
-
Actual Cost by Highway Type
-
Budget Cost by Highway Type
Because this page summarizes major cost drivers, managers immediately understand where money flows and where projects stand.
For example:
-
If completion percentage drops below 75%, managers can investigate delays.
-
If actual cost exceeds budget, they can identify which highway type causes the overrun.
Therefore, this page supports quick executive-level decisions.
2️⃣ Highway Type Analysis – Which Projects Cost More?
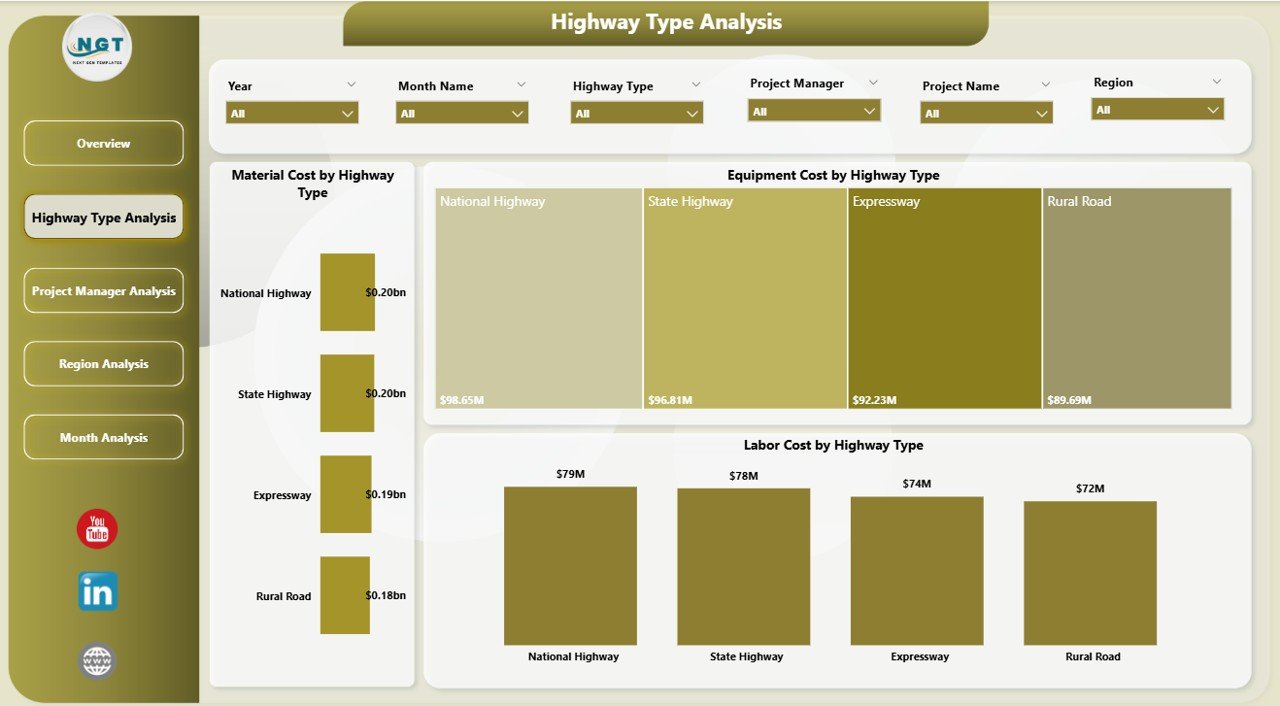
Different highway types require different resources. For example, expressways demand heavy equipment, while rural roads rely more on labor.
The Highway Type Analysis Page focuses on cost distribution by project type.
🔹 Key Visuals:
-
Total Material Cost by Highway Type
-
Equipment Cost by Highway Type
-
Labor Cost by Highway Type
Because this page separates data by highway category, companies can:
-
Identify the most expensive project types
-
Compare resource allocation
-
Control material waste
-
Plan future bids more accurately
For instance:
If expressway projects show 30% higher equipment cost than rural roads, planners can revise equipment deployment strategy.
As a result, companies reduce unexpected expenses.
3️⃣ Project Manager Analysis – Who Delivers Best Results?

Every project manager handles budgets differently. Therefore, leadership must measure performance at the manager level.
The Project Manager Analysis Page allows you to evaluate each manager clearly.
🔹 Key Charts:
-
Material Cost by Project Manager
-
Equipment Cost by Project Manager
-
Actual vs Budget Cost by Project Manager
Because this page compares managers side by side, executives can:
-
Identify top-performing managers
-
Detect cost overruns early
-
Reward efficient leaders
-
Provide support to underperforming teams
For example:
If one manager consistently keeps actual cost within budget while maintaining high completion rates, leadership can replicate that strategy across teams.
Thus, this page strengthens accountability.
Click to Purchases Road and Highway Construction Dashboard in Power BI
4️⃣ Region Analysis – Where Does the Money Go?
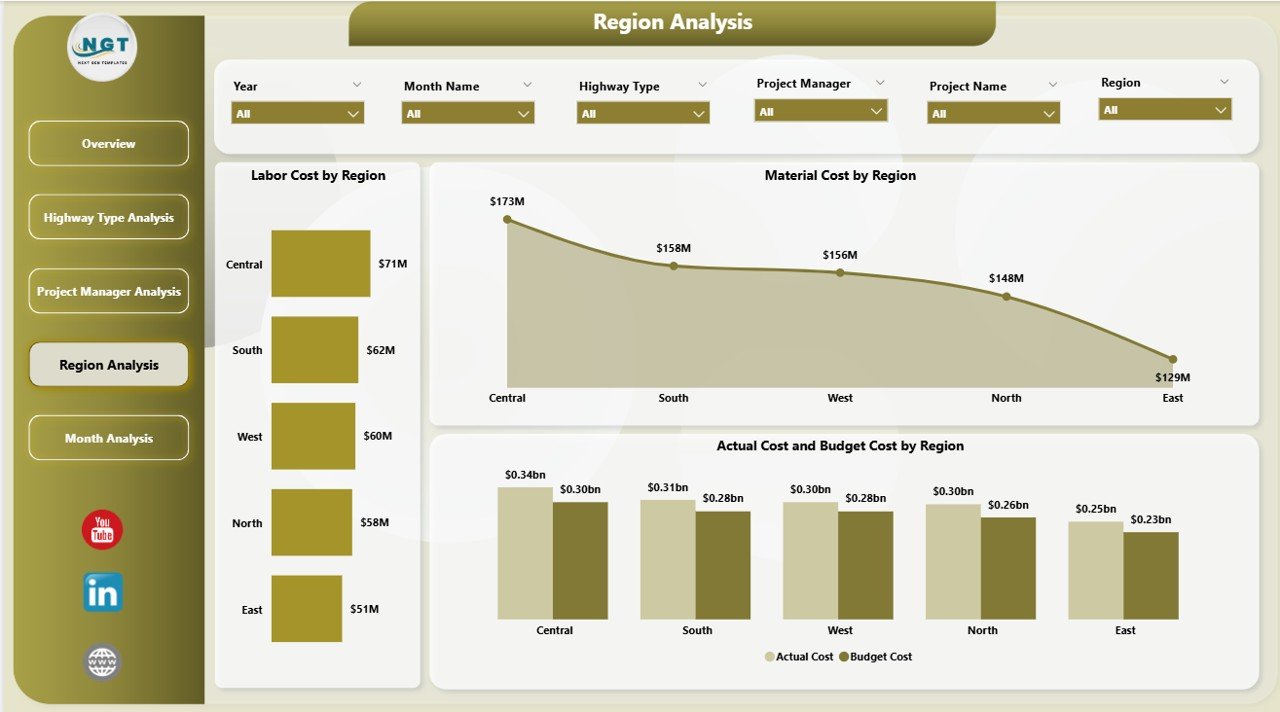
Construction costs vary by region due to labor rates, material availability, and terrain conditions.
The Region Analysis Page provides geographic performance insights.
🔹 Key Charts:
-
Material Cost by Region
-
Labor Cost by Region
-
Actual vs Budget by Region
Because regional differences impact profitability, this page helps you:
-
Compare cost efficiency across locations
-
Identify high-cost regions
-
Optimize resource distribution
-
Adjust regional pricing strategies
For instance:
If one region shows 15% higher labor cost than others, management can review contract terms or workforce efficiency.
Therefore, this page supports strategic planning.
5️⃣ Month Analysis – How Do Costs Change Over Time?
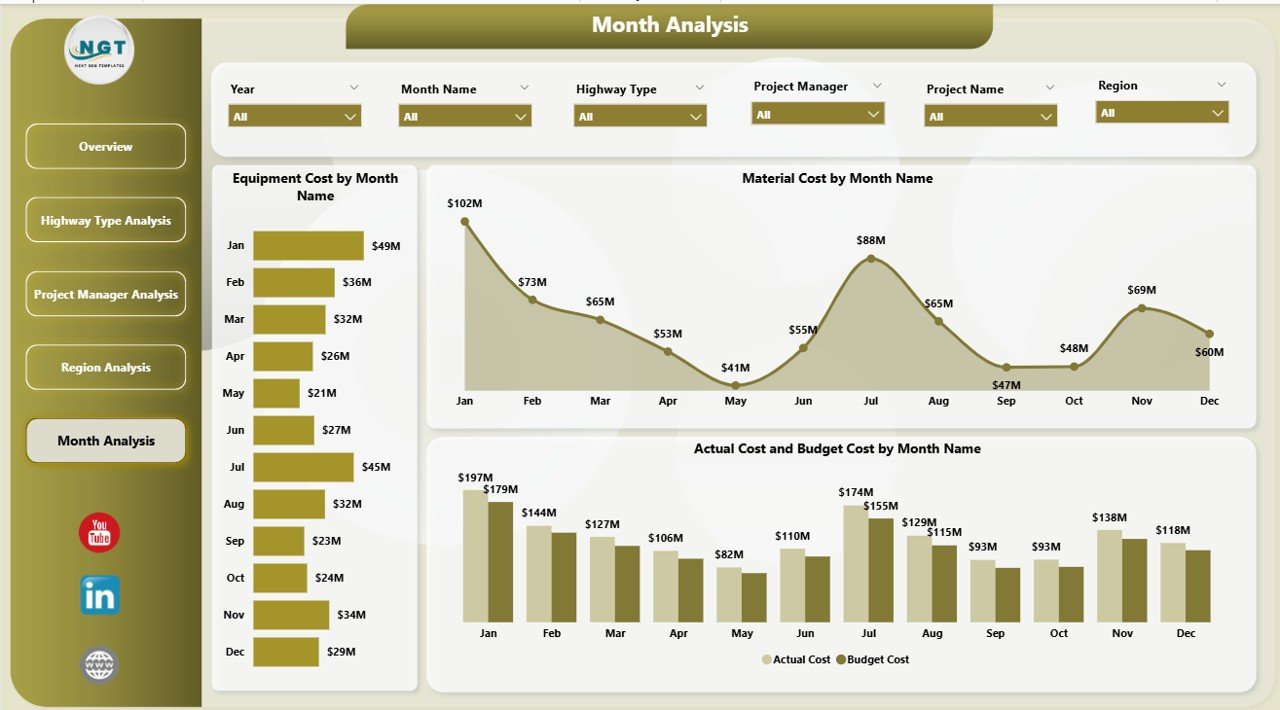
Construction projects move through phases. Material cost may rise during initial stages, while labor cost may increase during finishing phases.
The Month Analysis Page tracks trends over time.
🔹 Key Charts:
-
Material Cost by Month
-
Equipment Cost by Month
-
Actual vs Budget by Month
Because monthly trends reveal patterns, companies can:
-
Detect seasonal spikes
-
Predict future expenses
-
Improve cash flow planning
-
Avoid sudden cost shocks
For example:
If material cost rises every monsoon season, planners can stock materials earlier to avoid price hikes.
As a result, financial control improves.
🚀 Why Should Construction Companies Use Power BI for This Dashboard?
Power BI provides advanced visualization and dynamic filtering. Therefore, it suits complex infrastructure projects.
Power BI Benefits:
-
Interactive slicers
-
Drill-through capability
-
Real-time data refresh
-
Easy integration with Excel
-
Visual storytelling
-
Clear cost comparison charts
Because of these features, companies move from reactive reporting to proactive planning.
✅ Advantages of Road and Highway Construction Dashboard in Power BI
Using this dashboard delivers measurable business impact.
✔️ 1. Complete Cost Visibility
You track material, labor, and equipment cost in one place.
✔️ 2. Better Budget Control
You compare actual vs budget instantly.
✔️ 3. Faster Decision-Making
You access insights within seconds.
✔️ 4. Improved Project Accountability
You monitor project manager performance clearly.
✔️ 5. Regional Cost Optimization
You adjust strategy based on geographic performance.
✔️ 6. Trend-Based Planning
You forecast expenses using monthly analysis.
Because you centralize data, you reduce errors and save reporting time.
🏗 How Does This Dashboard Improve Project Profitability?
Profitability depends on cost control and timely delivery.
This dashboard improves profitability by:
-
Identifying budget overruns early
-
Reducing material waste
-
Optimizing equipment usage
-
Tracking completion percentage
-
Improving resource planning
Therefore, companies increase margins while maintaining quality standards.
📌 Best Practices for the Road and Highway Construction Dashboard in Power BI
To maximize value, follow these best practices.
🔹 1. Maintain Clean Data
Ensure consistent naming for regions, managers, and highway types.
🔹 2. Update Data Regularly
Refresh data weekly or monthly for accurate analysis.
🔹 3. Use Consistent Budget Definitions
Click to Purchases Road and Highway Construction Dashboard in Power BI
Align finance and project teams on budget calculation.
🔹 4. Monitor Variance Alerts
Review actual vs budget differences immediately.
🔹 5. Share Dashboard with Leadership
Enable data-driven discussions during review meetings.
🔹 6. Analyze Trends Monthly
Avoid focusing only on snapshot data.
When you follow these practices, the dashboard becomes a strategic tool rather than a reporting sheet.
💡 Who Should Use This Dashboard?
This dashboard serves multiple stakeholders.
-
Construction Company Owners
-
Infrastructure Project Managers
-
Finance Teams
-
Regional Managers
-
Highway Contractors
-
Government Infrastructure Departments
Because it supports both operational and strategic decisions, it fits organizations of all sizes.
🔍 How Does This Dashboard Help in Government Infrastructure Projects?
Government projects require strict budget tracking and transparency.
This dashboard helps by:
-
Providing clear cost comparison
-
Supporting audit requirements
-
Offering regional breakdown
-
Tracking completion progress
Therefore, agencies improve accountability and compliance.
🏁 Conclusion – Why This Dashboard Is Essential for Modern Construction Companies
Road and highway construction projects involve high capital investment. Therefore, companies cannot rely on manual tracking.
The Road and Highway Construction Dashboard in Power BI transforms raw project data into actionable insights.
Because it includes:
-
Overview Page
-
Highway Type Analysis
-
Project Manager Analysis
-
Region Analysis
-
Month Analysis
It provides 360-degree performance visibility.
As a result, managers control cost, improve efficiency, and deliver projects on time.
In today’s competitive construction market, data-driven planning wins.
And this dashboard makes that possible.
❓ Frequently Asked Questions (FAQs)
1. What does the Road and Highway Construction Dashboard track?
It tracks material cost, equipment cost, labor cost, actual vs budget comparison, completion percentage, and monthly trends.
2. Can I filter the dashboard by region?
Yes. You can use slicers to filter data by region, highway type, project manager, or month.
3. Does this dashboard support budget monitoring?
Yes. It compares actual cost with budget cost clearly across all pages.
4. Is this dashboard suitable for large infrastructure companies?
Yes. It handles multi-region and multi-project data effectively.
5. Can government departments use this dashboard?
Yes. It supports transparency, compliance, and structured reporting.
6. How often should I update the data?
You should update data weekly or monthly to maintain accuracy.
7. Why should I use Power BI instead of Excel?
Power BI provides stronger visualization, interactive filtering, and scalable reporting.
Visit our YouTube channel to learn step-by-step video tutorials