Introduction
The Battery Manufacturing Dashboard in Power BI is a ready-to-use, dynamic tool designed to provide comprehensive insights into battery production processes. By simply updating your data file and refreshing the Power BI report, you can visualize key manufacturing metrics instantly. This dashboard makes complex data easy to understand and actionable, helping manufacturers optimize production, control costs, and ensure quality.
Click to Purchases Battery Manufacturing Dashboard in Power BI
Key Features of Battery Manufacturing Dashboard in Power BI
- Multiple pre-designed report pages tailored for in-depth analysis.
- Interactive slicers for quick filtering and customized views.
- High-level summary cards for at-a-glance KPIs.
- Visual representation of production, quality, costs, revenue, and plant performance.
- Easy data update and refresh mechanism.
Dashboard Pages Explanation
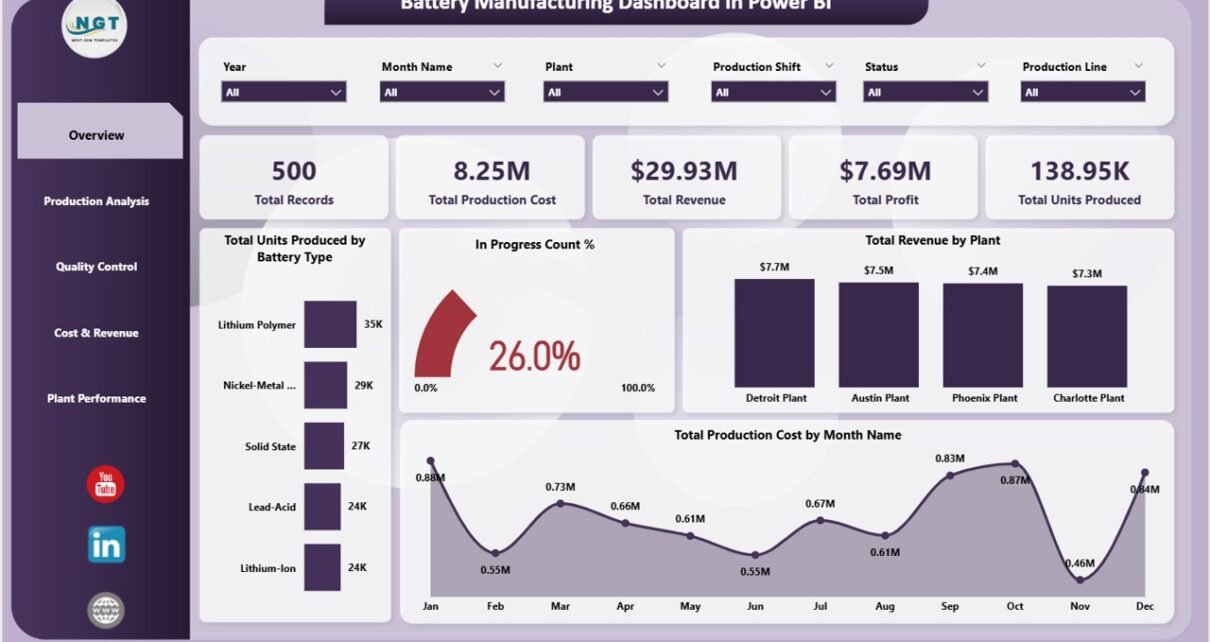
1 – Overview Page
This page provides a snapshot of your manufacturing operations with key metrics and interactive charts.
- Cards on Overview Page:
- Total records: Displays the total number of records in the dataset.
- Total production cost: Summarizes all manufacturing expenses.
- Total revenue: Shows total income generated from sales.
- Total profit: Calculated by subtracting costs from revenue.
- Total units produced: Displays the total quantity of batteries manufactured.
- Charts:
- In Progress Count %: Visualizes the percentage of orders currently in production.
- Total Units Produced by Battery Type: Breaks down production volume by different battery models.
- Total Production Cost by Month: Shows monthly trends in production expenses for budgeting and forecasting.
- Total Revenue by Plant: Compares revenue performance across different manufacturing locations.
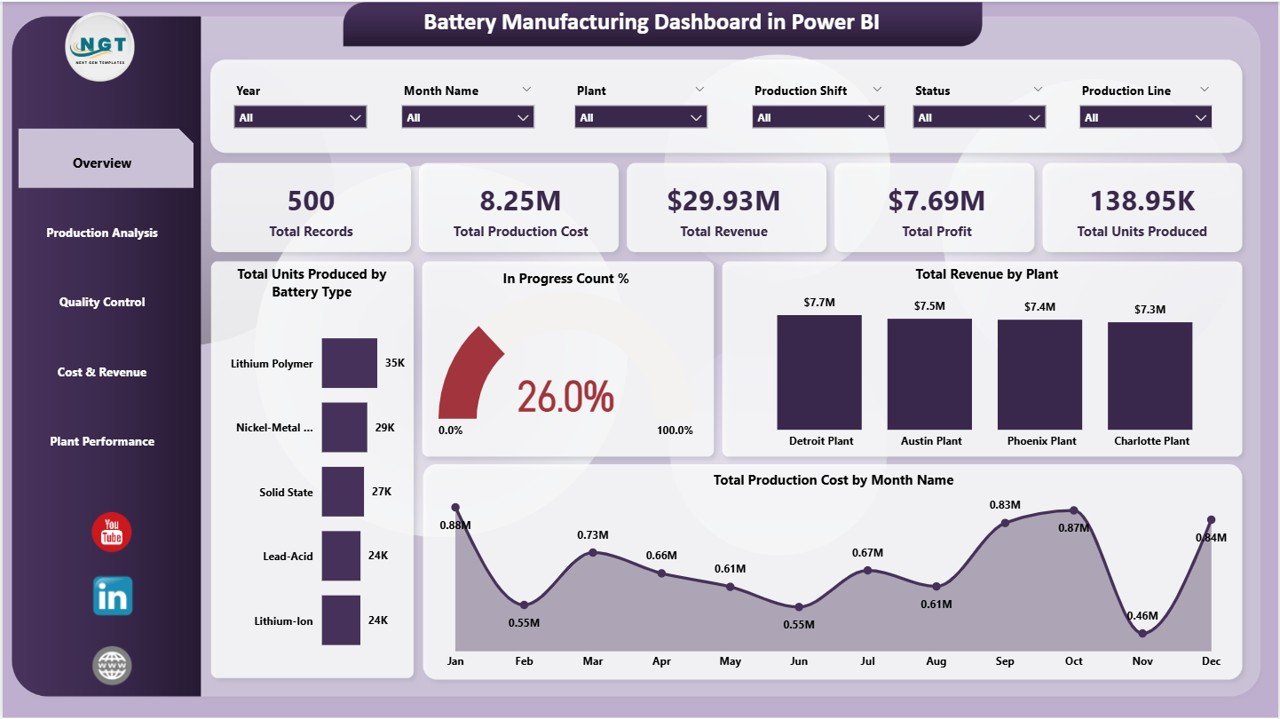
Battery Manufacturing Dashboard in Power BI
2 – Production Analysis
This sheet tab focuses on the manufacturing line efficiency and shift-based performance.
- Total Units Produced by Production Line: Reveals production volumes line-wise to identify top performers.
- Total Production Cost by Production Shift: Breaks down costs per shift to analyze labor and resource efficiency.
- Profit Margin % by Production Shift: Compares profitability between different production shifts.
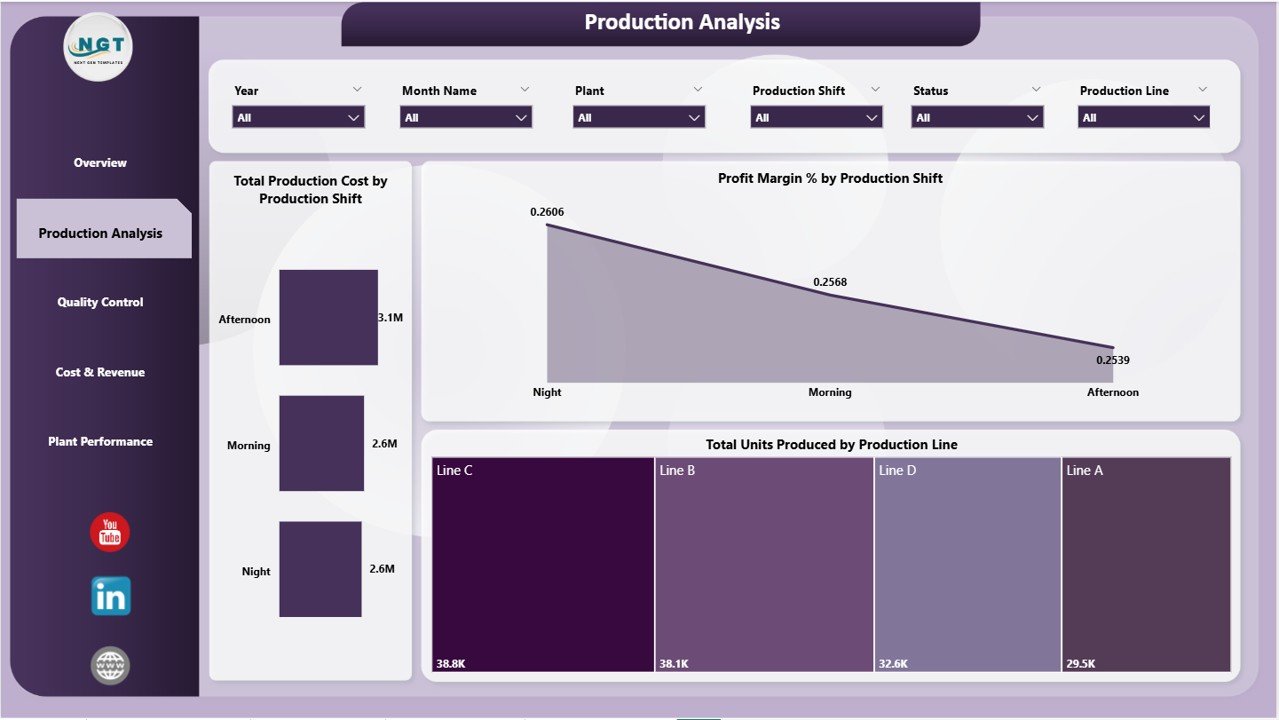
Production Analysis in Battery Manufacturing Dashboard
3 – Quality Control
Ensures the product meets quality standards by analyzing pass rates and rejection trends.
- Total Units Passed by Battery Type: Tracks quantity of batteries passing QC by model.
- QC Pass % by Production Line: Monitors quality success rates across production lines.
- Total Rejected Units by Month: Highlights monthly rejection trends to spot recurring issues.
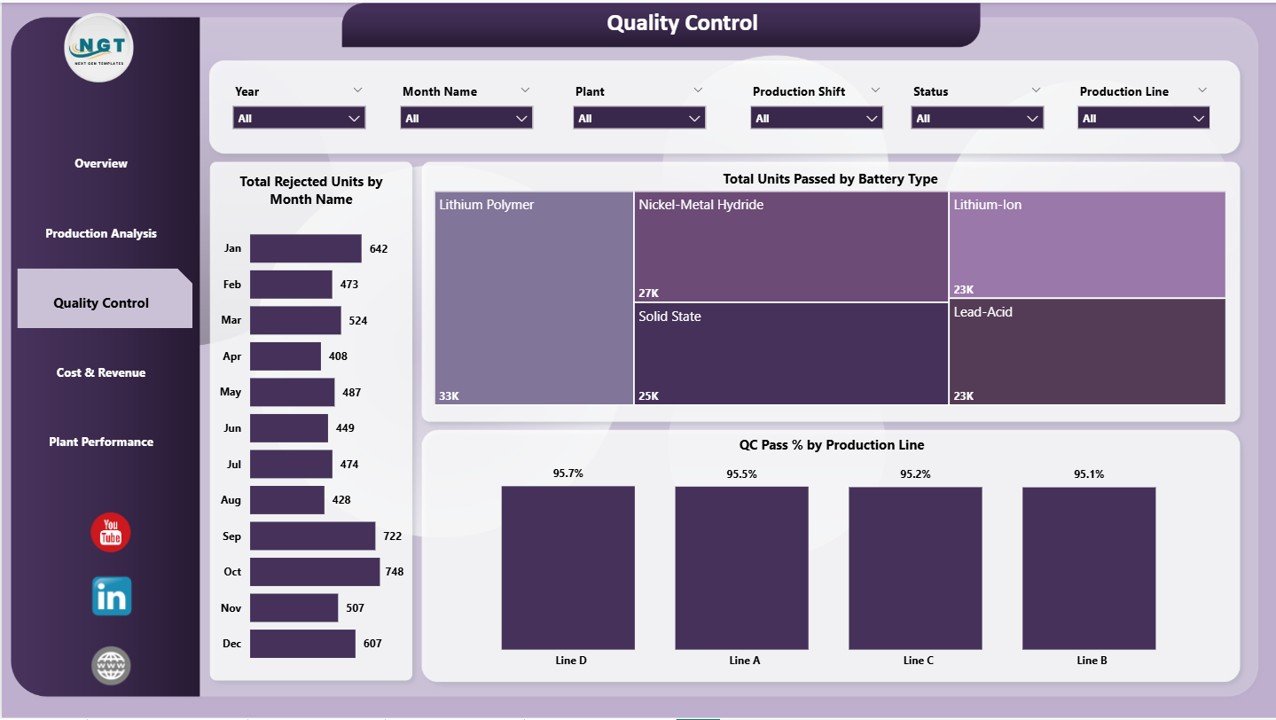
Quality Control in Battery Manufacturing Dashboard
4 – Cost & Revenue
This page presents a financial perspective, focusing on cost-efficiency and income generation.
- Total Production Cost by Plant: Compares expenditure across plants to find cost-saving opportunities.
- Profit Margin % by Production Line: Evaluates profitability by manufacturing line.
- Total Revenue by Plant: Displays revenue generated from each facility.
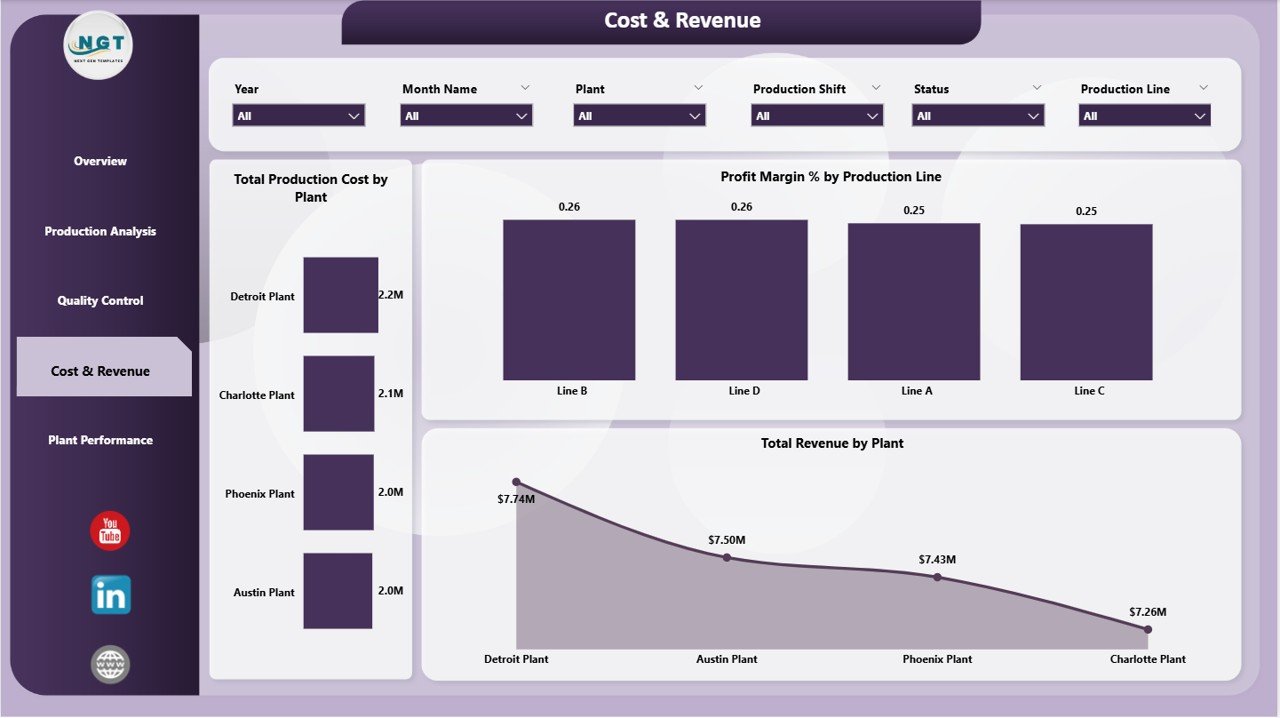
Cost & Revenue in Battery Manufacturing Dashboard
5 – Plant Performance
A detailed view of plant-wise performance in terms of costs and revenues.
- Total Raw Material Cost by Plant: Breaks down raw material expenses per plant.
- Total Records by Plant: Shows the volume of production data recorded per site.
- Profit Margin % by Plant: Compares overall profitability between plants.
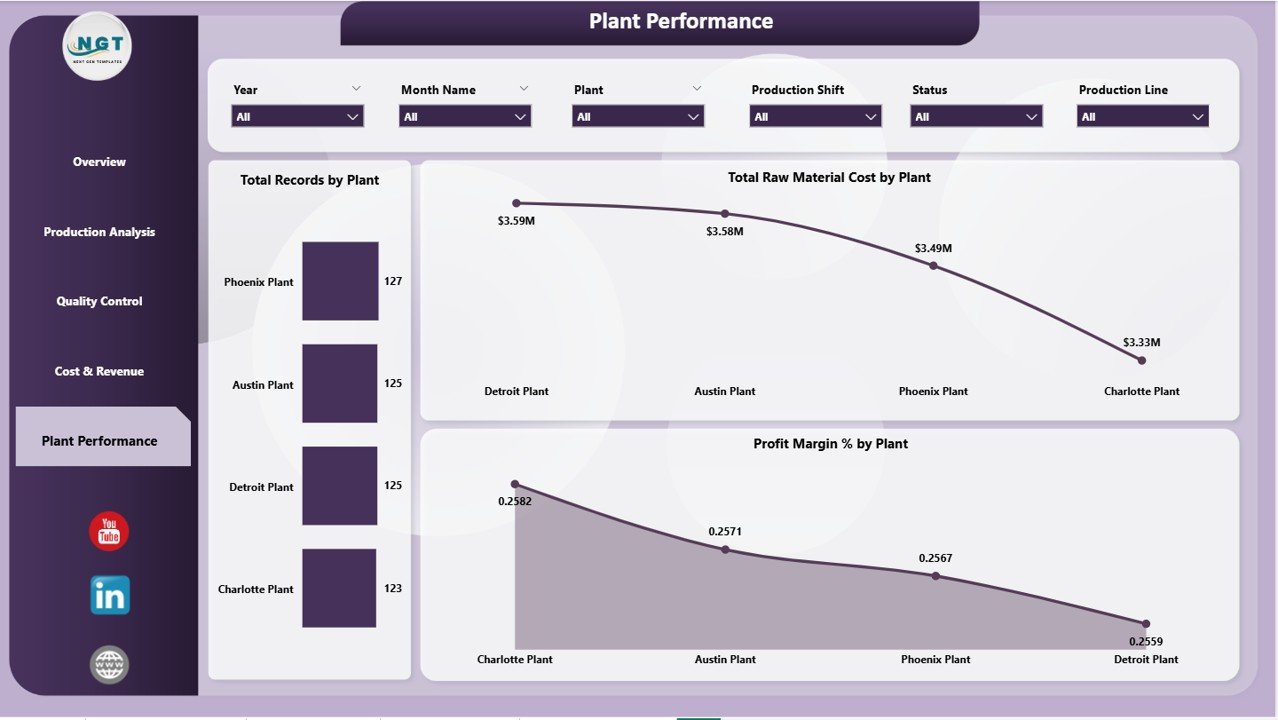
Plant Performance in Battery Manufacturing Dashboard
Support Tab
The support sheet contains multiple pivot tables powering the dashboard’s dynamic visuals. After updating the data, you can refresh these pivots to update all charts seamlessly. This sheet is typically kept hidden to avoid accidental changes.
Advantages of Battery Manufacturing Dashboard in Power BI
- Real-time, interactive insights improve decision-making and operational efficiency.
- Customizable filters enable tailored analysis for various stakeholders.
- Simplifies complex manufacturing data into digestible visuals.
- Supports data-driven cost control and quality improvement efforts.
- Enhances transparency across multiple production plants and shifts.
Opportunities for Improvement
- Integrate predictive analytics to forecast production bottlenecks.
- Incorporate IoT data for real-time equipment monitoring.
- Expand KPI tracking for environmental impact and sustainability.
- Add automated alerts for quality deviations or cost overruns.
Best Practices
- Regularly update your source data for accurate insights.
- Use consistent data formats to prevent refresh errors.
- Leverage slicers to analyze specific time periods or plants.
- Keep unused tabs like Support sheet hidden to maintain dashboard integrity.
- Train team members on interpreting visual trends for better collaboration.
FAQs
How do I update the data in the Battery Manufacturing Dashboard?
You update the data by modifying the data file connected to the Power BI report and then clicking the Refresh button on the Home tab in Power BI.
Can I customize the dashboard charts?
Yes, you can modify existing visuals or add new ones using Power BI Desktop, provided the underlying data structure remains consistent.
Is this dashboard suitable for multi-plant operations?
Absolutely, the dashboard includes detailed plant-level metrics to manage and compare multiple manufacturing locations.
Do I need advanced Power BI skills to use this dashboard?
No, it is designed for easy refresh and filtering, making it accessible for users with basic Power BI knowledge.
Conclusion
The Battery Manufacturing Dashboard in Power BI offers a powerful solution to monitor, analyze, and optimize your battery production operations. With its user-friendly interface, comprehensive metrics, and real-time data visualization, it empowers manufacturers to identify issues, reduce costs, and increase profitability. By efficiently combining data from multiple sources, this dashboard is an indispensable asset for any battery manufacturing business aiming for operational excellence.
Click to Purchases Battery Manufacturing Dashboard in Power BI
Visit our YouTube channel to watch the demo.