In today’s fast-growing urban environment, city gas distribution companies handle massive amounts of operational, financial, and safety data. However, managing this data manually becomes confusing, time-consuming, and error-prone.
So, how can you track billing, revenue, maintenance, safety, and operational performance all in one place?
The answer is simple: City Gas Distribution Dashboard in Excel
This powerful and ready-to-use dashboard helps you monitor key metrics, analyze trends, and make smarter decisions. Moreover, it transforms complex gas distribution data into clear, actionable insights.
In this article, you will learn everything about the City Gas Distribution Dashboard in Excel, including its features, benefits, best practices, and much more.
Click to buy City Gas Distribution Dashboard in Excel
What is a City Gas Distribution Dashboard in Excel?
A City Gas Distribution Dashboard in Excel is an interactive reporting tool designed to track and analyze the performance of gas distribution networks across cities and regions.
Instead of relying on scattered spreadsheets, this dashboard allows you to:
- Monitor revenue, billing, and costs in real time
- Track maintenance and operational expenses
- Analyze leak incidents and safety metrics
- Compare performance across cities and regions
- Identify monthly trends for better planning
As a result, you gain complete visibility over your operations and improve decision-making.
Why Do You Need a City Gas Distribution Dashboard?
Many gas distribution companies collect data daily. However, they often fail to convert that data into meaningful insights.
Therefore, this dashboard becomes essential because it helps you:
- Combine all data into one centralized system
- Reduce manual reporting efforts
- Improve operational efficiency
- Ensure safety and compliance
- Make data-driven decisions quickly
In addition, it helps management teams stay proactive instead of reactive.
Key Features of City Gas Distribution Dashboard in Excel
This dashboard includes multiple interactive sheet tabs, each designed for specific analysis. Let’s explore each section in detail.
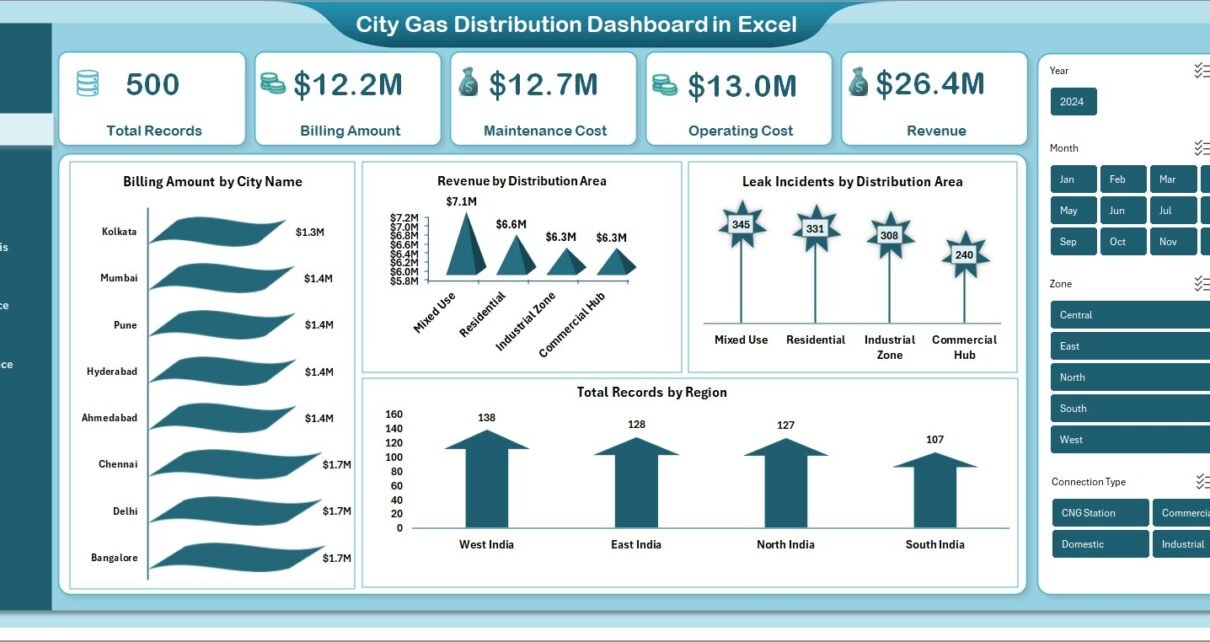
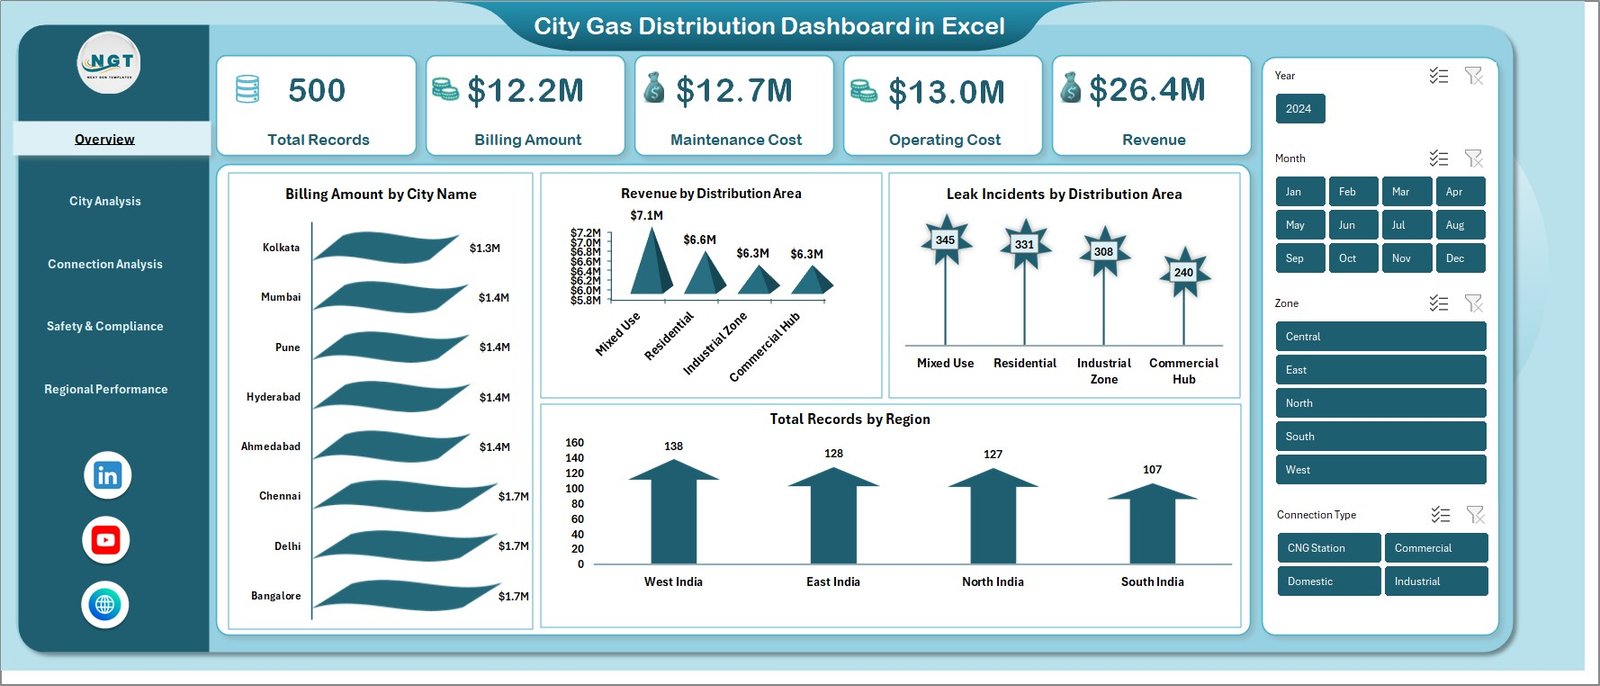
Overview Sheet – Get a Complete Snapshot
The Overview sheet provides a high-level summary of your entire gas distribution operations.
Key Metrics Displayed:
- Total Records
- Billing Amount
- Maintenance Cost
- Operating Cost
- Revenue
Visual Insights:
- Billing Amount by City Name
- Revenue by Distribution Area
- Leak Incidents by Distribution Area
- Total Records by Region
As a result, you can instantly understand your business performance at a glance.
Click to buy City Gas Distribution Dashboard in Excel
City Analysis – How Each City Performs?
The City Analysis sheet focuses on city-level performance and comparisons.
Key Insights:
- Avg. Pipeline Length (km) by City Name
- Avg. Complaint Resolution Days by City Name
- Maintenance Cost by City Name
- Revenue vs Maintenance Cost by City Name
Therefore, you can easily identify high-performing and underperforming cities.
Click to buy City Gas Distribution Dashboard in Excel
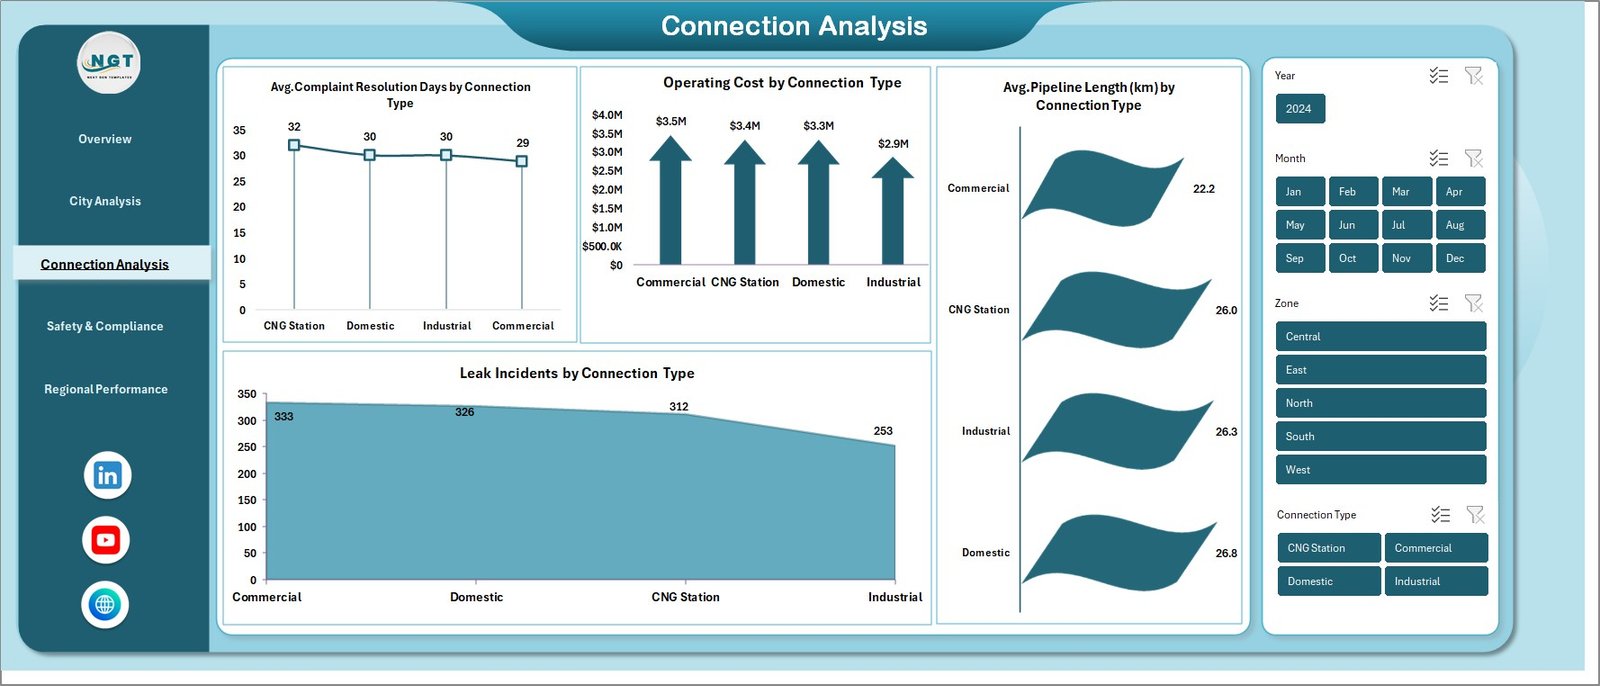
Connection Analysis – Understand Customer Segments
The Connection Analysis sheet provides insights based on different connection types.
Key Metrics:
- Avg. Complaint Resolution Days by Connection Type
- Operating Cost by Connection Type
- Avg. Pipeline Length (km) by Connection Type
- Leak Incidents by Connection Type
This helps you optimize services for residential, commercial, and industrial customers.
Click to buy City Gas Distribution Dashboard in Excel
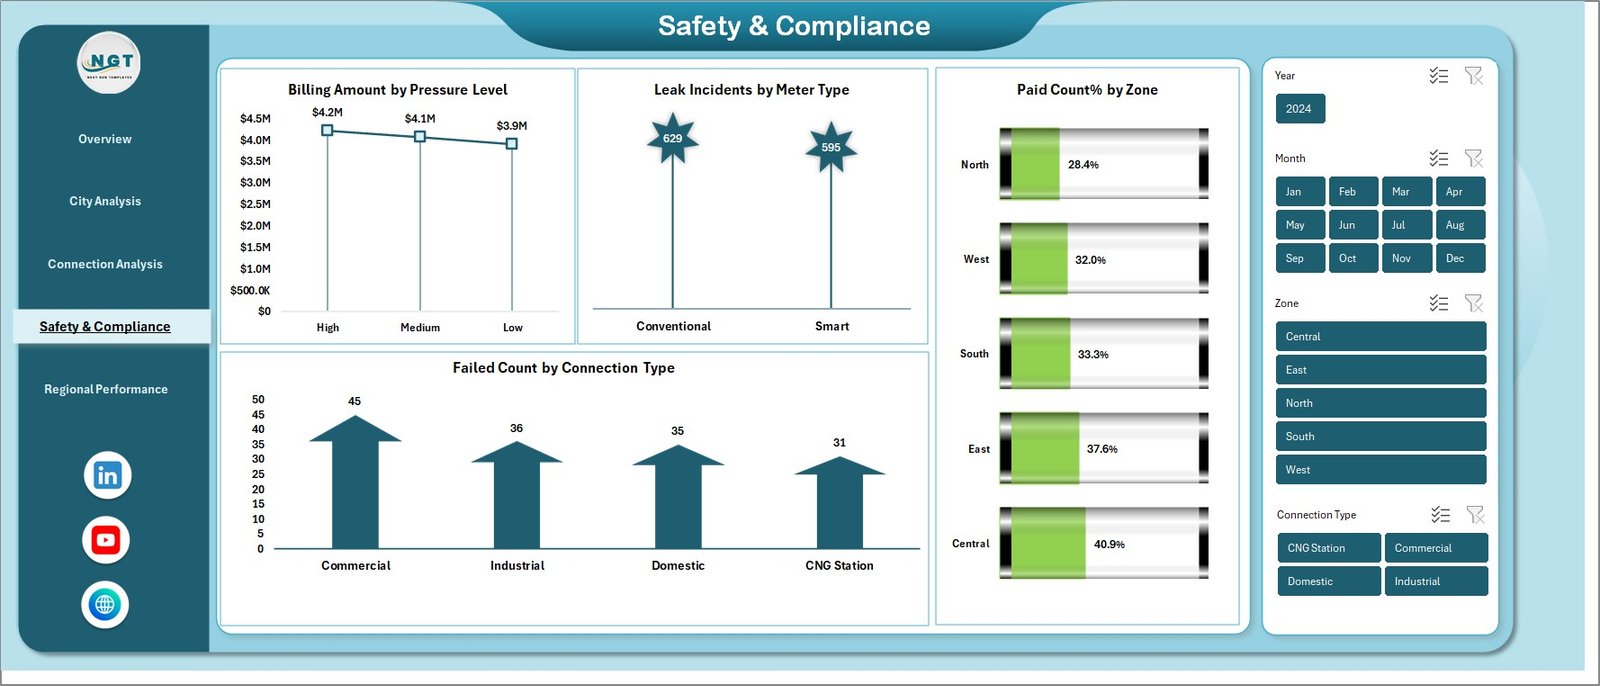
Safety & Compliance – Monitor Risk and Safety
Safety plays a critical role in gas distribution. Therefore, this sheet focuses on compliance and risk monitoring.
Key Insights:
- Billing Amount by Pressure Level
- Leak Incidents by Meter Type
- Paid Count % by Zone
- Failed Count by Connection Type
As a result, you can quickly identify risk areas and take preventive actions.
Click to buy City Gas Distribution Dashboard in Excel
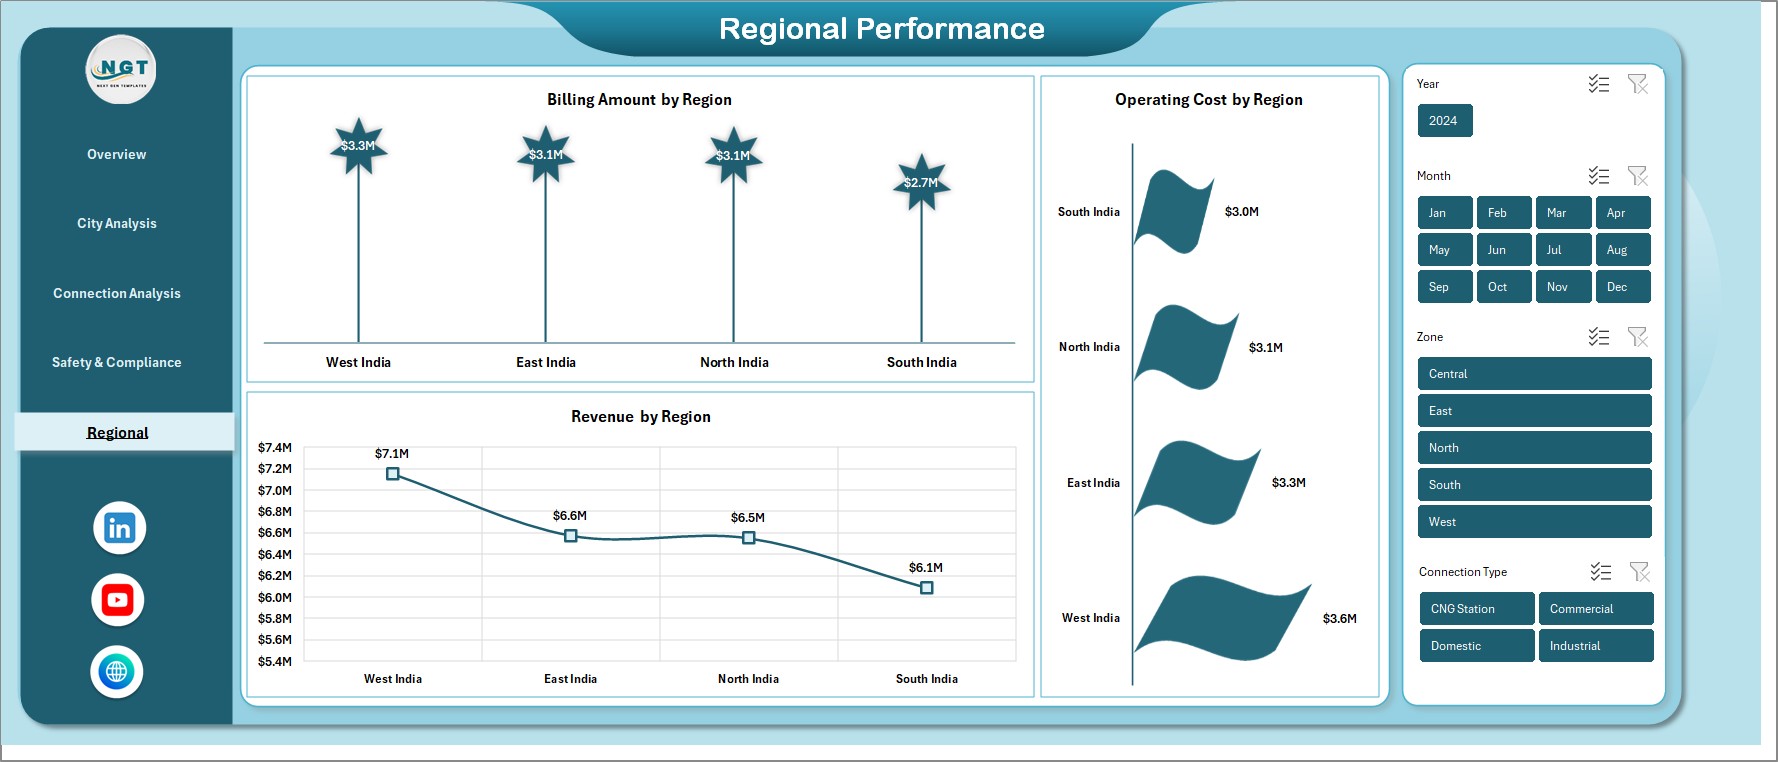
Monthly Trends – Track Performance Over Time
The Monthly Trends sheet helps you analyze performance across time.
Key Trends:
- Billing Amount by Region
- Operating Cost by Region
- Revenue by Region
Therefore, you can identify seasonal patterns and improve forecasting.
Click to buy City Gas Distribution Dashboard in Excel
Advantages of City Gas Distribution Dashboard in Excel
Using this dashboard provides multiple advantages. Let’s explore them:
Centralized Data Management
- Combine all data into one place
- Avoid multiple spreadsheets
- Improve data consistency
Better Decision-Making
- Get real-time insights
- Identify trends quickly
- Make informed business decisions
Improved Operational Efficiency
- Reduce manual work
- Save time on reporting
- Automate calculations
Enhanced Safety Monitoring
- Track leak incidents
- Monitor compliance metrics
- Reduce operational risks
Easy Customization
- Modify according to your needs
- Add new KPIs easily
- Adapt for different regions
How Does the Dashboard Work?
The dashboard works in a simple yet powerful way.
Step-by-Step Process:
- Enter your data in the Excel input sheet
- Update records regularly
- Refresh pivot tables and charts
- Use slicers to filter data
- Analyze insights instantly
Therefore, even non-technical users can easily use this dashboard.
Who Can Benefit from This Dashboard?
This dashboard serves multiple professionals in the gas distribution industry.
Ideal Users:
- Gas Distribution Companies
- Utility Managers
- Operations Teams
- Safety Officers
- Financial Analysts
- Government Authorities
In short, anyone involved in gas distribution can benefit from this tool.
How to Use the Dashboard Effectively?
To get the best results, you should follow a structured approach.
Tips:
- Update data daily or weekly
- Use filters for deeper analysis
- Compare regions regularly
- Monitor safety metrics closely
- Review trends monthly
As a result, you will maximize the value of your dashboard.
Opportunities for Improvement in City Gas Distribution
Although this dashboard provides strong insights, companies can still improve further.
Areas of Improvement:
- Integrate real-time IoT data
- Automate data collection systems
- Improve data accuracy
- Add predictive analytics
- Enhance visualization techniques
Therefore, continuous improvement ensures long-term success.
Best Practices for the City Gas Distribution Dashboard
To ensure maximum efficiency, follow these best practices:
Keep Data Clean and Updated
- Avoid duplicate entries
- Maintain consistent formats
- Validate data regularly
Use Standard KPIs
- Define clear performance indicators
- Track MTD and YTD metrics
- Align KPIs with business goals
Focus on Safety Metrics
- Monitor leak incidents daily
- Track compliance performance
- Act on risk indicators immediately
Optimize Dashboard Design
- Use clear charts and visuals
- Avoid clutter
- Keep navigation simple
Train Your Team
- Educate users on dashboard usage
- Encourage data-driven decisions
- Provide regular training
Why Excel is the Best Tool for This Dashboard?
Excel remains one of the most powerful tools for dashboard creation.
Key Reasons:
- Easy to use and widely available
- Supports pivot tables and charts
- Highly customizable
- No coding required
- Cost-effective solution
Therefore, Excel becomes the ideal platform for this dashboard.
Future of City Gas Distribution Analytics
The future of gas distribution analytics looks promising.
Emerging Trends:
- Real-time monitoring using IoT
- AI-based predictive maintenance
- Automated reporting systems
- Advanced data visualization tools
- Smart city integration
As technology evolves, dashboards will become even more powerful.
Conclusion – Transform Your Gas Distribution Management
The City Gas Distribution Dashboard in Excel is a powerful tool that simplifies complex data and turns it into meaningful insights.
Moreover, it helps you:
- Monitor performance
- Improve efficiency
- Ensure safety
- Make smarter decisions
Therefore, if you want to take your gas distribution management to the next level, this dashboard is the perfect solution.
Frequently Asked Questions (FAQs)
- What is a City Gas Distribution Dashboard in Excel?
It is an interactive tool used to track and analyze gas distribution data such as billing, revenue, costs, and safety metrics.
- Can I customize this dashboard?
Yes, you can easily customize it by adding new KPIs, charts, and data fields.
- Is this dashboard suitable for small companies?
Yes, it works for both small and large gas distribution companies.
- Do I need advanced Excel skills to use it?
No, basic Excel knowledge is enough to use this dashboard effectively.
- How often should I update the data?
You should update the data daily, weekly, or monthly depending on your business needs.
- Can this dashboard improve safety monitoring?
Yes, it helps track leak incidents and compliance metrics, improving safety management.
- Is this dashboard useful for decision-making?
Absolutely. It provides real-time insights that support data-driven decisions.
Visit our YouTube channel to learn step-by-step video tutorials
Click to buy City Gas Distribution Dashboard in Excel