Freelancer Business Dashboard in Excel is a comprehensive, ready-to-use analytics template built for freelancers, independent consultants, and self-employed professionals who want to track their revenue, costs, profit margins, client performance, project insights, and payment status from one centralized Excel dashboard. This template includes 5 interactive dashboard pages, a structured data sheet, and a support sheet with pivot tables that auto-refresh when you update your data.
Whether you are a graphic designer juggling multiple clients, a web developer tracking project hours, a content writer monitoring payment cycles, or a marketing consultant analyzing revenue trends, this Excel Dashboard Template transforms scattered freelance data into clear, actionable visual insights. No more guessing which clients are profitable or which platforms deliver the best returns — this dashboard answers those questions instantly.
Key Features of Freelancer Business Dashboard in Excel
The Freelancer Business Dashboard in Excel includes 5 interactive dashboard pages covering an Overview with KPI cards, Client Analysis, Project Insights, Payment Tracking, and Revenue Trend analysis. It tracks 5 key metrics — Total Records, Total Cost, Total Revenue, Net Profit, and Avg. Revenue/Project — giving freelancers a complete 360-degree view of their business performance.
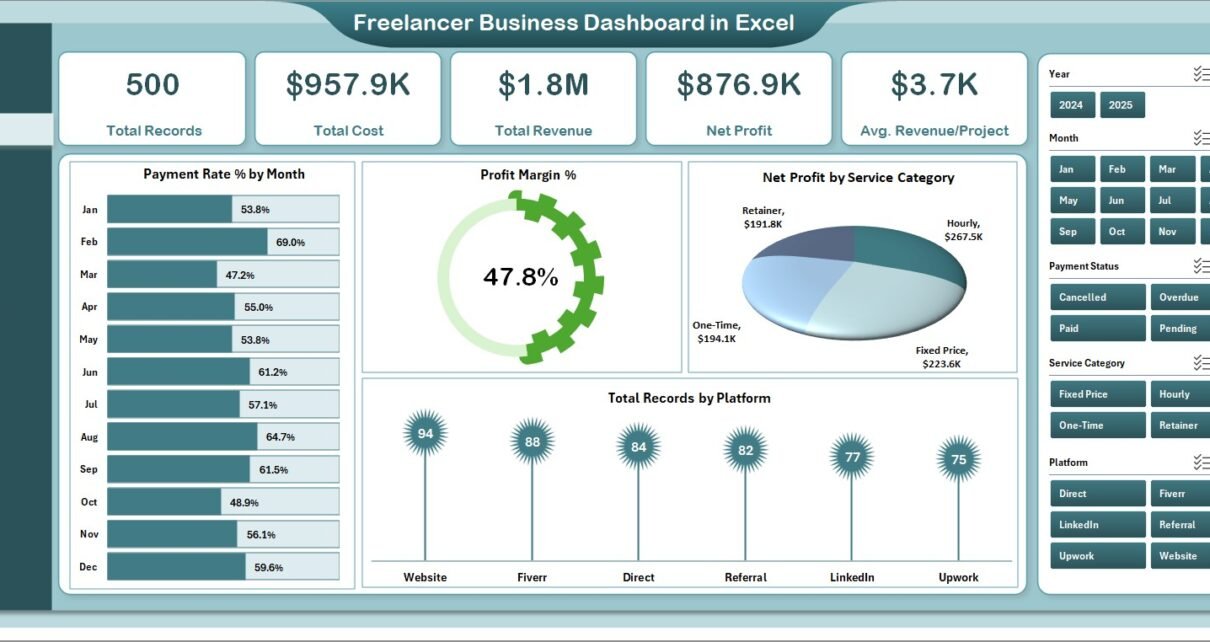
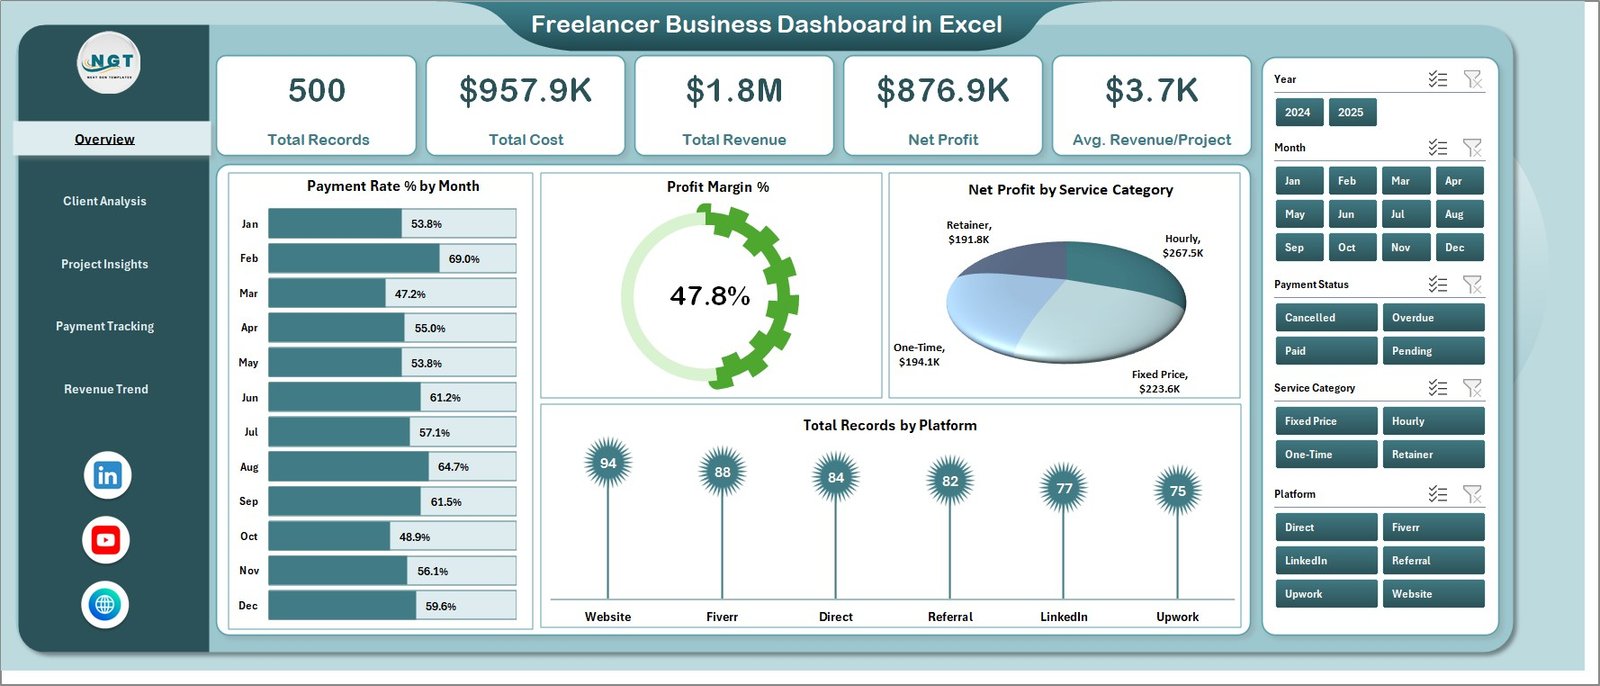
The Overview page features dynamic KPI cards displaying high-level financial summaries alongside interactive charts for Payment Rate % by Month, Profit Margin %, Net Profit by Service Category, and Total Records by Platform. Multiple slicers allow you to filter the entire dashboard by service category, platform, client, payment method, and time period instantly.
Each of the remaining 4 analysis pages provides specialized insights — from client-level profitability and project performance to payment status monitoring and monthly revenue trends. All charts are powered by pivot tables, so updating data requires just a single click on Refresh All in the Excel ribbon.
Dashboard Pages Explained
1. Overview Page
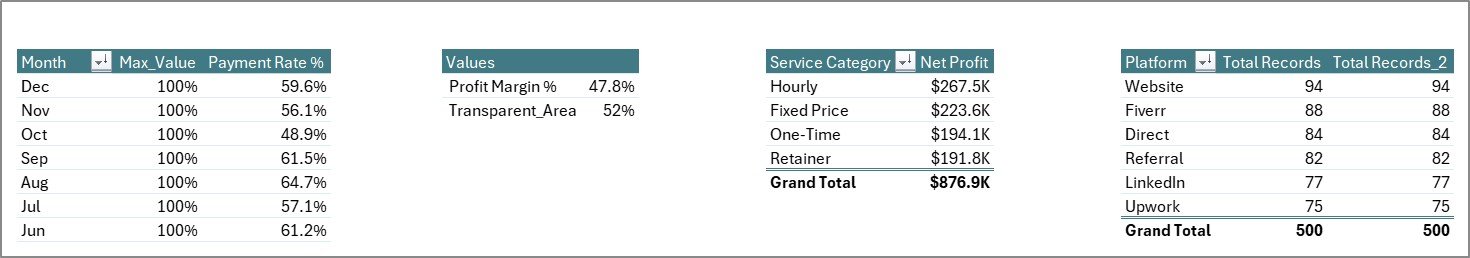
The Overview page serves as your freelance command center. At the top, 5 KPI cards display Total Records, Total Cost, Total Revenue, Net Profit, and Avg. Revenue/Project for an instant financial health check. Below the cards, you will find four analytical charts: Payment Rate % by Month tracks the percentage of payments received over time, helping you spot collection delays. Profit Margin % monitors your overall profitability trends month over month. Net Profit by Service Category compares earnings across different freelance services like web development, content writing, and graphic design. Total Records by Platform shows which freelancing platforms generate the most project volume. Multiple slicers on this page let you filter the entire dashboard for targeted analysis.
Freelancer Business Dashboard in Excel
2. Client Analysis
The Client Analysis page dives deep into your client relationships and profitability. Profit Margin % by Service Category reveals which of your service offerings deliver the highest profit margins, helping you focus on the most lucrative work. Net Profit by Industry breaks down your earnings by the industries your clients belong to, so you can identify your most profitable sectors. Total Records by Payment Method tracks how clients prefer to pay you — whether by bank transfer, PayPal, or other methods. Total Revenue by Client Name identifies your highest-value clients, enabling you to nurture those relationships strategically.
Client Analysis
3. Project Insights
The Project Insights page helps you understand which types of work generate the most value. Avg. Revenue/Project by Service Category shows the average earnings per project across different service types, revealing where your time investment pays off the most. Net Profit by Platform compares profitability across freelancing platforms like Upwork, Fiverr, and direct clients. Total Hours by Project Type tracks your time investment across different project categories. Total Revenue by Project Type identifies which project categories bring in the most total revenue.
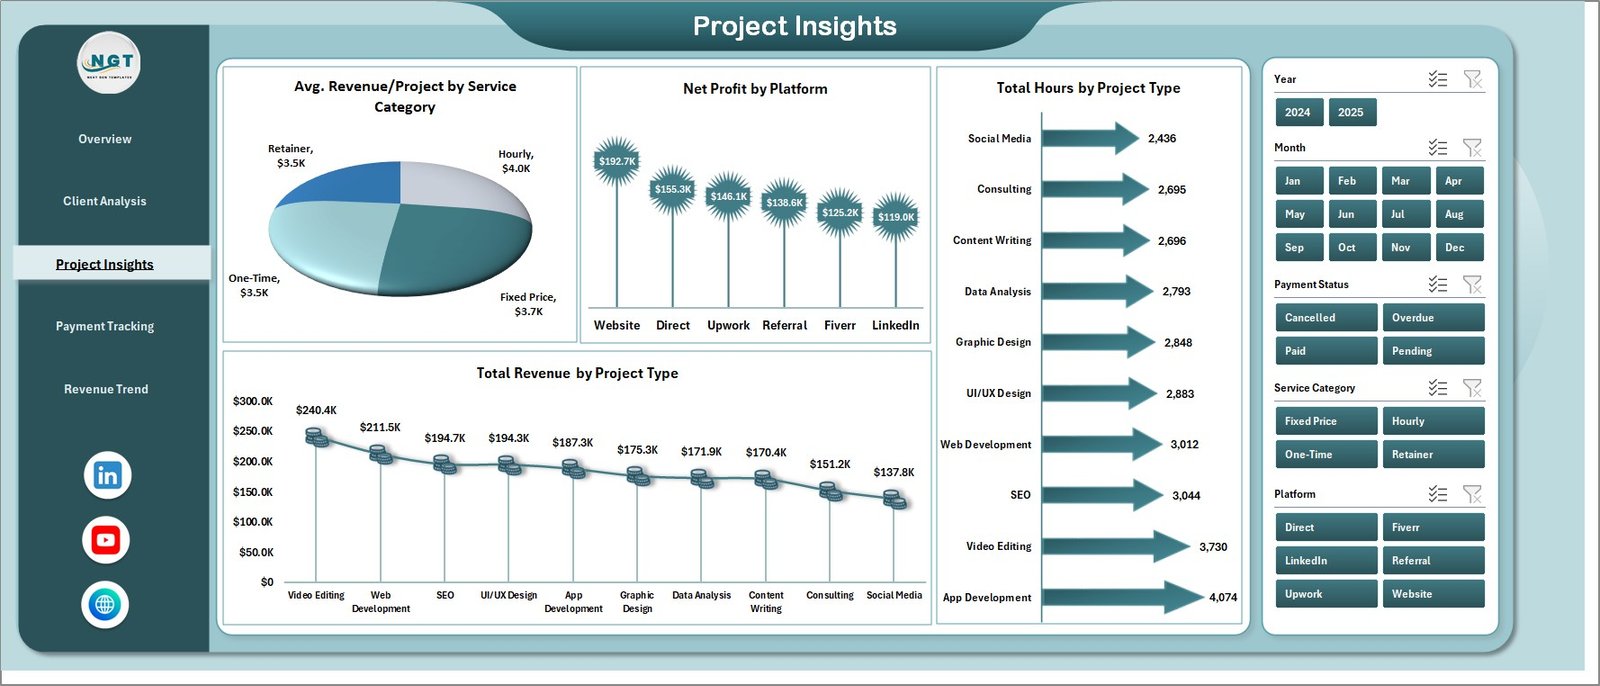
Project Insights
4. Payment Tracking
The Payment Tracking page ensures you stay on top of your cash flow. Total Cost by Payment Status tracks paid, pending, and overdue amounts so you can follow up on late payments. Profit Margin % by Payment Status compares your profitability across different payment statuses. Avg. Client Rating by Payment Method reveals client satisfaction patterns by payment channel. Total Cost by Month shows your monthly expense trajectory, helping you plan for leaner months.
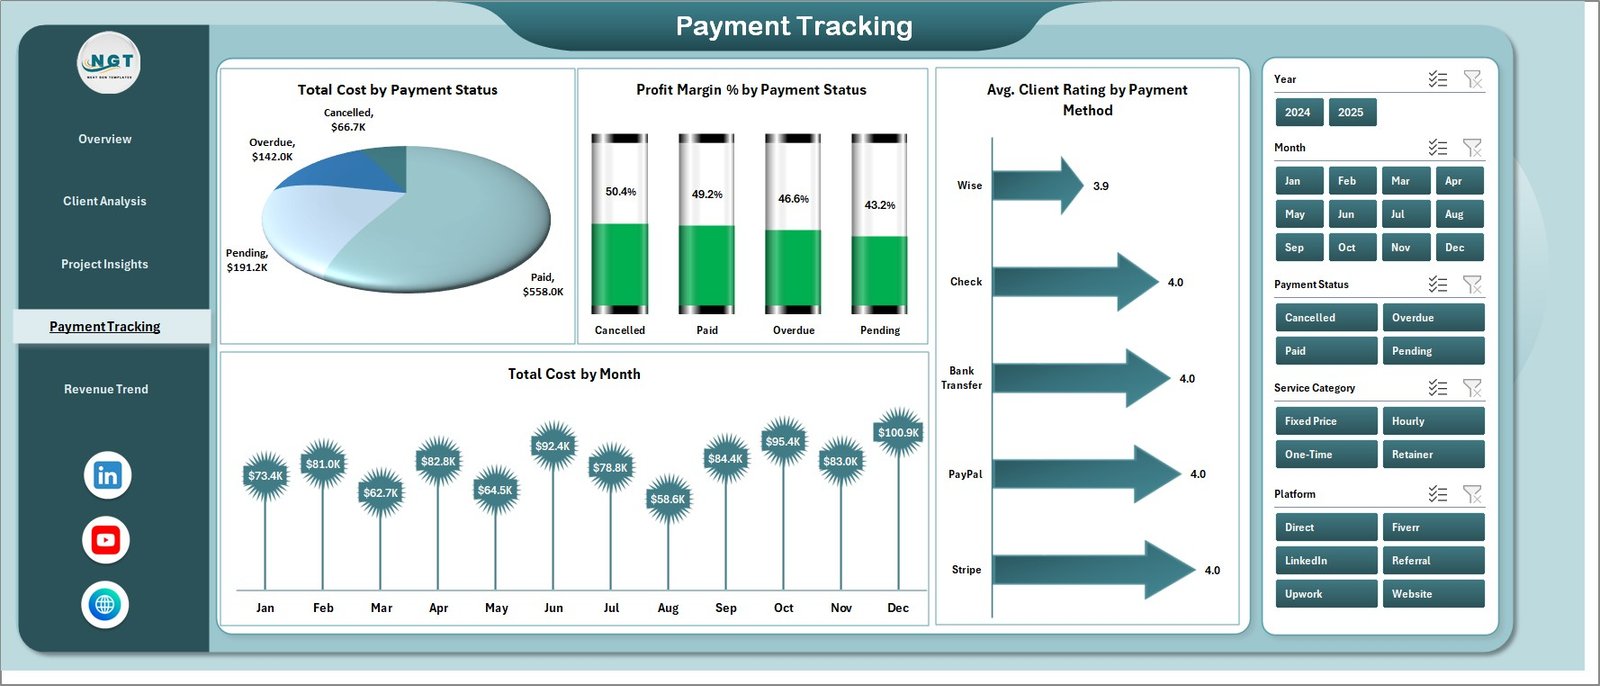
Payment Tracking
5. Revenue Trend
The Revenue Trend page provides a long-term view of your freelance business growth. Total Revenue by Month displays your monthly earnings trajectory, making it easy to spot seasonal patterns and growth trends. Total Revenue by Platform compares your income across different freelancing platforms and direct clients. Avg. Revenue/Project by Industry reveals which client industries pay the most per project, guiding your client acquisition strategy.
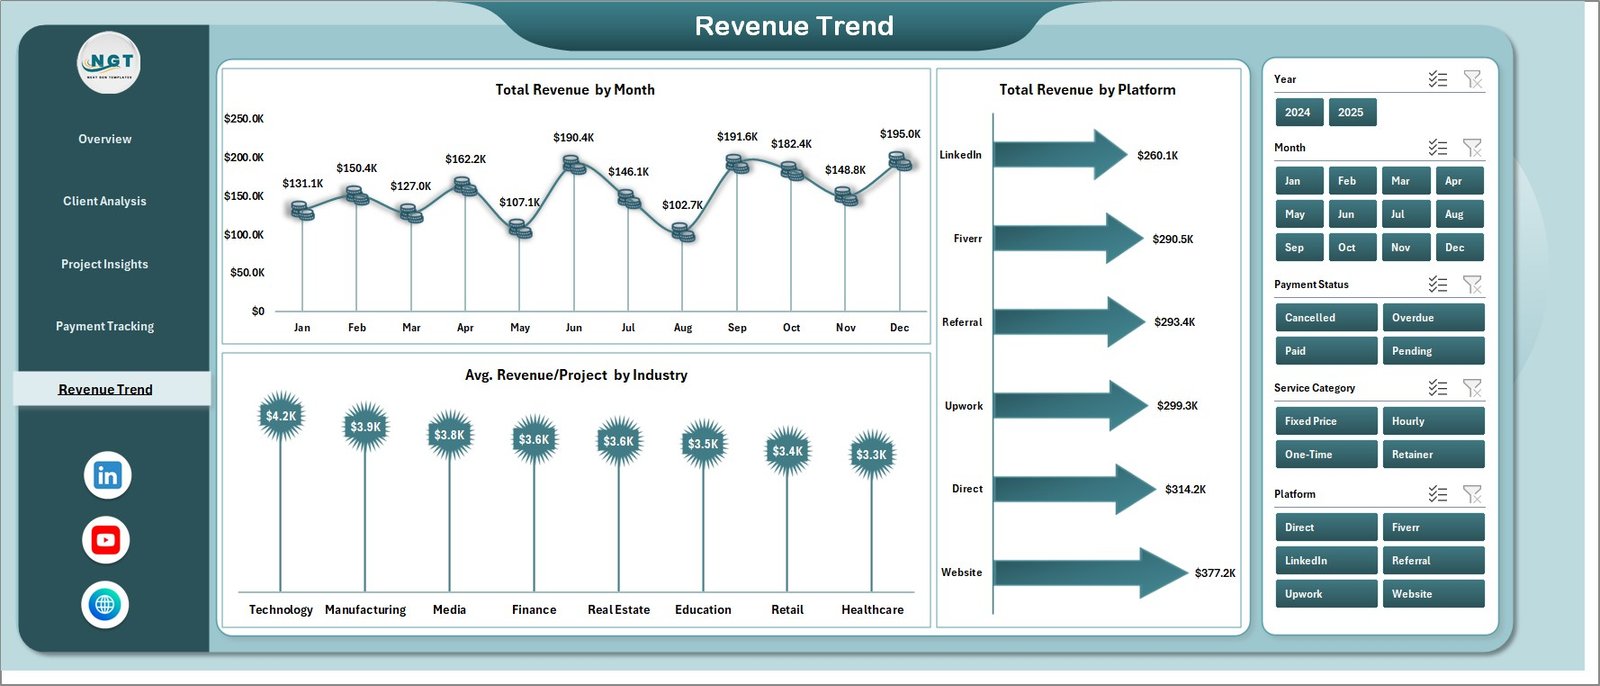
Revenue Trend
6. Data Sheet
The Data Sheet is your data entry hub. Simply add your freelance project records — including client name, project type, platform, service category, hours, cost, revenue, payment method, payment status, and client rating — in the same column format. When you update this sheet and refresh the dashboard, all 5 analysis pages update automatically.
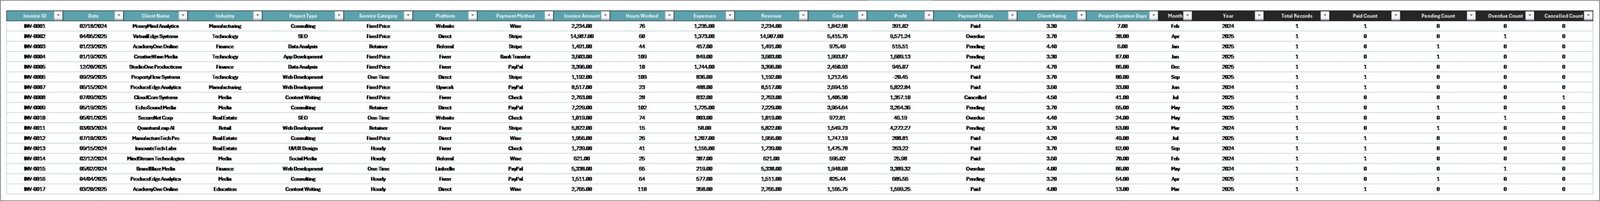
Data Sheet tab
7. Support Sheet
The Support Sheet contains all the pivot tables that power every chart across the 5 dashboard pages. After updating your data in the Data Sheet, navigate to the Data tab in the Excel Ribbon and click Refresh All. Every pivot table recalculates and every chart updates instantly. You can keep this sheet hidden during regular use to maintain a clean dashboard experience.
Support sheet tab
Advantages of Freelancer Business Dashboard in Excel
This dashboard eliminates the chaos of tracking freelance finances across multiple spreadsheets and tools. By consolidating all your business data into one interactive template, you save hours of manual work every month while gaining deeper insights into your business performance.
The pivot-powered architecture means the dashboard is completely formula-driven — no VBA or macros needed. This makes it compatible with Microsoft Excel 2016 and later versions on both Windows and Mac. The slicer-based filtering lets you drill into any dimension instantly, whether you want to analyze a specific client, platform, service category, or time period.
For freelancers who work across multiple platforms and serve diverse client industries, this dashboard provides the cross-cutting analysis needed to make strategic decisions about where to invest your time and energy for maximum profitability.
Opportunities for Improvement
While the dashboard excels at providing visual analytics, it currently relies on manual data entry in the Data Sheet. Freelancers who use invoicing software or time-tracking tools may want to export data from those platforms and paste it into the Data Sheet. Adding an expense breakdown by category (such as software subscriptions, marketing costs, and equipment) would further enhance the financial picture. A dedicated tax estimation section could also be valuable for freelancers who need to plan quarterly tax payments.
Best Practices
Update your Data Sheet weekly or bi-weekly to keep your dashboard current and actionable. Use consistent naming conventions for clients, platforms, and service categories to ensure clean data aggregation. Refresh all pivot tables after every data update by clicking Data then Refresh All in the Excel ribbon. Review the Overview page first for a quick health check, then drill into specific analysis pages based on what needs attention. Use the slicers on the Overview page to compare performance across different time periods or service categories side by side.
Explore Relevant Templates
📌 Click here to Purchase Freelancer Business Dashboard in Excel
🔹 Freelance Business KPI Scorecard in Google Sheets — A KPI-focused scorecard for freelancers with Actual vs Target comparisons and trend charts.
🔹 Personal Finance Dashboard in Excel — Track personal income, expenses, budgets, and savings alongside your freelance business finances.
🔹 Personal Finance Dashboard in Power BI — Advanced financial analytics with 5 interactive Power BI pages for comprehensive financial tracking.
For more Excel dashboard templates, explore our complete collection at Excel Dashboard Templates. You can also learn more about Excel dashboard creation techniques on Microsoft Excel Support.
FAQs
What is the best Excel dashboard template for freelancers?
The Freelancer Business Dashboard in Excel from NextGenTemplates is one of the most comprehensive freelance analytics templates available. It includes 5 interactive pages covering overview metrics, client analysis, project insights, payment tracking, and revenue trends — all in a single Excel file ready for immediate use.
How many KPIs does the Freelancer Business Dashboard in Excel track?
The dashboard tracks 5 key performance indicators on the Overview page: Total Records, Total Cost, Total Revenue, Net Profit, and Avg. Revenue/Project. Additional analysis across 5 interactive pages covers over 15 different charts and metrics including profit margins by service category, revenue by platform, payment status tracking, and monthly revenue trends.
Do I need VBA or macros to use this dashboard?
No. The Freelancer Business Dashboard in Excel is 100% formula and pivot-table based. No VBA or macros are required. It works in Microsoft Excel 2016 and later versions without needing to enable macros.
Can I track multiple freelancing platforms in this dashboard?
Yes. The data structure supports multiple platforms, and the dashboard includes platform-level analysis in the Project Insights page showing Net Profit by Platform and in the Revenue Trend page showing Total Revenue by Platform. You can track Upwork, Fiverr, Freelancer.com, direct clients, and any other platform.
How do I update the data in this dashboard?
Navigate to the Data Sheet tab and add your freelance project records in the same column format as the sample data. Then go to the Data tab in the Excel Ribbon and click Refresh All. All pivot tables and charts across all 5 dashboard pages will update automatically.
Who should use the Freelancer Business Dashboard in Excel?
This dashboard is designed for any freelancer or self-employed professional who wants to track business performance systematically. It is ideal for graphic designers, web developers, content writers, marketing consultants, business consultants, photographers, videographers, and any independent professional managing multiple clients and projects.
Conclusion
The Freelancer Business Dashboard in Excel is a must-have analytics tool for any freelancer serious about growing their business. With 5 interactive pages, dynamic KPI cards, slicer-based filtering, and pivot-powered auto-refresh, it transforms your raw project data into clear, actionable insights that drive smarter business decisions. Stop guessing and start tracking your freelance performance with precision.
📌 Click here to Purchase Freelancer Business Dashboard in Excel
🎥 Visit our YouTube channel to learn step-by-step video tutorials
👉 Youtube.com/@PK-AnExcelExpert