The Open Universities KPI Dashboard in Excel tracks 20+ performance indicators across 7 structured worksheets, covering enrollment rates, graduation rates, student satisfaction scores, course completion percentages, and faculty performance indices. The template includes MTD and YTD trend charts, conditional formatting arrows, and a built-in KPI definition library. Open universities that switch from manual spreadsheet reporting to this dashboard cut their monthly reporting time from 3 days to under 10 minutes.
📊 Click here to Purchase the Open Universities KPI Dashboard in Excel
Whether you manage an open university, distance learning institution, or online education provider, tracking KPIs manually across disconnected files leads to delayed decisions and inconsistent metrics. This ready-to-use Excel template centralizes all university performance data into a single, formula-driven dashboard that updates automatically when you enter new numbers.
 y Features of Open Universities KPI Dashboard in Excel
📊 Click here to Purchase the Open Universities KPI Dashboard in Excel
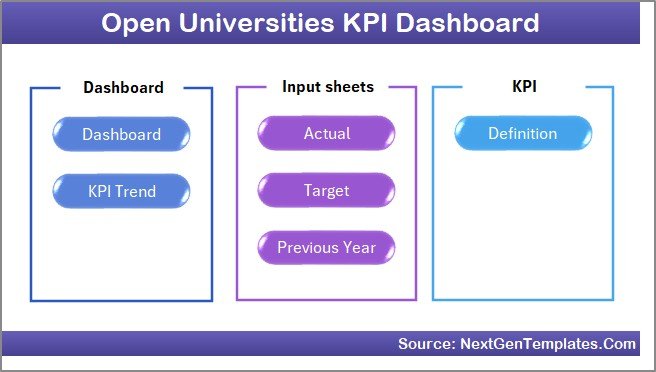
The Open Universities KPI Dashboard in Excel includes 7 worksheets designed for structured university performance monitoring. The Dashboard sheet displays all KPIs with Actual, Target, and Previous Year data for both MTD and YTD periods. The KPI Trend sheet provides individual metric analysis with side-by-side trend charts. Here are the main features:
- Dynamic Dashboard View — Displays all university KPIs with MTD Actual, Target, and Previous Year data alongside YTD comparisons. Select any month from the dropdown on cell D3 and the entire dashboard refreshes instantly with updated variance calculations and conditional formatting arrows.
- Individual KPI Trend Analysis — The KPI Trend sheet lets you pick any KPI from a dropdown on cell C3 and view its Group, Unit, Type (LTB or UTB), Formula, and Definition alongside MTD and YTD trend charts comparing Actual, Target, and Previous Year numbers.
- One-Click Navigation Home Page — The Home sheet provides 6 quick-access buttons to jump directly to the Dashboard, KPI Trend, Actual Input, Target Input, Previous Year, and KPI Definition sheets.
- Structured Data Entry System — Three separate input sheets for Actual Numbers, Target Numbers, and Previous Year Numbers keep data organized. Change the starting month on cell E1 to align with your fiscal calendar.
- Built-in KPI Knowledge Base — The KPI Definition sheet stores each KPI’s name, group, unit, formula, definition, and type (LTB or UTB) so every team member understands what each metric tracks.
- Conditional Formatting Indicators — Up and down arrows with color coding instantly highlight performance direction for Target vs Actual and Previous Year vs Actual comparisons.
- Zero-Macro Formula-Driven Design — All calculations run on native Excel formulas with no VBA macros, ensuring compatibility with Excel 2016+, Microsoft 365, Mac, and Excel Online.
Dashboard Pages Explanation
1. Home Sheet
Home PageThe Home sheet is an index page where 6 navigation buttons provide one-click access to the Dashboard, KPI Trend, Actual Numbers Input, Target Number Input, Previous Year Number, and KPI Definition sheets. This eliminates scrolling through tabs and gives every user a consistent starting point.
2. Dashboard Sheet
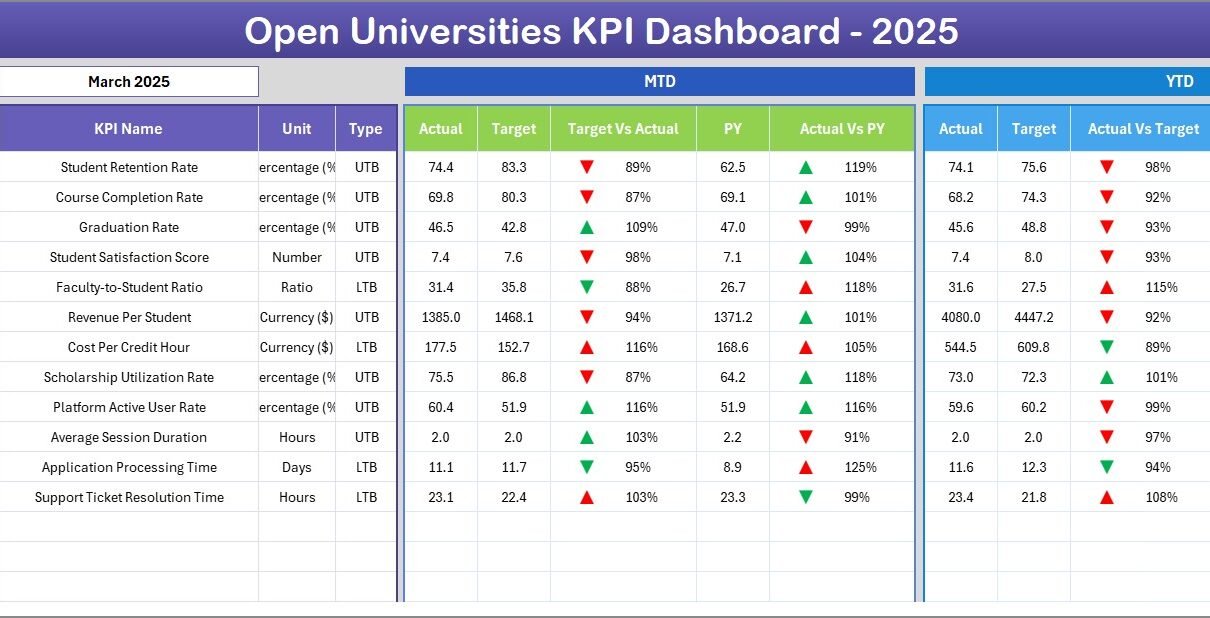
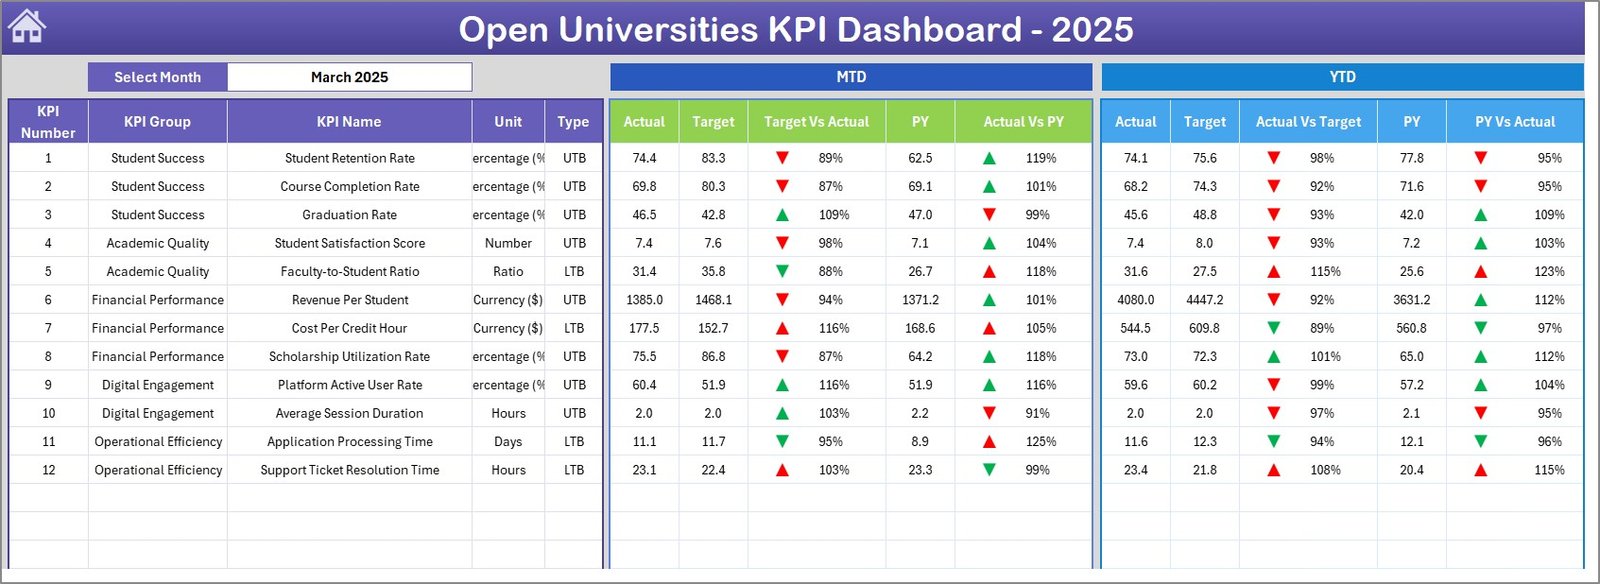 Open Universities KPI Dashboard
The Dashboard sheet is the main analytical view. On cell D3, select any month from the dropdown. The entire dashboard updates to show MTD Actual, Target, and Previous Year data alongside YTD Actual, Target, and Previous Year data. Conditional formatting arrows (up/down with color coding) instantly indicate whether Target vs Actual and Previous Year vs Actual performance is improving or declining.
3. KPI Trend Sheet
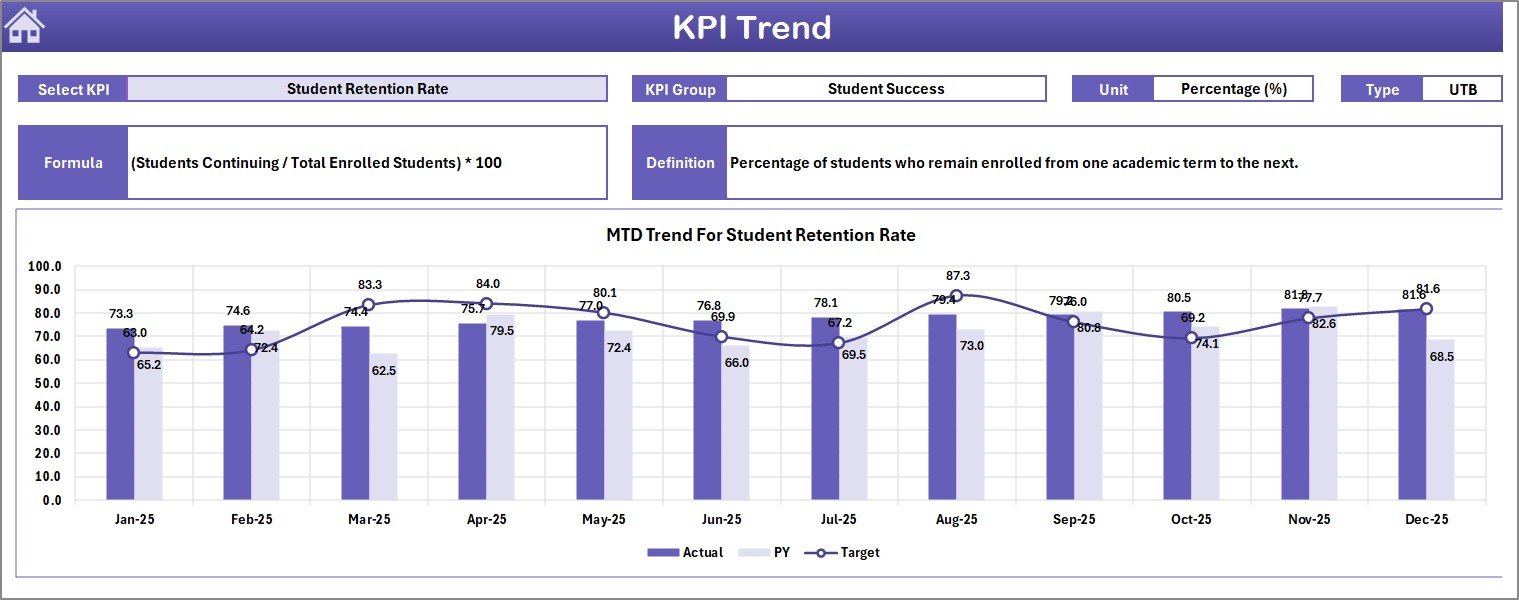 KPI Trend Sheet
Select any KPI name from the dropdown on cell C3. The sheet displays the KPI Group, Unit of KPI, Type of KPI (Lower the Better or Upper the Better), Formula of the KPI, and Definition of the KPI. Below these details, MTD and YTD trend charts show Actual, Target, and Previous Year numbers side by side for detailed performance analysis over 12 months.
4. Actual Numbers Input Sheet
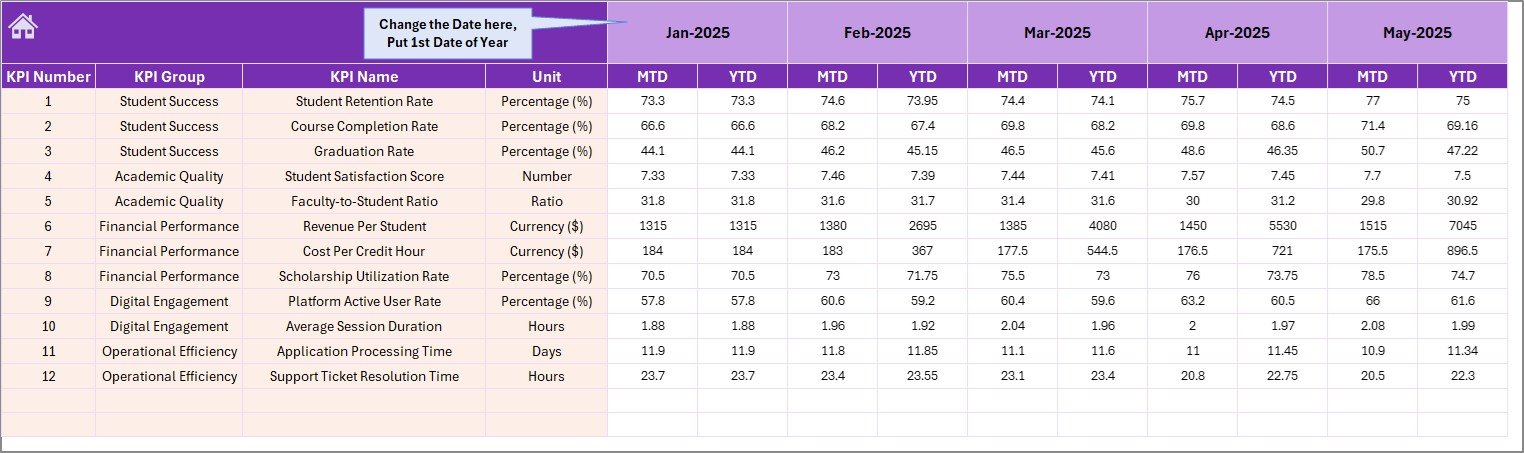 Actual Numbers Input Sheet
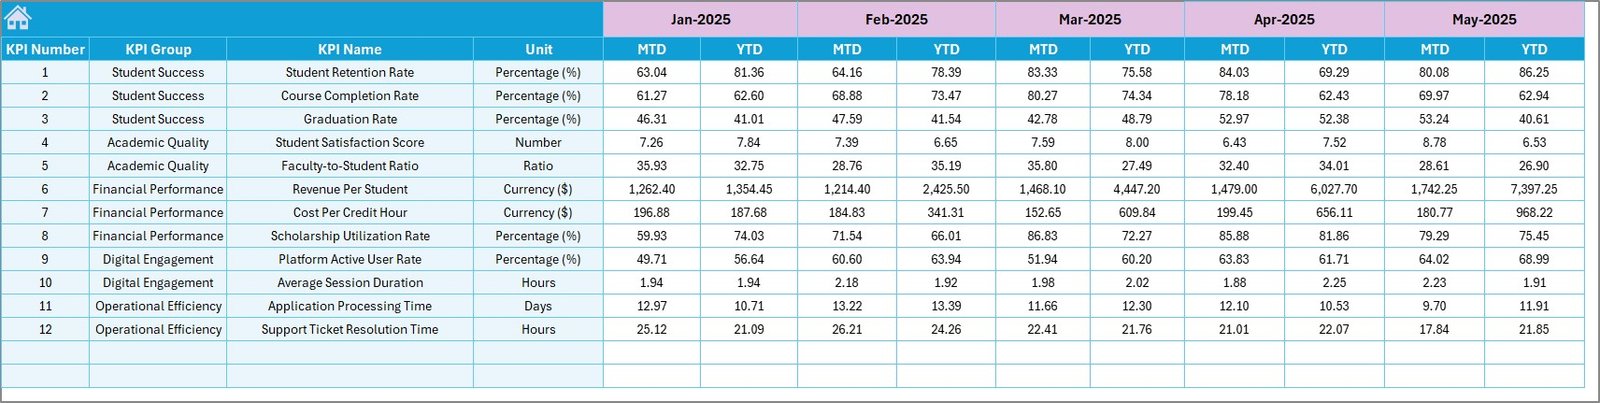
Enter actual performance numbers for YTD and MTD for each month. Change the starting month on cell E1 to align with your institution’s fiscal year. The sheet is structured so each row corresponds to a specific KPI and each column to a monthly period.
5. Target Number Input Sheet
 Target Number Input Sheet
Enter target numbers for each KPI per month as MTD and YTD values. These targets feed into the Dashboard sheet’s variance calculations, showing how actual performance compares against planned goals.
6. Previous Year Number Sheet
 Previous Year Number Input Sheet
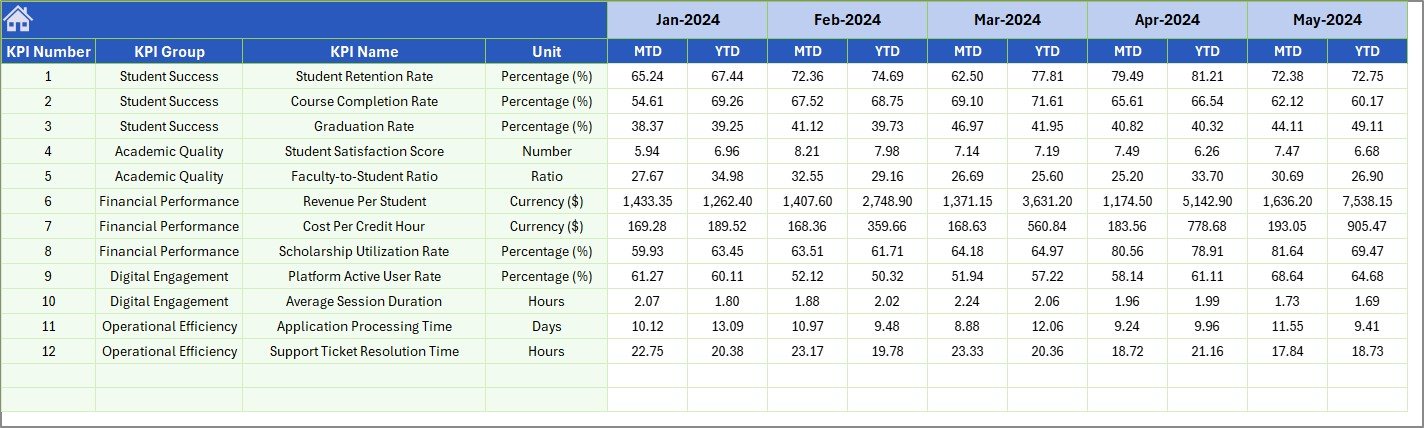
Enter prior year data using the same format as the current year. This enables the Dashboard sheet to calculate year-over-year performance changes and display PY vs Actual comparisons with conditional formatting indicators.
7. KPI Definition Sheet
 KPI Definition Sheet
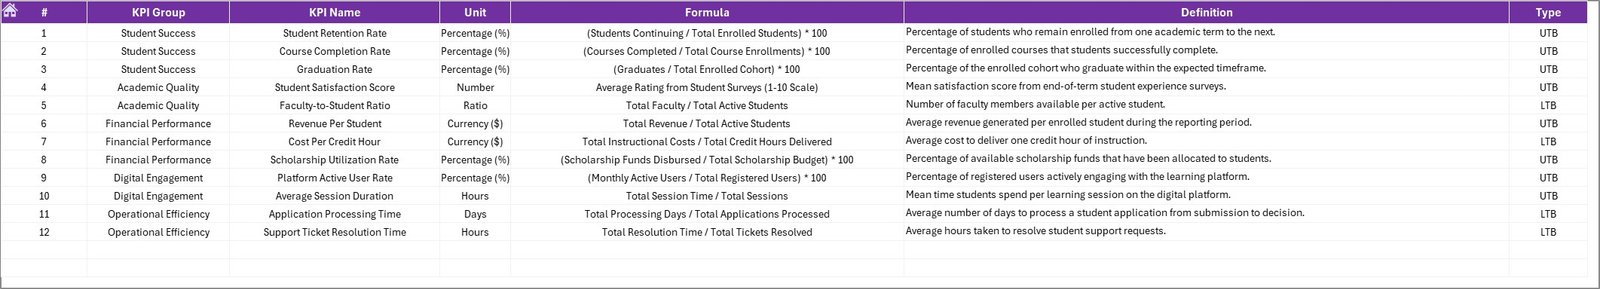
Enter the KPI Name, KPI Group, Unit, Formula, and KPI Definition. In the last column, enter the KPI Type as LTB (Lower the Better) or UTB (Upper the Better). This sheet serves as a reference guide so all stakeholders understand exactly what each metric tracks and how it is calculated.
Open Universities KPI Dashboard vs. Google Sheets Dashboard vs. Blackboard Analytics — Feature Comparison
| Feature | Open Universities KPI Dashboard in Excel | Google Sheets Dashboard | Blackboard Analytics |
|---|---|---|---|
| Cost | $14.99 one-time | Free (build from scratch) | $5,000-25,000/year |
| Platform | Microsoft Excel (desktop + web) | Google Sheets (web only) | Cloud-based SaaS |
| Setup Time | Under 10 minutes | 4-8 hours (manual build) | 4-12 weeks onboarding |
| Real-time Collaboration | Via SharePoint/OneDrive | ✅ Native | ✅ Native |
| Offline Access | ✅ Full offline | ❌ Requires internet | ❌ Requires internet |
| Customizable KPIs | ✅ Unlimited | ✅ Manual setup | Limited to plan tier |
| MTD/YTD Trend Charts | ✅ Built-in | Manual chart creation | ✅ Built-in |
| KPI Definition Library | ✅ Included | ❌ Not included | Partial |
| Year-1 Cost (5 users) | $14.99 total | $0 | $5,000-25,000 |
For open university teams that want structured KPI tracking without paying thousands for enterprise analytics, the Open Universities KPI Dashboard in Excel sits in the sweet spot.
📊 Click here to Purchase the Open Universities KPI Dashboard in Excel
Who Should Use This Template
Perfect for:
- Open university administrators tracking enrollment, retention, and graduation KPIs across programs
- Distance learning coordinators monitoring course completion rates and student satisfaction scores
- Academic quality assurance teams comparing actual performance against accreditation targets
- Education consultants reporting university KPIs to boards and funding agencies
- Department heads at institutions with 500 to 50,000+ students needing monthly performance reviews
Not a fit if:
- You need real-time automated data feeds from your LMS (Moodle, Canvas, Blackboard) — this template requires manual data entry or copy-paste from exports
- Your institution requires SOC 2 compliance and role-based access controls at the dashboard level — consider enterprise BI tools instead
Real-World Use Cases
📊 Click here to Purchase the Open Universities KPI Dashboard in Excel
Dr. Meera runs academic affairs at a 15,000-student open university in Southeast Asia. She uses this dashboard to track 22 KPIs including enrollment growth rate, dropout rate, course completion percentage, and faculty-to-student ratio. Each quarter, she selects the latest month from the dropdown and presents the auto-generated MTD and YTD comparisons to the Vice Chancellor — replacing a 3-day manual report process with a 10-minute review.
James coordinates distance learning programs at a UK-based open university. He tracks student satisfaction scores, assignment submission rates, and tutor response times across 8 programs. The conditional formatting arrows immediately flag KPIs that dropped below target, allowing his team to intervene before the semester ends.
Fatima works as an education consultant advising 3 open universities in the Middle East. She uses the Online Universities KPI Dashboard alongside this template to benchmark performance across institutions, ensuring all universities measure metrics using identical formulas through the shared KPI Definition sheet.
Advantages of Open Universities KPI Dashboard in Excel
📊 Click here to Purchase the Open Universities KPI Dashboard in Excel
- Instant Clarity — All KPIs visible on one screen with automatic MTD/YTD calculations. No more compiling data from 5 different spreadsheets.
- Cost Efficiency — At $14.99 one-time, this template costs less than 1 hour of a consultant’s time. Compare that to $5,000-25,000/year for Blackboard Analytics or similar enterprise tools.
- Standardized Definitions — The KPI Definition sheet ensures everyone in the organization calculates and interprets metrics identically, eliminating reporting inconsistencies.
- Year-over-Year Benchmarking — Built-in Previous Year comparisons let you track long-term improvement trends without building additional formulas.
- Platform Flexibility — Works offline on desktop Excel, online via Microsoft 365, and on Mac. Share via OneDrive or SharePoint with no per-user fees.
Opportunities for Improvement
- The template does not include automated data import from LMS platforms like Moodle or Canvas — you need to enter or paste data manually each month.
- There is no built-in email alerting system for KPIs that fall below target thresholds. You would need to set up Excel conditional alerts separately or use Power Automate.
- The dashboard displays monthly granularity. If your institution needs weekly or daily KPI tracking, you would need to modify the input sheet structure.
Best Practices
📊 Click here to Purchase the Open Universities KPI Dashboard in Excel
- Update the Actual Numbers Input sheet at the end of each month to keep the dashboard current and useful for leadership reviews.
- Use the KPI Definition sheet as a shared reference document during team onboarding — it ensures new staff understand every metric from day one.
- Set targets at the beginning of the academic year in the Target sheet so you can track progress throughout the year rather than retroactively.
- Share the file on OneDrive or SharePoint so multiple departments can view the dashboard without emailing file copies back and forth.
- Review the KPI Trend sheet quarterly to identify patterns — consistent upward trends confirm effective programs, while flat or declining trends signal where intervention is needed.
Explore Relevant Templates
📊 Online Universities KPI Dashboard in Excel — Track online university KPIs with the same 7-sheet structure optimized for digital-first institutions
📊 Student Exchange Programs KPI Dashboard in Excel — Monitor student exchange applications, participation, and outcomes with MTD/YTD tracking
📊 Education Services Dashboard in Power BI — Advanced multi-page education analytics with interactive slicers for larger institutions
📊 Corporate Universities Dashboard in Power BI — Track corporate training KPIs including completion rates, assessment scores, and program costs
📊 Browse all KPI Dashboard Templates on NextGenTemplates
Frequently Asked Questions
📊 Click here to Purchase the Open Universities KPI Dashboard in Excel
What KPIs does the Open Universities KPI Dashboard in Excel track?
The Open Universities KPI Dashboard in Excel tracks 20+ KPIs including enrollment rate, graduation rate, student satisfaction score, course completion percentage, dropout rate, faculty-to-student ratio, and research output index. All metrics update automatically when you replace the sample data with your own.
How long does setup take for this dashboard?
Setup takes under 10 minutes. Enter your KPI definitions in the KPI Definition sheet, set targets in the Target sheet, add prior year data, and input current month actuals. The Dashboard and KPI Trend sheets calculate everything automatically.
Can I customize the KPIs for my specific university?
Yes. The KPI Definition sheet lets you add, rename, or modify any KPI including its group, unit, formula, and definition. The dashboard adapts to whatever metrics your institution needs to track.
Does this work on Mac and Excel Online?
Yes. The Open Universities KPI Dashboard in Excel uses native Excel formulas with no VBA macros. It is compatible with Excel 2016+, Microsoft 365, Mac Excel, and Excel Online without any issues.
How does this compare to Blackboard Analytics or Canvas Data?
Blackboard Analytics costs $5,000-25,000 per year and requires weeks of onboarding. This dashboard costs $14.99 one-time, works offline, and is ready in 10 minutes. For institutions that need structured KPI tracking without LMS integration, this template delivers the insight at a fraction of the cost.
Can multiple team members use this dashboard?
Yes. Save the file on OneDrive or SharePoint for real-time team collaboration. There are no per-user licensing fees. Your entire department can access and view the dashboard at no extra cost.
Do you offer similar templates for other education areas?
Yes. NextGenTemplates offers the Student Exchange Programs KPI Dashboard, Education Services Dashboard in Power BI, and Corporate Universities Dashboard in Power BI for different education analytics needs.
About the Author
Built by PK — Microsoft Certified Professional with 15+ years of Excel, Google Sheets, and Power BI experience. Founder of NextGenTemplates, reaching 300K+ subscribers across YouTube channels. Every template is hand-built and tested before release.
Conclusion
The Open Universities KPI Dashboard in Excel gives university administrators, quality assurance teams, and education consultants a structured, formula-driven system for tracking 20+ KPIs with MTD/YTD comparisons, trend charts, and year-over-year benchmarking — all in one Excel file.
📊 Click here to Purchase the Open Universities KPI Dashboard in Excel
✅ Instant download · One-time payment · No subscription
🎥 Visit our YouTube channel for step-by-step tutorials: Youtube.com/@PK-AnExcelExpert