Catering Business KPI Scorecard in Excel is a ready-to-use, interactive Excel scorecard template designed for catering business owners, event catering managers, and food service professionals who need structured KPI tracking. This template includes 4 interactive worksheets covering Scorecard, KPI Trend, Input Data, and KPI Definition — with built-in MTD and YTD analysis, trend charts, and conditional formatting across all catering-specific metrics. Whether you run a small boutique catering company or manage a corporate catering division, this Excel scorecard tracks revenue per event, food cost percentage, labor cost ratio, customer satisfaction, repeat booking rate, and more — all in one centralized, auto-updating workbook.
Catering businesses that still rely on scattered spreadsheets and manual tracking lose critical visibility into cost overruns, waste trends, and service quality gaps. The Catering Business KPI Scorecard in Excel from NextGenTemplates solves this by consolidating all essential catering KPIs into a single dashboard with automatic calculations and traffic-light indicators. If you are looking for the best KPI Dashboard Templates for catering and food service businesses, this is one of the most focused options available.
Catering Business KPI Scorecard in Excel
Key Features of Catering Business KPI Scorecard in Excel
The Catering Business KPI Scorecard in Excel includes 4 structured worksheets designed specifically for catering businesses. The Scorecard sheet displays all KPIs with Actual vs Target values, MTD and YTD comparisons, and color-coded performance indicators that let you spot underperformance at a glance. The KPI Trend sheet generates monthly trend charts for any selected KPI, comparing Actual, Target, and Previous Year numbers side by side — making it simple to identify seasonal patterns and performance shifts.
This template tracks essential catering metrics including revenue per event, food cost percentage, labor cost ratio, customer satisfaction score, repeat booking rate, on-time delivery rate, waste percentage, and average order value. Each KPI is categorized by group, measured in its proper unit, and includes a formula and definition for consistency across your team. The Input Data sheet accepts actual values, targets, and previous year data for 12 months — and every chart, indicator, and calculation updates automatically with zero manual recalculation.
The entire workbook is 100% formula-based — no VBA, no macros, no add-ins required. It works in Microsoft Excel 2016 and later, including Excel for Mac. This makes it a practical, offline-first alternative to paid catering management software that charges monthly per-user fees. For a similar KPI tracking experience in a different food service context, explore the Food Service KPI Scorecard in Excel.
Template Sheets Explanation
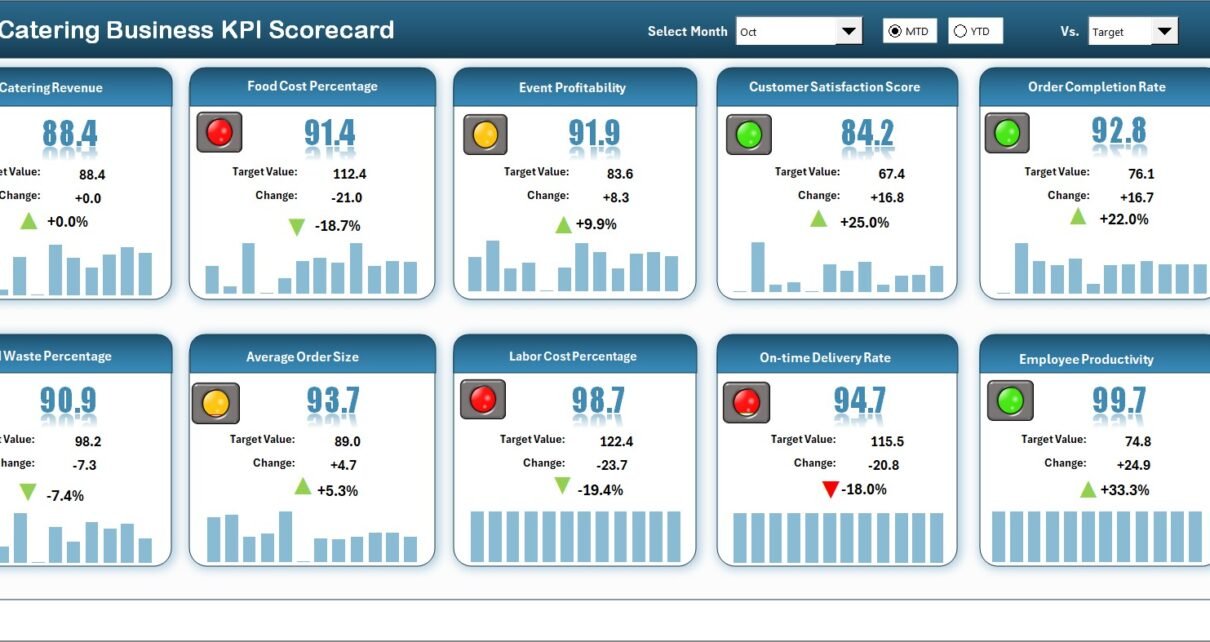
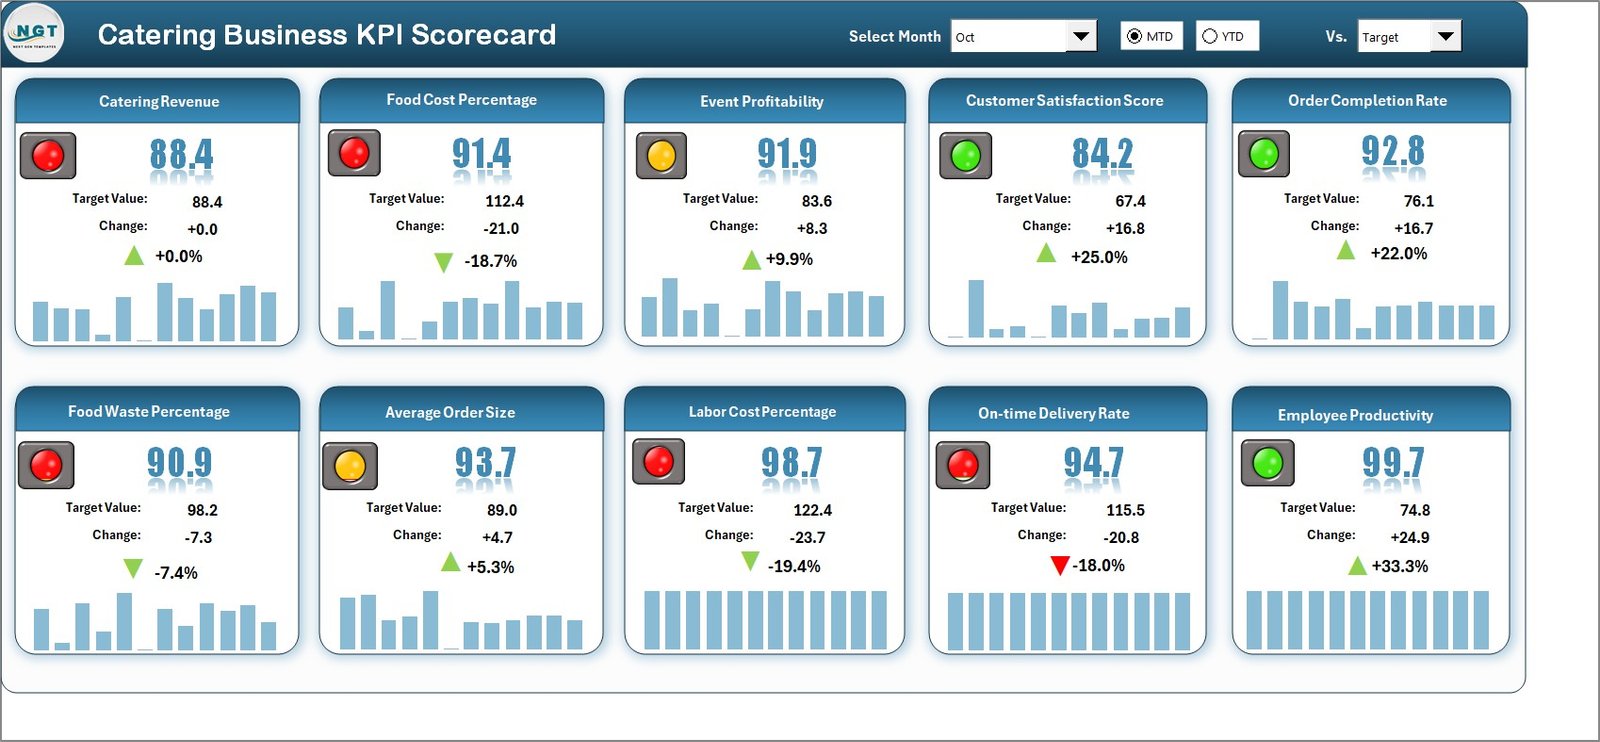
1 — Scorecard Sheet
The Scorecard sheet is the main interface where you view KPI performance. Dropdown menus let you select the month, MTD (Month-to-Date), or YTD (Year-to-Date) for performance analysis. Each KPI row displays Actual vs Target values with visual color-coded indicators — green for on-track, yellow for watch, red for attention needed. The sheet provides a full KPI overview displaying all relevant information including MTD and YTD comparisons, making it easy for catering managers to assess performance in under 30 seconds.
Scorecard Sheet
2 — KPI Trend Sheet
The KPI Trend sheet lets you select any KPI name from the dropdown on cell C3. Once selected, it displays the KPI Group, Unit of KPI, Type of KPI (Lower the Better or Upper the Better), Formula, and Definition. Below this metadata, MTD and YTD trend charts visualize Actual, Target, and Previous Year numbers across months — helping you detect cost fluctuations, efficiency drops, or quality inconsistencies over time.
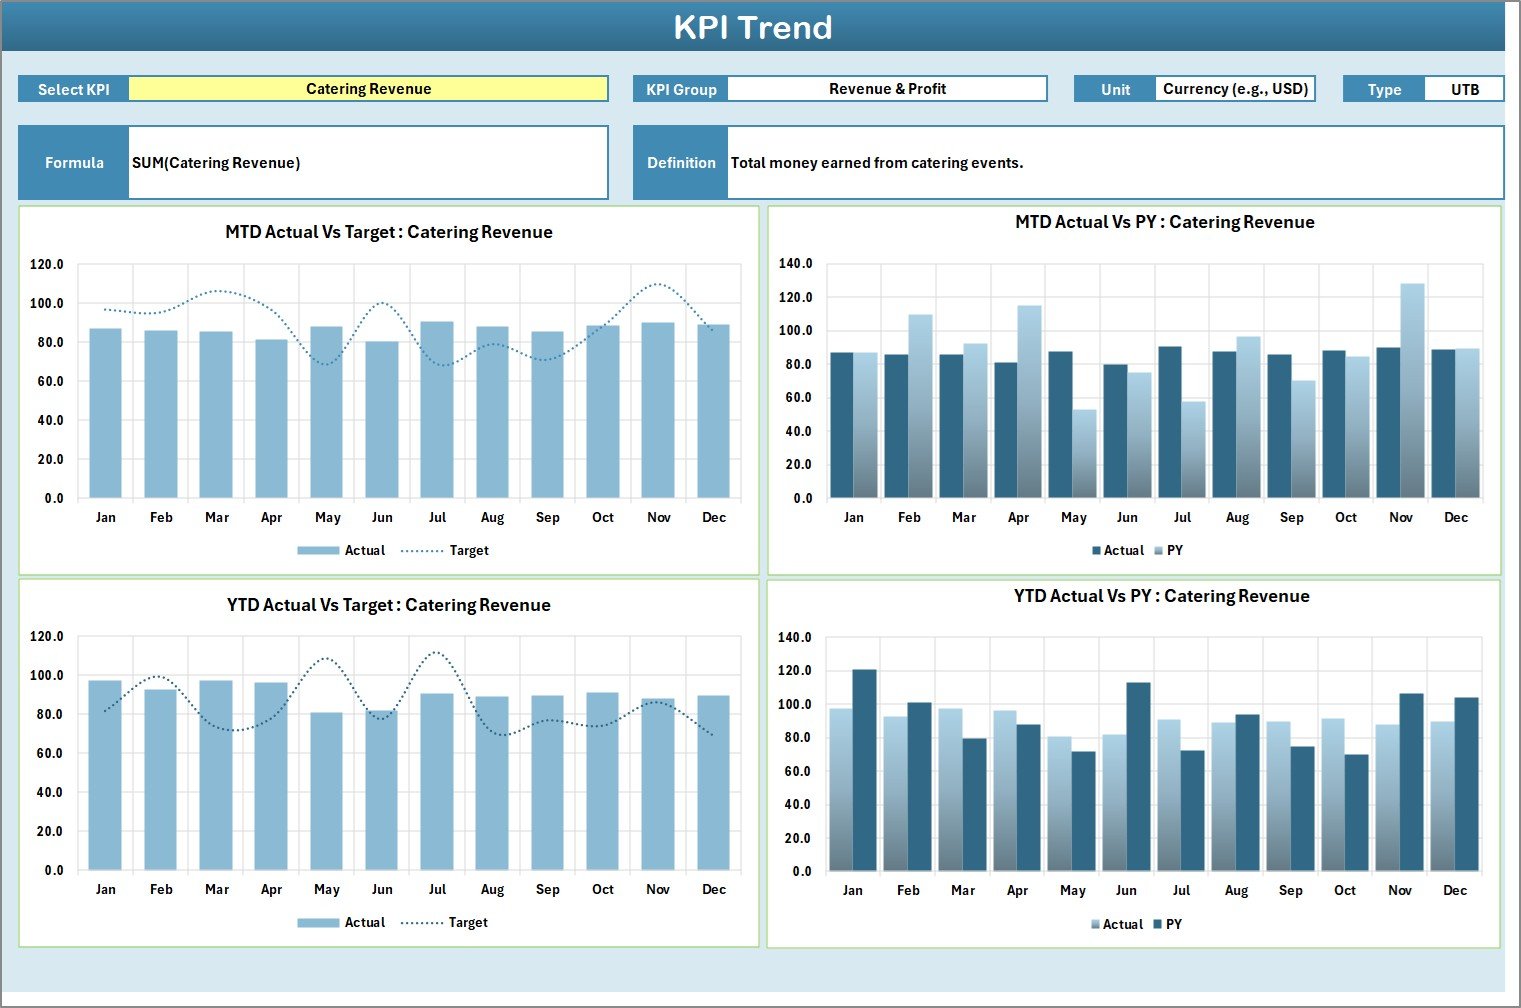
KPI Trend Sheet
3 — Input Data Sheet
The Input Data sheet is where you enter all KPI data. Record actual values, targets, and previous year metrics for each KPI across 12 months. The template is fully flexible — update data as new results become available, and the scorecard remains current. This sheet simplifies monthly updates, ensuring data stays current and consistent across the entire workbook.
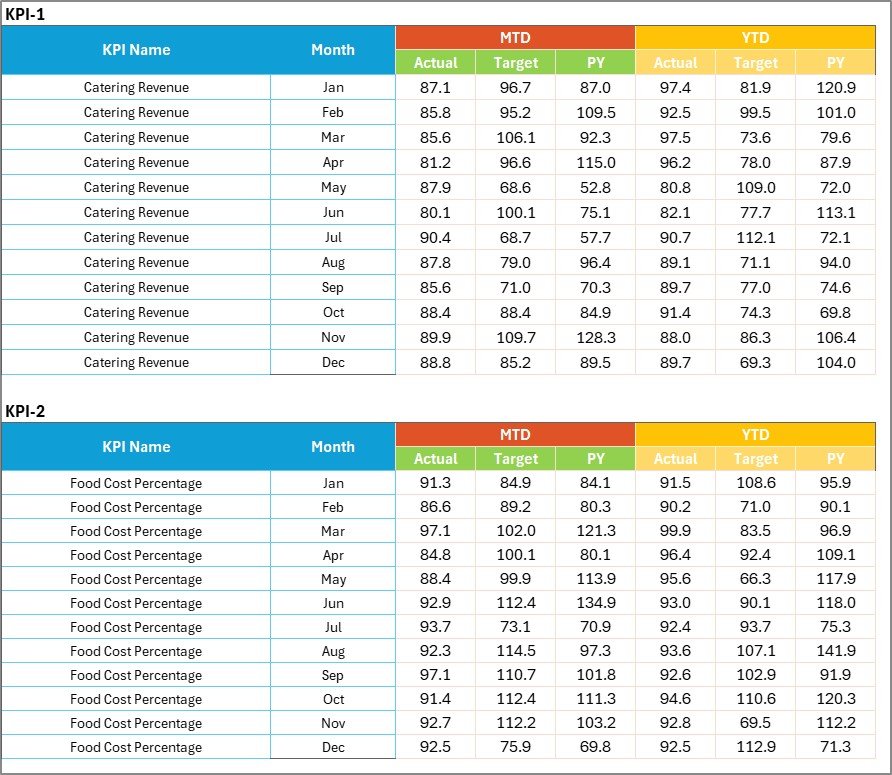
Input Data Sheet
4 — KPI Definition Sheet
In this sheet, you enter the KPI Name, KPI Group, Unit, Formula, and KPI Definition. Having this standardized reference ensures every team member — from kitchen managers to finance staff — measures performance consistently using the same definitions and calculation methods. You can freely add, remove, or modify KPIs to match your specific catering business model.
KPI Definition Sheet
Catering Business KPI Scorecard vs. Google Sheets vs. Paid Catering Software — Feature Comparison
| Feature | Catering Business KPI Scorecard in Excel | Google Sheets KPI Scorecard | CaterTrax / Total Party Planner |
|---|---|---|---|
| Cost | $12.99 one-time | Free (manual setup) | $50–200/month |
| Platform | Microsoft Excel | Google Sheets (browser) | Cloud SaaS |
| Setup Time | Under 10 minutes | 2–4 hours (build from scratch) | 1–2 weeks onboarding |
| MTD & YTD Analysis | ✅ Built-in | ❌ Manual formulas needed | ✅ Included |
| KPI Trend Charts | ✅ Auto-generated | ❌ Build manually | ✅ Included |
| Offline Access | ✅ Full offline | ❌ Requires internet | ❌ Cloud only |
| Customizable KPIs | ✅ Add/remove freely | ✅ Manual | ⚠️ Limited |
| Year-1 Cost (5 users) | $12.99 total | $0 (DIY effort) | $600–2,400 |
For catering businesses that want structured KPI tracking without paying monthly software fees, the Catering Business KPI Scorecard in Excel sits in the sweet spot.
Who Should Use This Template
👉 Click here to Purchase the Catering Business KPI Scorecard in Excel
✅ Perfect for:
- Catering company owners and managers tracking event profitability, food costs, and service quality metrics
- Corporate catering managers monitoring vendor performance, customer satisfaction, and delivery efficiency
- Wedding and event catering businesses tracking repeat bookings, revenue per event, and waste reduction targets
- Small to mid-size catering operations (1–50 staff) that need structured KPI monitoring without SaaS subscription costs
❌ Not a fit if:
- You need real-time POS integration with automated data feeds from restaurant management systems
- You require enterprise-grade multi-location cloud sync with SOC 2 compliance and role-based access controls
Real-World Use Cases
Priya manages catering operations for a 35-person wedding catering company in Mumbai. She uses the Catering Business KPI Scorecard in Excel to track food cost percentage, on-time delivery rate, and customer satisfaction score month by month. Before using the scorecard, she relied on scattered WhatsApp notes and gut feeling — now she presents data-backed reports to her business partner every month, which has helped reduce food waste by 18% in three months.
David runs a corporate catering division for a hospitality group in Chicago. He tracks 15 KPIs including revenue per event, labor cost ratio, waste percentage, and repeat booking rate across his team. The MTD/YTD trend charts help him identify seasonal patterns and adjust staffing levels before peak months — eliminating the last-minute scramble that previously cost his team overtime every quarter.
Anya operates a boutique event catering business in London. With just 8 employees, she uses the scorecard to monitor average order value, client retention rate, and cost per plate. The traffic-light indicators immediately flag when food costs creep above her 32% target — saving her thousands in unchecked waste each quarter.
Advantages of Catering Business KPI Scorecard in Excel
👉 Click here to Purchase the Catering Business KPI Scorecard in Excel
The scorecard eliminates manual reporting by automating all calculations through Excel formulas and conditional formatting. Catering managers save hours of weekly reporting time because KPIs, charts, and indicators update the moment you enter new data. The MTD/YTD comparison feature provides both short-term and long-term visibility into catering performance — something that scattered spreadsheets cannot deliver.
Because the entire template runs in Microsoft Excel with no macros or external dependencies, it works offline, requires no software subscriptions, and can be shared via email or cloud storage. The $12.99 one-time price eliminates the $600–2,400 annual cost that paid catering management tools like CaterTrax charge for comparable KPI tracking functionality.
Opportunities for Improvement
While the scorecard covers core catering KPI tracking effectively, catering businesses with very large datasets spanning multiple years might benefit from upgrading to a Power BI or database-driven solution for faster processing. The template does not include automated data import from POS or accounting systems — advanced users could add this through Power Query connections. For catering chains requiring multi-location branch comparison dashboards, the Restaurant P&L Dashboard in Excel provides a more visual, page-based analytics experience.
Best Practices
Update your KPI data monthly — ideally within the first week of the new month — to keep the scorecard actionable. Use the KPI Definition sheet to align all team members on what each metric means and how it is calculated before starting data entry. Review the KPI Trend sheet quarterly to identify long-term patterns in food cost, customer satisfaction, and repeat bookings. Share the scorecard file with your accountant or business partner via OneDrive or email for collaborative review without any additional licenses required.
Explore Relevant Templates
🔹 Food Service KPI Scorecard in Excel — Track food service KPIs including COGS, table turnover, and customer retention with MTD/YTD analysis.
🔹 Bakery KPI Scorecard in Excel — Monitor bakery-specific metrics like production efficiency, waste rate, and sales per product line.
🔹 Restaurant P&L Dashboard in Excel — 5-page interactive dashboard for restaurant revenue, cost, and profitability analysis.
🔹 Food Delivery KPI Scorecard in Excel — Track food delivery performance with MTD/YTD analysis across delivery metrics.
🔹 Food Service KPI Scorecard in Google Sheets — Cloud-based alternative with the same KPI tracking structure in Google Sheets.
Frequently Asked Questions
👉 Click here to Purchase the Catering Business KPI Scorecard in Excel
What KPIs does the Catering Business KPI Scorecard in Excel track?
The Catering Business KPI Scorecard in Excel tracks catering-specific metrics including revenue per event, food cost percentage, labor cost ratio, customer satisfaction score, repeat booking rate, on-time delivery rate, waste percentage, and average order value. All KPIs are customizable through the KPI Definition sheet.
How long does it take to set up the Catering Business KPI Scorecard?
Setup takes under 10 minutes. Open the Excel file, review the pre-loaded KPI definitions, enter your actual data and targets in the Input Data sheet, and the Scorecard and Trend sheets update automatically with charts and conditional formatting indicators.
Can I add my own custom KPIs to this catering scorecard?
Yes. The KPI Definition sheet allows you to add, remove, or modify any KPI. Enter a new KPI name, group, unit, formula, and definition — then add corresponding data in the Input Data sheet. The scorecard adapts to your specific catering business needs.
How does this Excel scorecard compare to paid catering management software?
Paid catering software like CaterTrax costs $50–200 per month and requires onboarding. The Catering Business KPI Scorecard in Excel costs $12.99 one-time, works offline, and provides the same structured KPI tracking with MTD/YTD analysis and trend charts — without recurring fees.
Does this template work on Mac?
Yes. The Catering Business KPI Scorecard in Excel works on Microsoft Excel for Mac (2016 and later). It uses standard formulas and conditional formatting — no VBA or macros required for full functionality.
Can I use this scorecard for multiple catering locations?
You can duplicate the workbook for each location or add location-specific rows in the Input Data sheet. For multi-location analytics with centralized dashboards and branch comparison, consider the Restaurant P&L Dashboard in Excel.
Is there a Google Sheets version of this catering scorecard?
Yes. NextGenTemplates offers the Food Service KPI Scorecard in Google Sheets for cloud-based catering KPI tracking with real-time collaboration and browser access.
About the Author
Built by PK — Microsoft Certified Professional with 15+ years of Excel, Google Sheets, and Power BI experience. Founder of NextGenTemplates, reaching 300K+ subscribers across YouTube channels. Every template is hand-built and tested before release.
Conclusion
The Catering Business KPI Scorecard in Excel transforms scattered catering data into structured, actionable KPI tracking. With 4 interactive worksheets covering performance monitoring, trend analysis, data entry, and KPI definitions, this template gives catering businesses the same level of data-driven decision-making that paid SaaS tools provide — at a one-time cost of $12.99 with no recurring fees.
👉 Click here to Purchase the Catering Business KPI Scorecard in Excel
✅ Instant download · One-time payment · No subscription
🎥 Visit our YouTube channel to learn step-by-step video tutorials
👉 Youtube.com/@PK-AnExcelExpert
📅 Last updated: April 2026